 Some of you will be aware that there is a workshop on Climate Sensitivity this week at Schloss Ringberg in southern Germany. The topics to be covered include how sensitivity is defined (and whether it is even meaningful (Spoiler, yes it is)), what it means, how it can be constrained, what the different flavours signify etc. There is an impressive list of attendees with a very diverse range of views on just about everything, and so I am looking forward to very stimulating discussions.
IPCC
Unforced variations: Nov 2014
This month’s open thread. In honour of today’s New York Marathon, we are expecting the fastest of you to read and digest the final IPCC Synthesis report in sub-3 hours. For those who didn’t keep up with the IPCC training regime, the Summary for Policy Makers provides a more accessible target.
Also in the news, follow #ArcticCircle2014 for some great info on the Arctic Circle meeting in Iceland.
Ocean heat storage: a particularly lousy policy target + Update
The New York Times, 12 December 2027: After 12 years of debate and negotiation, kicked off in Paris in 2015, world leaders have finally agreed to ditch the goal of limiting global warming to below 2 °C. Instead, they have agreed to the new goal of limiting global ocean heat content to 1024 Joules. The decision was widely welcomed by the science and policy communities as a great step forward. “In the past, the 2 °C goal has allowed some governments to pretend that they are taking serious action to mitigate global warming, when in reality they have achieved almost nothing. I’m sure that this can’t happen again with the new 1024 Joules goal”, said David Victor, a professor of international relations who originally proposed this change back in 2014. And an unnamed senior EU negotiator commented: “Perhaps I shouldn’t say this, but some heads of state had trouble understanding the implications of the 2 °C target; sometimes they even accidentally talked of limiting global warming to 2%. I’m glad that we now have those 1024 Joules which are much easier to grasp for policy makers and the public.”
This fictitious newspaper item is of course absurd and will never become reality, because ocean heat content is unsuited as a climate policy target. Here are three main reasons why. [Read more…] about Ocean heat storage: a particularly lousy policy target + Update
Climate response estimates from Lewis & Curry
Guest commentary from Richard Millar (U. Oxford)
The recent Lewis and Curry study of climate sensitivity estimated from the transient surface temperature record is being lauded as something of a game-changer – but how much of a game-changer is it really?
[Read more…] about Climate response estimates from Lewis & Curry
References
- N. Lewis, and J.A. Curry, "The implications for climate sensitivity of AR5 forcing and heat uptake estimates", Climate Dynamics, vol. 45, pp. 1009-1023, 2014. http://dx.doi.org/10.1007/s00382-014-2342-y
Limiting global warming to 2 °C – why Victor and Kennel are wrong + update
In a comment in Nature titled Ditch the 2 °C warming goal, political scientist David Victor and retired astrophysicist Charles Kennel advocate just that. But their arguments don’t hold water.
It is clear that the opinion article by Victor & Kennel is meant to be provocative. But even when making allowances for that, the arguments which they present are ill-informed and simply not supported by the facts. The case for limiting global warming to at most 2°C above preindustrial temperatures remains very strong.
Let’s start with an argument that they apparently consider especially important, given that they devote a whole section and a graph to it. They claim:
The scientific basis for the 2 °C goal is tenuous. The planet’s average temperature has barely risen in the past 16 years. [Read more…] about Limiting global warming to 2 °C – why Victor and Kennel are wrong + update
IPCC attribution statements redux: A response to Judith Curry
I have written a number of times about the procedure used to attribute recent climate change (here in 2010, in 2012 (about the AR4 statement), and again in 2013 after AR5 was released). For people who want a summary of what the attribution problem is, how we think about the human contributions and why the IPCC reaches the conclusions it does, read those posts instead of this one.
The bottom line is that multiple studies indicate with very strong confidence that human activity is the dominant component in the warming of the last 50 to 60 years, and that our best estimates are that pretty much all of the rise is anthropogenic.
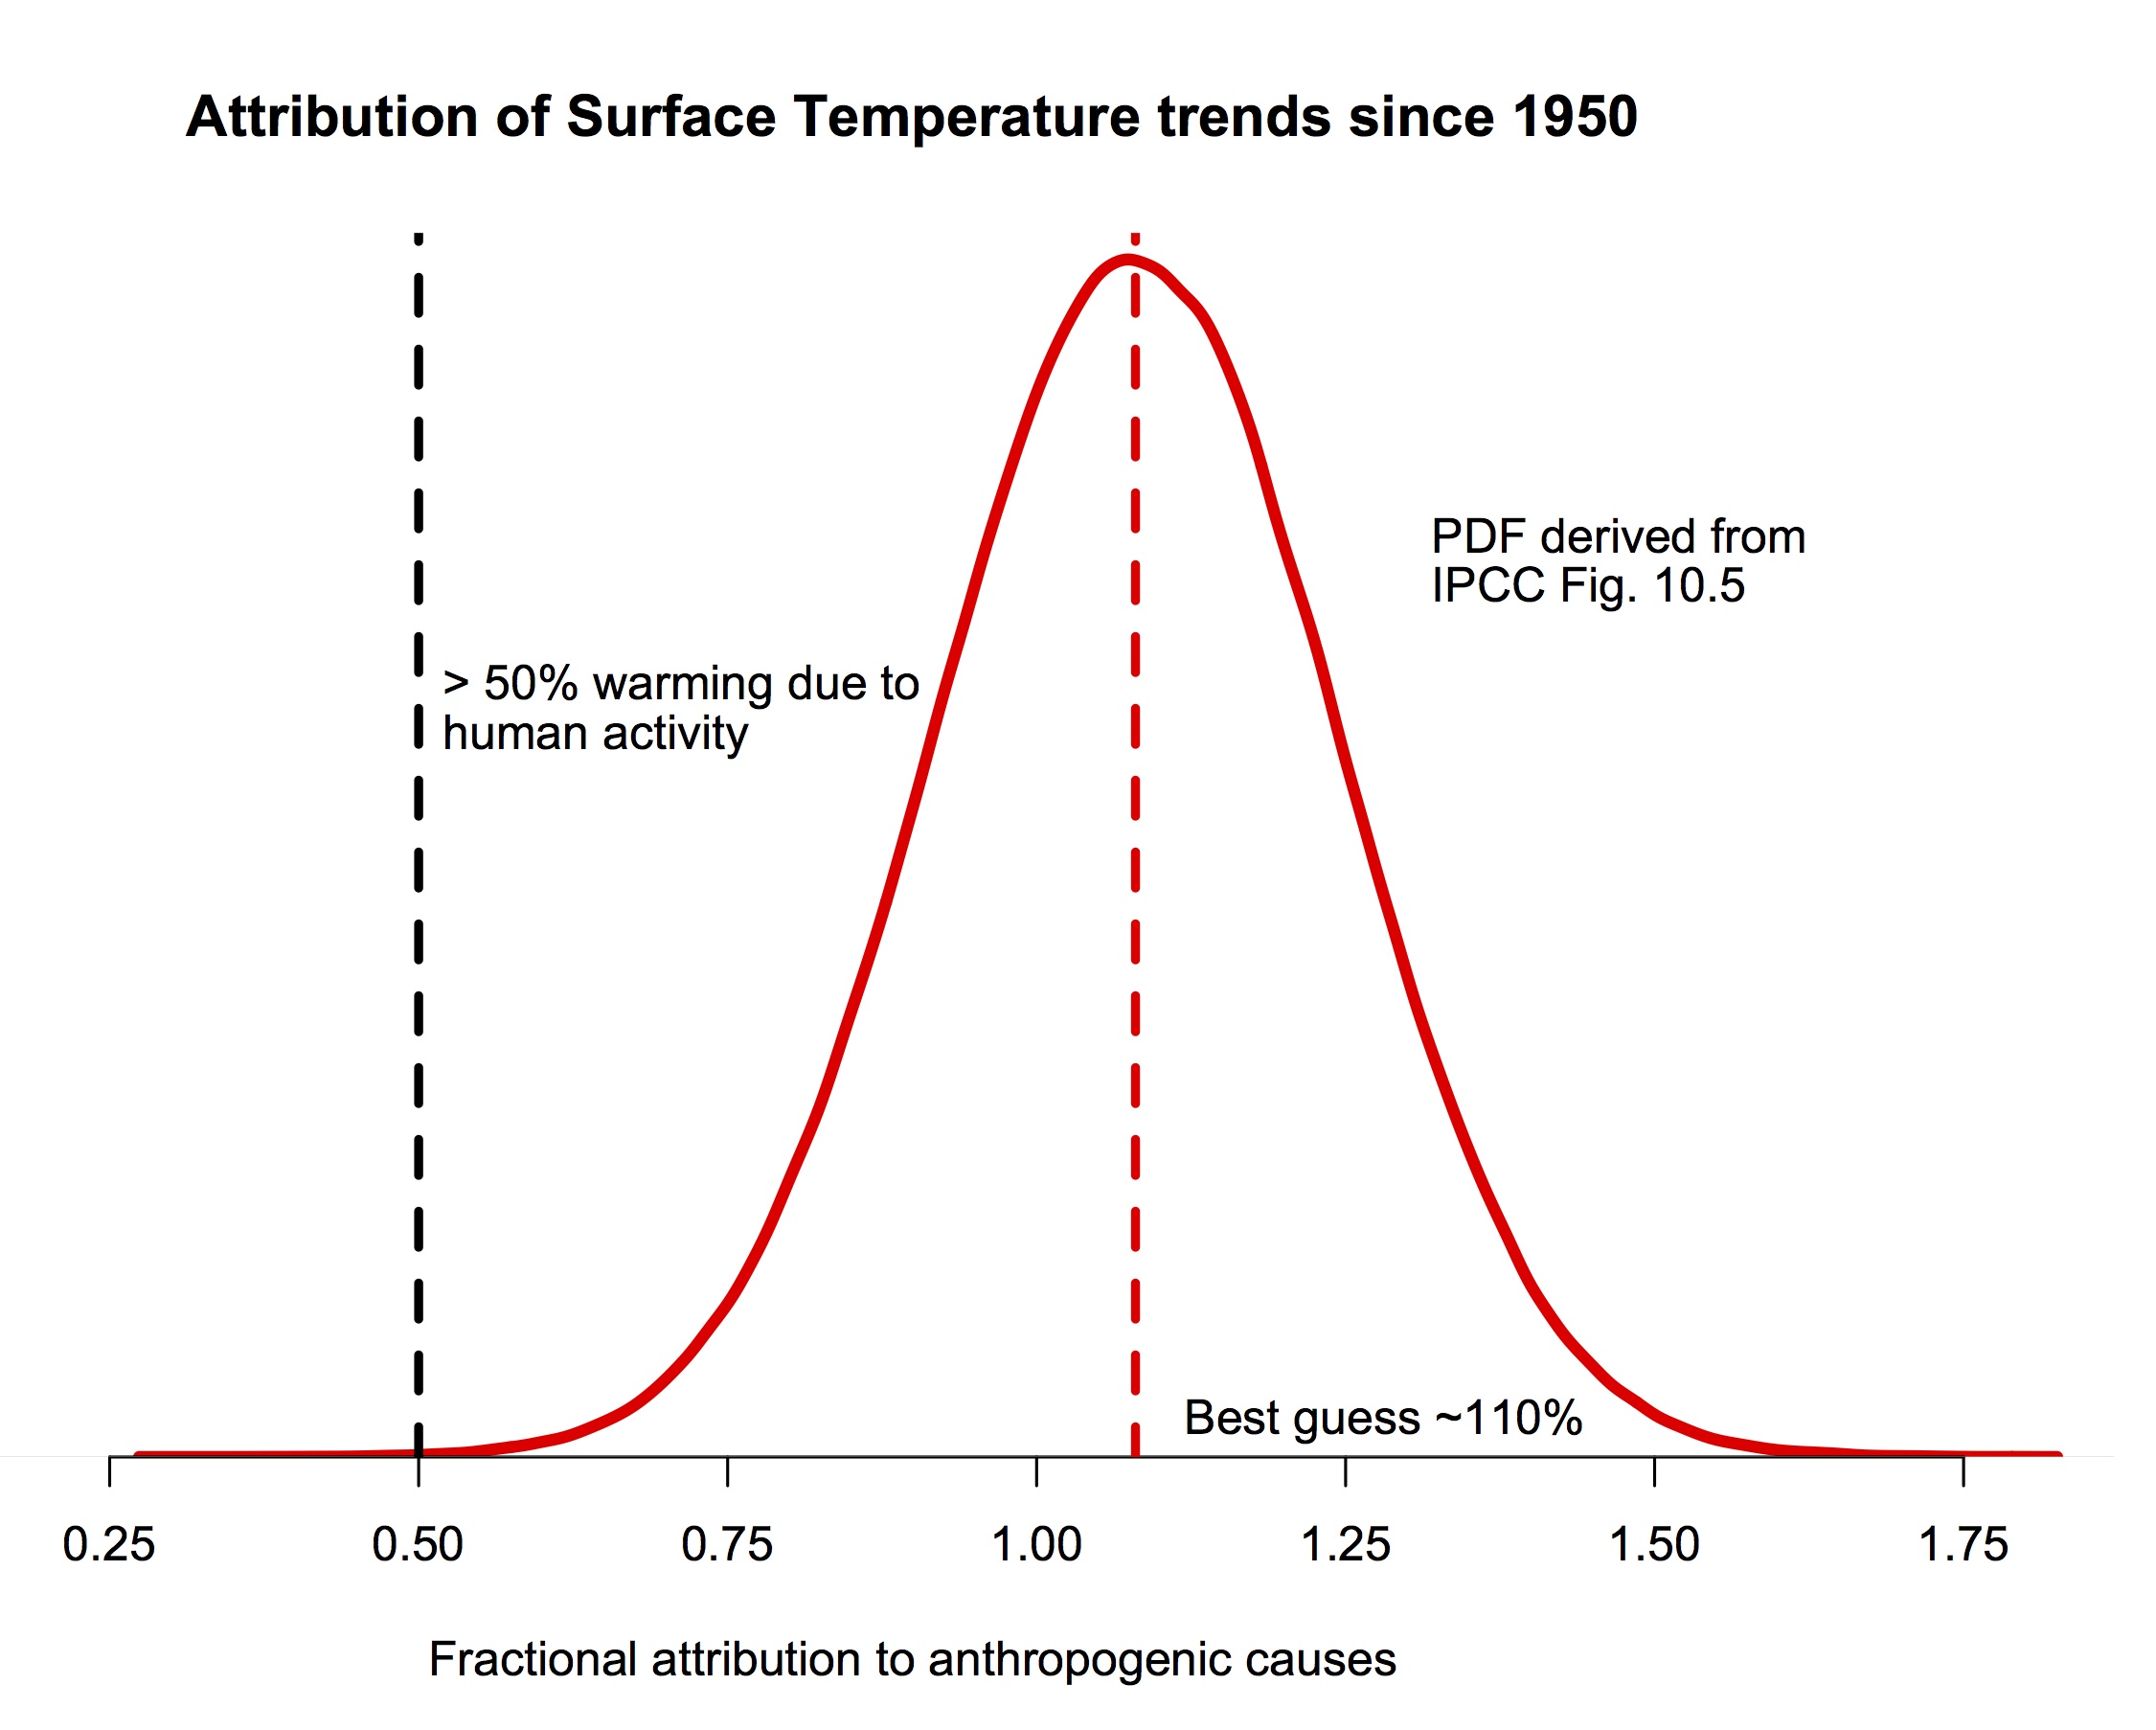
The probability density function for the fraction of warming attributable to human activity (derived from Fig. 10.5 in IPCC AR5). The bulk of the probability is far to the right of the “50%” line, and the peak is around 110%.
If you are still here, I should be clear that this post is focused on a specific claim Judith Curry has recently blogged about supporting a “50-50” attribution (i.e. that trends since the middle of the 20th Century are 50% human-caused, and 50% natural, a position that would center her pdf at 0.5 in the figure above). She also commented about her puzzlement about why other scientists don’t agree with her. Reading over her arguments in detail, I find very little to recommend them, and perhaps the reasoning for this will be interesting for readers. So, here follows a line-by-line commentary on her recent post. Please excuse the length.
[Read more…] about IPCC attribution statements redux: A response to Judith Curry
Mitigation of Climate Change – Part 3 of the new IPCC report

Guest post by Brigitte Knopf
Global emissions continue to rise further and this is in the first place due to economic growth and to a lesser extent to population growth. To achieve climate protection, fossil power generation without CCS has to be phased out almost entirely by the end of the century. The mitigation of climate change constitutes a major technological and institutional challenge. But: It does not cost the world to save the planet.
This is how the new report was summarized by Ottmar Edenhofer, Co-Chair of Working Group III of the IPCC, whose report was adopted on 12 April 2014 in Berlin after intense debates with governments. The report consists of 16 chapters with more than 2000 pages. It was written by 235 authors from 58 countries and reviewed externally by 900 experts. Most prominent in public is the 33-page Summary for Policymakers (SPM) that was approved by all 193 countries. At a first glance, the above summary does not sound spectacular but more like a truism that we’ve often heard over the years. But this report indeed has something new to offer.
The 2-degree limit
[Read more…] about Mitigation of Climate Change – Part 3 of the new IPCC report
Impacts of Climate Change – Part 2 of the new IPCC Report has been approved
The second part of the new IPCC Report has been approved – as usual after lengthy debates – by government delegations in Yokohama (Japan) and is now public. Perhaps the biggest news is this: the situation is no less serious than it was at the time of the previous report 2007. Nonetheless there is progress in many areas, such as a better understanding of observed impacts worldwide and of the specific situation of many developing countries. There is also a new assessment of “smart” options for adaptation to climate change. The report clearly shows that adaptation is an option only if efforts to mitigate greenhouse gas emissions are strengthened substantially. Without mitigation, the impacts of climate change will be devastating.

Guest post by Wolfgang Cramer
[Read more…] about Impacts of Climate Change – Part 2 of the new IPCC Report has been approved
IPCC WG2 report now out
Instead of speculations based on partial drafts and attempts to spin the coverage ahead of time, you can now download the final report of the IPCC WG2: “Climate Change 2014:Impacts, Adaptation, and Vulnerability” directly. The Summary for Policy Makers is here, while the whole report is also downloadable by chapter. Notably there are FAQ for the whole report and for each chapter that give a relatively easy way in to the details. Note too that these are the un-copyedited final versions, and minor edits, corrections and coherent figures will be forthcoming in the final published versions. (For reference, the WG1 report was released in Sept 2013, but only in final published form in Jan 2014). Feel free to link to interesting takes on the report in the comments.
A failure in communicating the impact of new findings

I was disappointed by the recent summary for policymakers (SPM) of the intergovernmental panel on climate change (IPCC) assessment report 5, now that I finally got around to read it. Not so much because of the science, but because the way it presented the science.
The report was written by top scientists, so what went wrong?
[Read more…] about A failure in communicating the impact of new findings