In the long run, sea-level rise will be one of the most serious consequences of global warming. But how fast will sea levels rise? Model simulations are still associated with considerable uncertainty – too complex and varied are the processes that contribute to the increase. A just-published survey of 90 sea-level experts from 18 countries now reveals what amount of sea-level rise the wider expert community expects. With successful, strong mitigation measures, the experts expect a likely rise of 40-60 cm in this century and 60-100 cm by the year 2300. With unmitigated warming, however, the likely range is 70-120 cm by 2100 and two to three meters by the year 2300.
[Read more…] about Sea-level rise: What the experts expect
IPCC
From global climate change to local consequences
Some will be luckier than others when it comes to climate change. The effects of a climate change on me will depend on where I live. In some regions, changes may not be as noticeable as in others. So what are the impacts in my region?
![]()
[Read more…] about From global climate change to local consequences
Sea level in the 5th IPCC report
What is happening to sea levels? That was perhaps the most controversial issue in the 4th IPCC report of 2007. The new report of the Intergovernmental Panel on Climate Change is out now, and here I will discuss what IPCC has to say about sea-level rise (as I did here after the 4th report).
Let us jump straight in with the following graph which nicely sums up the key findings about past and future sea-level rise: (1) global sea level is rising, (2) this rise has accelerated since pre-industrial times and (3) it will accelerate further in this century. The projections for the future are much higher and more credible than those in the 4th report but possibly still a bit conservative, as we will discuss in more detail below. For high emissions IPCC now predicts a global rise by 52-98 cm by the year 2100, which would threaten the survival of coastal cities and entire island nations. But even with aggressive emissions reductions, a rise by 28-61 cm is predicted. Even under this highly optimistic scenario we might see over half a meter of sea-level rise, with serious impacts on many coastal areas, including coastal erosion and a greatly increased risk of flooding.
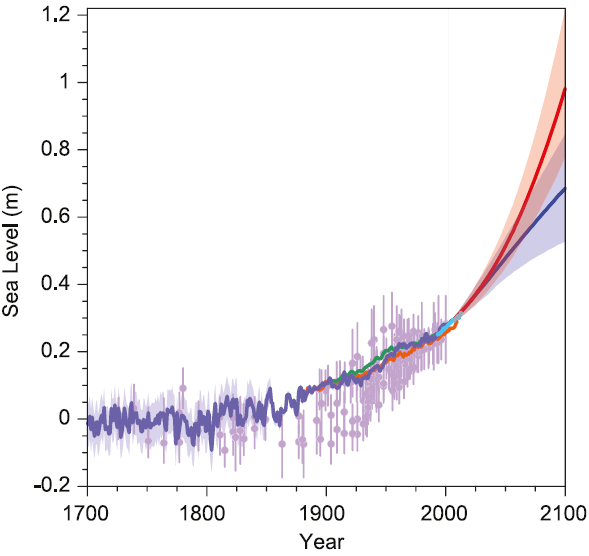
Fig. 1. Past and future sea-level rise. For the past, proxy data are shown in light purple and tide gauge data in blue. For the future, the IPCC projections for very high emissions (red, RCP8.5 scenario) and very low emissions (blue, RCP2.6 scenario) are shown. Source: IPCC AR5 Fig. 13.27.
[Read more…] about Sea level in the 5th IPCC report
The IPCC AR5 attribution statement
Last year I discussed the basis of the AR4 attribution statement:
Most of the observed increase in global average temperatures since the mid-20th century is very likely due to the observed increase in anthropogenic greenhouse gas concentrations.
In the new AR5 SPM (pdf), there is an analogous statement:
It is extremely likely that more than half of the observed increase in global average surface temperature from 1951 to 2010 was caused by the anthropogenic increase in greenhouse gas concentrations and other anthropogenic forcings together. The best estimate of the human-induced contribution to warming is similar to the observed warming over this period.
This includes differences in the likelihood statement, drivers and a new statement on the most likely amount of anthropogenic warming.
The evolution of radiative forcing bar-charts
As part of the IPCC WG1 SPM (pdf) released last Friday, there was a subtle, but important, change in one of the key figures – the radiative forcing bar-chart (Fig. SPM.4). The concept for this figure has been a mainstay of summaries of climate change science for decades, and the evolution over time is a good example of how thinking and understanding has progressed over the years while the big picture has not shifted much.
The Radiative-Forcing bar chart: AR5 version

[Read more…] about The evolution of radiative forcing bar-charts
Unforced Variations: Oct 2013
This month’s open thread. We’re going to guess that most of what people want to talk about is related to the IPCC WG1 AR5 report… Have at it!
The new IPCC climate report
The time has come: the new IPCC report is here! After several years of work by over 800 scientists from around the world, and after days of extensive discussion at the IPCC plenary meeting in Stockholm, the Summary for Policymakers was formally adopted at 5 o’clock this morning. Congratulations to all the colleagues who were there and worked night shifts. The full text of the report will be available online beginning of next week. Realclimate summarizes the key findings and shows the most interesting graphs.
Update 29 Sept: Full (un-copyedited) report available here.
Global warming
It is now considered even more certain (> 95%) that human influence has been the dominant cause of the observed warming since the mid-20th century. Natural internal variability and natural external forcings (eg the sun) have contributed virtually nothing to the warming since 1950 – the share of these factors was narrowed down by IPCC to ± 0.1 degrees. The measured temperature evolution is shown in the following graph.
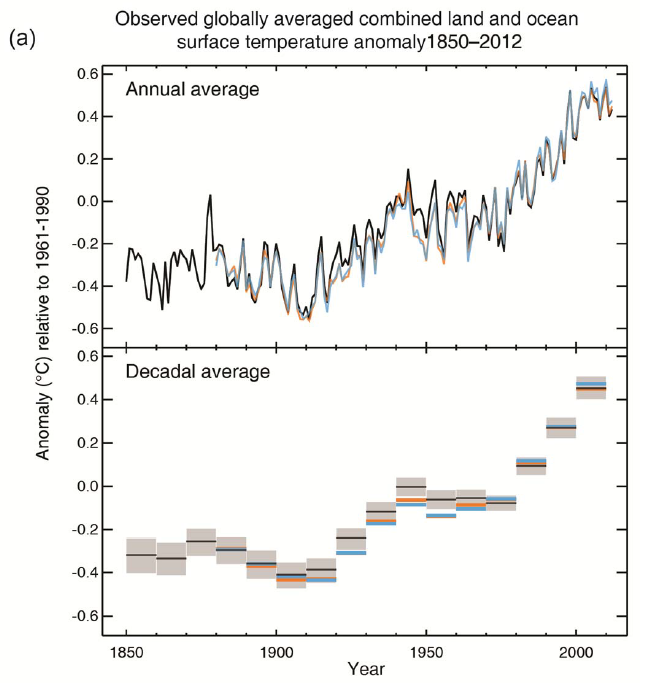
Figure 1 The measured global temperature curve from several data sets. Top: annual values. Bottom: averaged values over a decade.
[Read more…] about The new IPCC climate report
Yamal and Polar Urals: a research update
Guest commentary from Tim Osborn, Tom Melvin and Keith Briffa, Climatic Research Unit, UEA
Records of tree-ring characteristics such as their width (TRW) and density (usually the maximum density of the wood formed towards the end of the growing season – the “maximum latewood density” – MXD) are widely used to infer past variations in climate over recent centuries and even millennia. Chronologies developed from sites near to the elevational or latitudinal tree lines often show sensitivity to summer temperature and, because of their annual resolution, absolute dating and relatively widespread nature, they have contributed to many local, continental and hemispheric temperature reconstructions. However, tree growth is a complex biological process that is subject to a range of changing environmental influences, not just summer temperature, and so replication, coherence and consistency across records and other proxies are an important check on the results.
Tree-ring records have greater replication (both within a site and between nearby sites) than other types of climate proxy. Good replication helps to minimise the influence of random localised factors when extracting the common signal, and it also allows the comparison of information obtained from different independent sets or sub-sets of data. If independent sets of data – perhaps trees with different mean growth rates or from different sites – show similar variations, then we can have greater confidence that those variations are linked to real variations in climate.
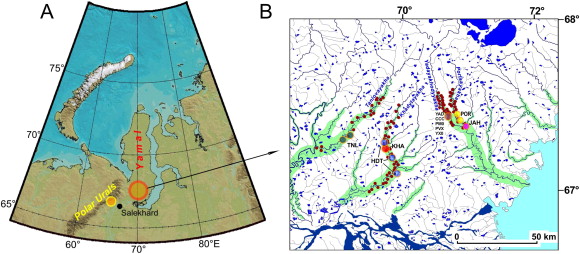
In a new QSR paper (Briffa et al., 2013), (BEA13) we have used these approaches to re-assess the combined tree-ring evidence from the Yamal and Polar Urals region (Yamalia) of northern Siberia, considering the common signal in tree-growth changes at different sites and in subsets of data defined in other ways. Together with our Russian colleagues and co-authors, we have incorporated many new tree-ring data, to increase the replication and to update the chronology to 2005 and have reassessed the inferences about summer temperature change that can be drawn from these data. The paper is published as an open-access paper (no paywall) and supplementary information including the raw tree-ring and instrumental temperature data are available from our website.
[Read more…] about Yamal and Polar Urals: a research update
References
- K.R. Briffa, T.M. Melvin, T.J. Osborn, R.M. Hantemirov, A.V. Kirdyanov, V.S. Mazepa, S.G. Shiyatov, and J. Esper, "Reassessing the evidence for tree-growth and inferred temperature change during the Common Era in Yamalia, northwest Siberia", Quaternary Science Reviews, vol. 72, pp. 83-107, 2013. http://dx.doi.org/10.1016/j.quascirev.2013.04.008
The PAGES-2k synthesis
Guest commentary by Darrell Kaufman (N. Arizona U.)
In a major step forward in proxy data synthesis, the PAst Global Changes (PAGES) 2k Consortium has just published a suite of continental scale reconstructions of temperature for the past two millennia in Nature Geoscience. More information about the study and its implications are available at the FAQ on the PAGES website and the datasets themselves are available at NOAA Paleoclimate.
The main conclusion of the study is that the most coherent feature in nearly all of the regional temperature reconstructions is a long-term cooling trend, which ended late in the 19th century, and which was followed by a warming trend in the 20th C. The 20th century in the reconstructions ranks as the warmest or nearly the warmest century in all regions except Antarctica. During the last 30-year period in the reconstructions (1971-2000 CE), the average reconstructed temperature among all of the regions was likely higher than anytime in at least ~1400 years. Interestingly, temperatures did not fluctuate uniformly among all regions at multi-decadal to centennial scales. For example, there were no globally synchronous multi-decadal warm or cold intervals that define a worldwide Medieval Warm Period or Little Ice Age. Cool 30-year periods between the years 830 and 1910 CE were particularly pronounced during times of weak solar activity and strong tropical volcanic eruptions and especially if both phenomena often occurred simultaneously.
[Read more…] about The PAGES-2k synthesis
References
- . , "Continental-scale temperature variability during the past two millennia", Nature Geoscience, vol. 6, pp. 339-346, 2013. http://dx.doi.org/10.1038/ngeo1797
Sea-level rise: Where we stand at the start of 2013 — Part 2
This is Part 2 of my thoughts on the state of sea-level research. Here is Part 1.
Sea-level cycles?
A topic that keeps coming up in the literature is the discussion on a (roughly) 60-year cycle in sea level data; a nice recent paper on this is Chambers et al. in GRL (2012). One thing I like about this paper is its careful discussion of the sampling issue of the tide gauges, which means that variability in the tide gauges is not necessarily variability in the true global mean sea level (see Part 1 of this post). I want to add some thoughts on the interpretation of this variability. Consider this graph from my Response to Comments in Science (2007):

Fig. 1: Fifteen-year averages of the global mean temperature (blue, °C, GISS data) and rate of sea level rise (red, cm/year, Church&white data), both detrended.
[Read more…] about Sea-level rise: Where we stand at the start of 2013 — Part 2
References
- D.P. Chambers, M.A. Merrifield, and R.S. Nerem, "Is there a 60‐year oscillation in global mean sea level?", Geophysical Research Letters, vol. 39, 2012. http://dx.doi.org/10.1029/2012GL052885
- S. Rahmstorf, "Response to Comments on "A Semi-Empirical Approach to Projecting Future Sea-Level Rise"", Science, vol. 317, pp. 1866-1866, 2007. http://dx.doi.org/10.1126/science.1141283