Dear US voters,
the world is holding its breath. The stakes are high in the upcoming US elections. At stake is a million times more than which email server one candidate used, or how another treated women. The future of humanity will be profoundly affected by your choice, for many generations to come.
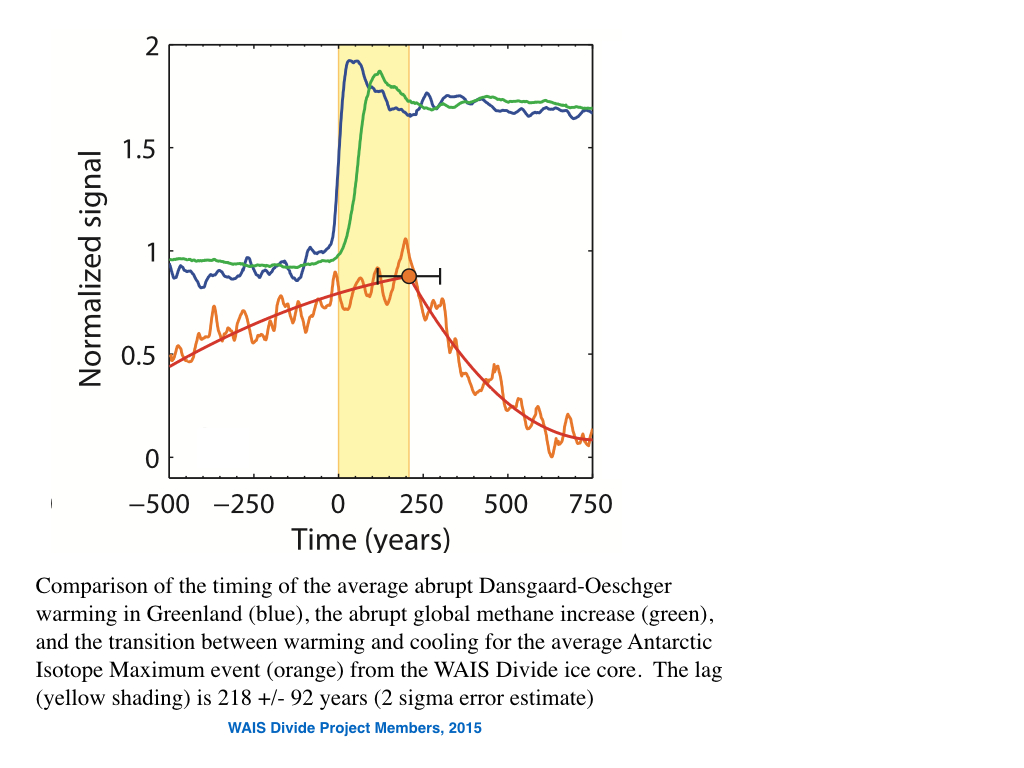
The coming four years is the last term during which a US government still has the chance, jointly with the rest of the world, to do what is needed to stop global warming well below 2°C and closer to 1.5°C, as was unanimously decided by 195 nations in the Paris Agreement last December. The total amount of carbon dioxide the world can still emit in order to have at least a 50% chance to stop warming at 1.5 °C will, at the current rate of emissions, be all used up in under ten years! This time can only be stretched out by making emissions fall rapidly.
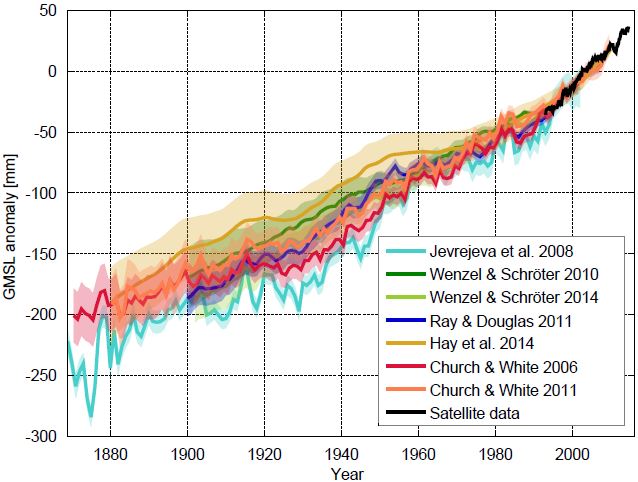
Even 2°C of global warming is very likely to spell the end of most coral reefs on Earth. 2°C would mean a largely ice-free Arctic ocean in summer, right up to the North Pole. Even 2°C of warming is likely to destabilize continental ice sheets and commit the world to many meters of sea-level rise, lasting for millennia. Further global warming will likely lead to increasing extreme weather, droughts, harvest failures, and the risk of armed conflict and mass migration.
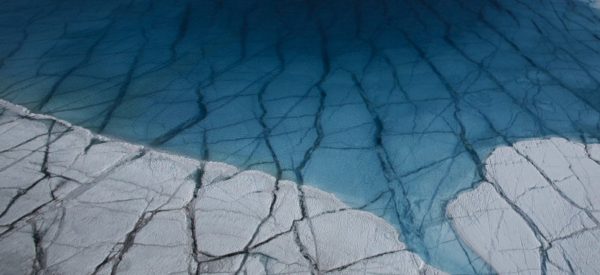
Meltwater on the Greenland Ice Sheet. Photo with kind permission by Ragnar Axelsson.
In case you have any doubts about the science: in the scientific community there is a long-standing consensus that humans are causing dangerous global warming, reflected in the clear statements of many scientific academies and societies from around the world. None of the 195 governments that signed the Paris Agreement saw any reasons for doubting the underlying scientific facts; doubts about the science that you see in some media are largely manufactured by interest groups trying to fool you.
You have a fateful choice to make. The policies of candidates and parties on climate change could hardly be more different. Hillary Clinton would continue to work with the international community to tackle the global warming crisis and help the transition to modern clean and renewable energies. Donald Trump denies that the problem even exists and has promised to go back to coal and to undo the Paris Agreement, which comes into force today, the 4th of November 2016, as culmination of over twenty years of negotiations.
Please consider this carefully. This is not an election about personalities, it is about policies that will determine our future for a long time to come. While the presidential race has gotten the most attention, voters should consider climate not just at the ‘top of the ticket’, but all the way down the ballot. Don’t make a choice that you, your children and your children’s children will regret forever.
David Archer, Rasmus Benestad, Ray Bradley, Michael Mann, Ray Pierrehumbert, Stefan Rahmstorf and Eric Steig
 As well as the current core team – David Archer, Eric Steig, Gavin Schmidt, Mike Mann, Rasmus Benestad, Ray Bradley, Ray Pierrehumbert, Stefan Rahmstorf – this blog has had input from many others over the years: