Lots of interesting methane papers this week. In Nature Geoscience, Shakhova et al (2013) have published a substantial new study of the methane cycle on the Siberian continental margin of the Arctic Ocean. This paper will get a lot of attention, because it follows by a few months a paper from last summer, Whiteman et al (2013), which claimed a strong (and expensive) potential impact from Arctic methane on near-term climate evolution. That economic modeling study was based on an Arctic methane release scenario proposed in an earlier paper by Shakhova (2010). In PNAS, Miller et al (2013) find that the United States may be emitting 50-70% more methane than we thought. So where does this leave us?
The Context
Because methane is mostly well-mixed in the atmosphere, emissions from the Arctic or from the US must be seen within the context of the global sources of methane to the atmosphere. Estimates of methane emissions from the Arctic have risen, from land (Walter et al 2006) as well now as from the continental shelf off Siberia. Call it 20-30 Tg CH4 per year from both sources. The US is apparently emitting more than we thought we were, maybe 30 Tg CH4 per year. But these fluxes are relatively small compared to the global emission rate of about 600 Tg CH4 per year. The Arctic and US anthropogenic are each about 5% of the total. Changes in the atmospheric concentration scale more-or-less with changes in the chronic emission flux, so unless these sources suddenly increase by an order of magnitude or more, they won’t dominate the atmospheric concentration of methane, or its climate impact.
American Methane Emissions Higher Than Previously Thought
Miller et al (2013) combine measurements of methane concentrations in various locations through time with model reconstructions of wind fields, and “invert” the information to estimate how much methane was released to the air as it blew over the land. This is a well-established methodology, pushed to constrain US anthropogenic emissions by including measurements from aircraft and communications towers in addition to the ever-invaluable NOAA flask sample network, and incorporating socioeconomic and industrial data. The US appears to be emitting 50-70% more methane than the EPA thought we were, based on “bottom up” accounting (adding up all the known sources).
Is this bad news for global warming?
Not really, because the one real hard fact that we know about atmospheric methane is that it’s concentration isn’t rising very quickly. Methane is a short-lived gas in the atmosphere, so to make it rise, the emission flux has to continually increase. This is in contrast to CO2, which accumulates in the atmosphere / ocean system, meaning that steady (non-rising) emissions still lead to a rising atmospheric concentration. There is enough uncertainty in the methane budget that tweaks of a few percent here and there don’t upset the apple cart. Since the methane concentration wasn’t rising all that much, its sources, uncertain as they are, have been mostly balanced by sinks, also uncertain. If anything, the paper is good news for people concerned about global warming, because it gives us something to fix.
Methane from the Siberian continental shelf
The Siberian continental shelf is huge, comprising about 20% of the global area of continental shelf. Sea level dropped during the last glacial maximum, but there was no ice sheet in Siberia, so the surface was exposed to the really cold atmosphere, and the ground froze to a depth of ~1.5 km. When sea level rose, the permafrost layer came under attack by the relatively warm ocean water. The submerged permafrost has been melting for millennia, but warming of the waters on the continental shelf could accelerate the melting. In equilibrium there should be no permafrost underneath the ocean, because the ocean is unfrozen, and the sediment gets warmer with depth below that (the geothermal temperature gradient).
Ingredients of Shakhova et al (2013)
- There are lots of bubbles containing mostly methane coming up from the shallow sea floor in the East Siberian Arctic shelf. Bubbles like this have been seen elsewhere, off Spitzbergen for example (Shakhova et al (2013)). Most of the seep sites in the Siberian margin are relatively low flow but a few of them are much larger.
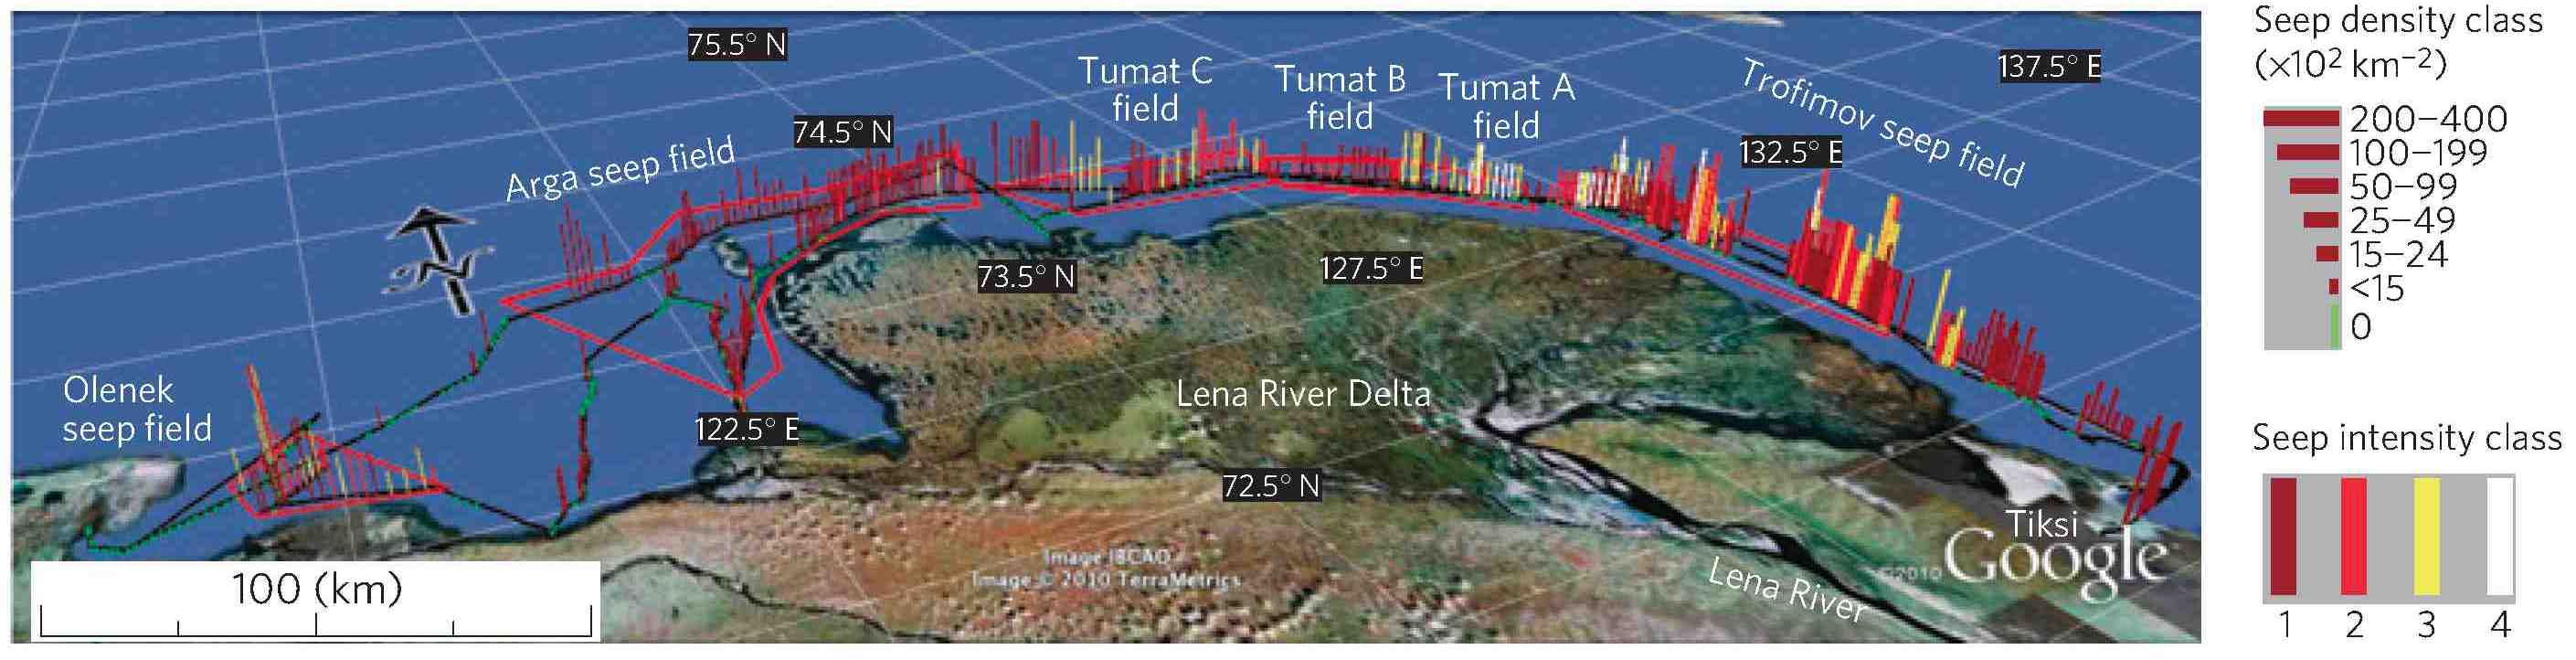
- The bubbles mostly dissolve in the water column, but when the methane flux gets really high the bubbles rise faster and reach the atmosphere better. When methane dissolves in the water column, some of it escapes to the atmosphere by evaporation before it gets oxidized to CO2. Storms seem to pull methane out of the water column, enhancing what oceanographers call “gas exchange” by making waves with whitecaps. Melting sea ice will also increase methane escape to the atmosphere by gas exchange. However, the concentration of methane in the water column is low enough that even with storms the gas exchange flux seems like it must be negligible compared with the bubble flux. In their calculation of the methane flux to the atmosphere, Shakhova et al focused on bubbles.
- Sediments that got flooded by rising sea level thousands of years ago are warmer than sediments still exposed to the colder atmosphere, down to a depth of ~50 meters. This information is not directly applied to the question of incremental melting by warming waters in the short-term future.
- The study derives an estimate of a total methane emission rate from the East Siberian Arctic shelf area based on the statistics of a very large number of observed bubble seeps.
Is the methane flux from the Arctic accelerating?
Shakhova et al (2013) argue that bottom water temperatures are increasing more than had been recognized, in particular in near-coastal (shallow) waters. Sea ice cover has certainly been decreasing. These factors will no doubt lead to an increase in methane flux to the atmosphere, but the question is how strong this increase will be and how fast. I’m not aware of any direct observation of methane emission increase itself. The intensity of this response is pretty much the issue of the dispute about the Arctic methane bomb (below).
What about the extremely high methane concentrations measured in Arctic airmasses?
Shakhova et al (2013) show shipboard measurements of methane concentrations in the air above the ESAS that are almost twice as high as the global average (which is already twice as high as preindustrial). Aircraft measurements published last year also showed plumes of high methane concentration over the Arctic ocean (Kort et al 2012), especially in the surface boundary layer. It’s not easy to interpret boundary-layer methane concentrations quantitatively, however, because the concentration in that layer depends on the thickness of the boundary layer and how isolated it is from the air above it. Certainly high methane concentrations indicate emission fluxes, but it’s not straightforward to know how significant that flux is in the global budget.
The more easily interpretable measurement is the time-averaged difference between Northern and Southern hemisphere methane concentrations. If Arctic methane were driving a substantial increase in the global atmospheric methane concentration, it would be detectable in this time-mean interhemispheric gradient. Northern hemisphere concentrations are a bit higher than they are in the Southern hemisphere (here), but the magnitude of the difference is small enough to support the conclusion from the methane budget that tropical wetlands, which don’t generate much interhemispheric gradient, are a dominant natural source (Kirschke et al 2013).
What about methane hydrates?
There are three possible sources of the methane in the bubbles rising out of the Siberian margin continental shelf:
- Decomposition (fermentation) of thawing organic carbon deposited with loess (windblown glacial flour) when the sediment was exposed to the atmosphere by low sea level during the last glacial time. Organic carbon deposits (called Yedoma) are the best-documented carbon reservoir in play in the Arctic.
- Methane gas that has been trapped by ice, now escaping. Shakhova et al (2013) figure that flaws in the permafrost called taliks, resulting from geologic faults or long-running rivers, might allow gas to escape through what would otherwise be impermeable ice. If there were a gas pocket of 50 Gt, it could conceivably escape quickly as a seal breached, but given that global gas reserves come to ~250 Gt, a 50 Gt gas bubble near the surface would be very large and obvious. There could be 50 Gt of small, disseminated bubbles distributed throughout the sediment column of the ESAS, but in that case I’m not sure where the short time scale for getting the gas to move comes from. I would think the gas would dribble out over the millennia as the permafrost melts.
- Decomposition (melting) of methane hydrates, a peculiar form of water ice cages that form in the presence of, and trap, methane.
Methane hydrate seems menacing as a source of gas that can spring aggressively from the solid phase like pop rocks (carbonated candies). But hydrate doesn’t just explode as soon as it crosses a temperature boundary. It takes heat to convert hydrate into fluid + gas, what is called latent heat, just like regular water ice. There could be a lot of hydrate in Arctic sediments (it’s not real well known how much there is), but there is also lot of carbon as organic matter frozen in the permafrost. Their time scales for mobilization are not really all that different, so I personally don’t see hydrates as scarier than frozen organic matter. I think it just seems scarier.
The other thing about hydrate is that at any given temperature, a minimum pressure is required for hydrate to be stable. If there is pure gas phase present, the dissolved methane concentration in the pore water, from Henry’s law, scales with pressure. At 0 degrees C, you need a pressure equivalent to ~250 meters of water depth to get enough dissolved methane for hydrate to form.
The scariest parts of the Siberian margin are the shallow parts, because this is where methane bubbles from the sea floor might reach the surface, and this is where the warming trend is observed most strongly. But methane hydrate can only form hundreds of meters below the sea floor in that setting, so thermodynamically, hydrate is not expected to be found at or near the sea floor. (Methane hydrate can be found close to the sediment surface in deeper water depth settings, as for example in the Gulf of Mexico or the Nankai trough). The implication is that it will take centuries or longer before heat diffusion through that sediment column can reach and destabilize methane hydrates.
Is there any way nature might evade this thermodynamic imperative?
If hydrate exists in near-surface sediments of the Siberian margin, it would be called “metastable”. Metastability in nature is common when forming a new phase for which a “seed” or starting crystal is needed, like cloud droplets freezing in the upper atmosphere. But for decomposition to form water and gas one would not generally expect a barrier to just melting when energy is available. Chuvilin et al (2011) monitored melting hydrate in the laboratory and observed some quirkiness.
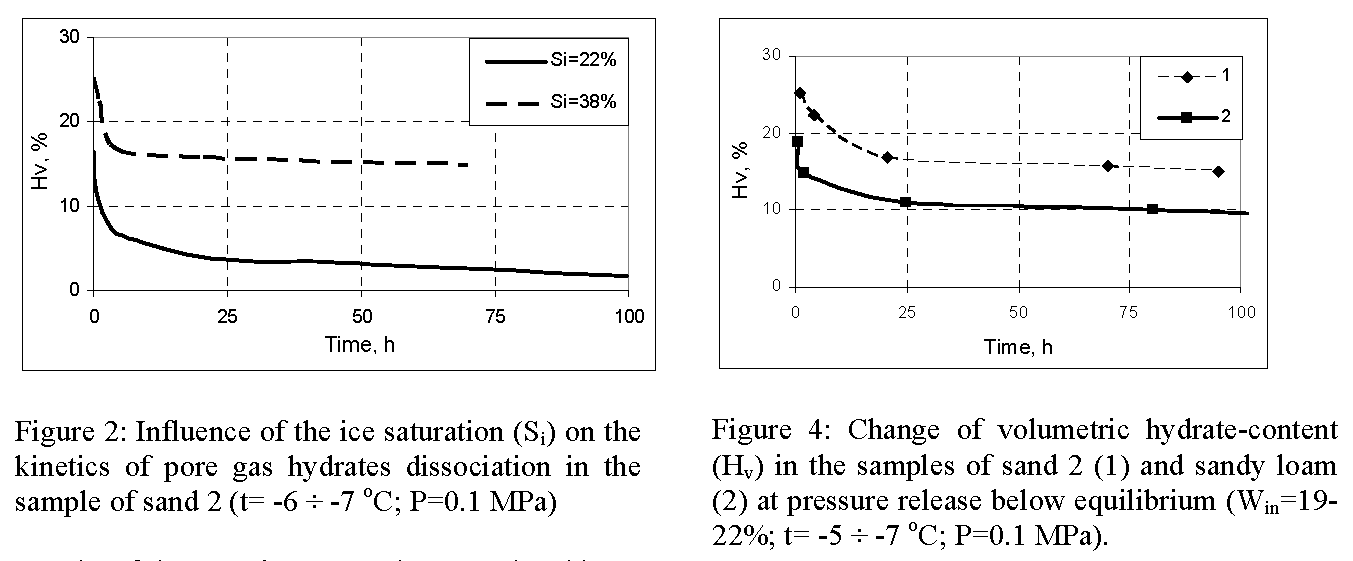
But these experiments spanned 100 hours, while the sediment column has been warming for thousands of years, so the experiments do not really address the question. I have to think that if there were some impervious-to-melting hydrate, why then would it suddenly melt, all at once, in a few years? Actual samples of hydrate collected from shallow sediments on the Siberian shelf would be much more convincing.
What about that Arctic methane bomb?
Shakhova et al (2013) did not find or claim to have found a 50 Gt C reservoir of methane ready to erupt in a few years. That claim, which is the basis of the Whiteman et al (2013) $60 trillion Arctic methane bomb paper, remains as unsubstantiated as ever. The Siberian Arctic, and the Americans, each emit a few percent of global emissions. Significant, but not bombs, more like large firecrackers.
References
- N. Shakhova, I. Semiletov, I. Leifer, V. Sergienko, A. Salyuk, D. Kosmach, D. Chernykh, C. Stubbs, D. Nicolsky, V. Tumskoy, and �. Gustafsson, "Ebullition and storm-induced methane release from the East Siberian Arctic Shelf", Nature Geoscience, vol. 7, pp. 64-70, 2013. http://dx.doi.org/10.1038/NGEO2007
- G. Whiteman, C. Hope, and P. Wadhams, "Vast costs of Arctic change", Nature, vol. 499, pp. 401-403, 2013. http://dx.doi.org/10.1038/499401a
- N.E. Shakhova, V.A. Alekseev, and I.P. Semiletov, "Predicted methane emission on the East Siberian shelf", Doklady Earth Sciences, vol. 430, pp. 190-193, 2010. http://dx.doi.org/10.1134/S1028334X10020091
- S.M. Miller, S.C. Wofsy, A.M. Michalak, E.A. Kort, A.E. Andrews, S.C. Biraud, E.J. Dlugokencky, J. Eluszkiewicz, M.L. Fischer, G. Janssens-Maenhout, B.R. Miller, J.B. Miller, S.A. Montzka, T. Nehrkorn, and C. Sweeney, "Anthropogenic emissions of methane in the United States", Proceedings of the National Academy of Sciences, vol. 110, pp. 20018-20022, 2013. http://dx.doi.org/10.1073/pnas.1314392110
- E.A. Kort, S.C. Wofsy, B.C. Daube, M. Diao, J.W. Elkins, R.S. Gao, E.J. Hintsa, D.F. Hurst, R. Jimenez, F.L. Moore, J.R. Spackman, and M.A. Zondlo, "Atmospheric observations of Arctic Ocean methane emissions up to 82° north", Nature Geoscience, vol. 5, pp. 318-321, 2012. http://dx.doi.org/10.1038/NGEO1452
- S. Kirschke, P. Bousquet, P. Ciais, M. Saunois, J.G. Canadell, E.J. Dlugokencky, P. Bergamaschi, D. Bergmann, D.R. Blake, L. Bruhwiler, P. Cameron-Smith, S. Castaldi, F. Chevallier, L. Feng, A. Fraser, M. Heimann, E.L. Hodson, S. Houweling, B. Josse, P.J. Fraser, P.B. Krummel, J. Lamarque, R.L. Langenfelds, C. Le Quéré, V. Naik, S. O'Doherty, P.I. Palmer, I. Pison, D. Plummer, B. Poulter, R.G. Prinn, M. Rigby, B. Ringeval, M. Santini, M. Schmidt, D.T. Shindell, I.J. Simpson, R. Spahni, L.P. Steele, S.A. Strode, K. Sudo, S. Szopa, G.R. van der Werf, A. Voulgarakis, M. van Weele, R.F. Weiss, J.E. Williams, and G. Zeng, "Three decades of global methane sources and sinks", Nature Geoscience, vol. 6, pp. 813-823, 2013. http://dx.doi.org/10.1038/NGEO1955
Tony, here’s a search string. Use it and you’ll will find the earlier discussion of that paper in the October open thread at RC (or use the site search in the upper right corner of the page):
site:realclimate.org Wright AND Schaller AND PNAS
That search finds a link about it by prokaryotes to phys.org at New finding shows climate change can happen in a geological instant
Gavin added this inline comment there:
[Response: My sources tell me that the inference that the banding is annual (and hence the ‘instant’ conclusion) is quite controversial. More study is definitely needed on this. – gavin]
Followup posts in that thread by Doug Bostrom and me and Sidd added the authors’ named and links to the paper, so scroll down a bit from the first post or up a bit from the search result, which is
Search Results
RealClimate: Unforced Variations: Oct 2013
https://www.realclimate.org/index.php/archives/2013/10/…/comment-page-3/
Oct 1, 2013 – More better info on location and what’s in the bands > Wright and Schaller. doi: 10.1073/pnas.1309188110. PNAS October 1, 2013 vol. 110 no.
(that’s why Gavin asks us to always provide the DOI — it’s the only reference that’s always going to be reliable to find a science paper; bit rot and ambiguity breaks connections and searches otherwise)
We poked at a few questions given what we knew at the time of publication.
Has more been published (or talked about in the hallways at meetings) on this one yet? I’d imagine people at this week’s AGU annual meeting will have, as Peter Watts puts it, kicked the paper around to see how it holds up.
[note my attempt to post the link to the “Oct. 2013 … page-3 comment” failed; use the search string I posted to get a working link back to it]
David,
I recall some people on Gavin’s Twitter feed arguing against this notion of a hyper-rapid methane release.. problem with interpretation of annual layering in that study. Perhaps after AGU, there would be some friendly guest debate on this at RC?
Prof. Archer, thanks for the comment. I agree with you assessment of Wright (2013), that it is a paper that, if verified, is groundbreaking revision of the speed of PETM onset. I had previously commented:
“Fig. 4 shows the effect of ocean depth of sediment deposition upon the size of the delta-C13 excursion.
1)This is very nice becoz it shows a path to reconcile deep and shallow sediment records from PETM.
2)This is also nice becoz it uses the Archer model
3)Coupled with the time differentiated CaCO3 and delta-C13 response, it is a nice test of the Archer model.
4)Wouldn’t it be nice if Archer would comment ?”
Couped with your comment on the Zachos findings, would you care to add your thoughts on the time differentiated response of CaCO3 and delta-C13 response as a test of your model ?
sidd
[Response: I don’t have a model of the scenario they’re talking about. They want an instantaneous increase in atmospheric CO2 I suppose, which leads to an instantaneous decrease in pH and hence CaCO3 burial and a somewhat slower change in the carbon isotopes. New invading CO2 will carry the new atmospheric isotopic composition but the water still has more isotopes to exchange to reach equilibrium, and so it will take much longer before the isotopes respond fully. That sounds good to me. But I don’t think I’d bet the farm on the global reliability of that CaCO3 record. It wasn’t very much to start with (4%), and %CaCO3 measurements tend to wiggle. However, that leaves the decadal time scale of the 13C isotopic composition change, which seems consistent to an instantaneous spike of CO2. David]
Hank,
Thanks for the tips on searching. I couldn’t find that reference previously but I see it was there. I now recall seeing that but, not being able to understand the abstract, didn’t pick it up until I saw the ClimateProgress article. (BTW, I’ve never got the site search box to produce any results, so I don’t bother with it any more – probably just my setup)
I notice David didn’t comment on it earlier and I guess his long response suggests that he wasn’t aware of the paper prior to my link. It’s good that he’s now considering it as a game changer.
Just to comment on his response. I had noted from James Hansen’s writings talk of climate sensitivity depending on the current climate (I remember seeing a graph of this but can’t find it right now). Also, the current climate sensitivity estimate has error bars, so that the current climate sensitivity may be as high as 4.5 degrees C, so 5 degrees at the PETM may not seem so out of kilter. But what would 3000GtC release mean in our current climate? With the Arctic permafrost and clathrates now fully charged, is it hypothetically possible that such a rapid release could happen in our current situation?
#94 “Even if ESAS estimates doubled again, it is still a small number.” – gavin
The methane emissions for the entire world ocean were estimated at less than 4Tg/yr just 15 years ago. Then the arctic contribution alone was increased to 8 Tg/yr and then 17 Tg/yr. Now, I can easily understand that no one was systematically looking at methane in the arctic and the uncertainties were known to be large, so the fact these estimates have grown could easily be due to better estimates not increased emissions.
At some point though, if the estimates keep increasing there is a good chance it’s due to emissions actually increasing. It really doesn’t matter what the number is today, if it’s doubling every 4 or 5 years then it’s a looming disaster.
We agree that no one knows the rate of growth. I think we agree that global warming will increase that rate (whatever it is today). Your position seems to be: we don’t know the rate, we don’t know how much it is going to increase, there are large uncertainties in the current estimates – but don’t worry. I’m not comfortable until we know the rate and and verify that it is small. I don’t find a lack of knowledge and large uncertainties as a reason to be complacent. Especially in the arctic where everything that has transpired the past 20 years seems at a pace that far exceeds our expectations.
Re:” I think we agree that global warming will increase that rate (whatever it is today).”
Is incorrect, should have been: I think we agree that global warming will increase the emissions (whatever they are today)
David
Wow, that’s a great paper. A game-changer. They have evidence that the carbon was released as you say very quickly, essentially instantaneously
Live reports on Twitter from AGU mention a talk by Richard Zeebe that was sharply critical of this research (although also a presentation from Schaller continuing to promote the idea). For example see Jessica Tierney:
https://twitter.com/leafwax
All this is why everyone should be on Twitter :)
Love David’s inline @ #97 in response to Tony Weddle! It’s great when the conversation brings information to the moderators (who may be in a position to do something useful with it, scientifically speaking.) Kinda validates all the yakking, in a way.
Some thoughts, mostly in the form of questions:
>”…Seemed to me that was also evidence for an abrupt carbon release, but Jim pointed out that dissolution might have created the signal he saw.”
Because the planktonic transitional forms didn’t survive in the acidic waters? Also, “Jim” must be James Wright, senior author on the paper, but who is “Zachos?”
[Response: Jim Zachos, who put together global deep sea records of the PETM. Everyone tends to cite his figure in Science 292: 686-689, 2001. David]
>”The warming has to be due to CO2, as evidenced by its duration. The atmospheric fraction of that instantaneously released CO2 would drop quickly as it invaded the oceans, while the thermal response of the Earth will be slowed by the thermal inertial of the oceans. So on the time scale for temperature equilibration of the Earth, you’d probably have less than a doubling of atmospheric CO2, not enough to get 5 degrees C if the climate sensitivity is as today about 3 degrees C.”
I don’t get this. (Maybe if I’d actually done Dr. Archer’s online course!?…) But if the temperature transition took only 13 years, wouldn’t you expect a methane/CO2 mix? And a strong feedback due to massive dieback of terrestrial vegetation and marine plankton? If so, might not the CO2 levels fail to drop quite so quickly after all?
[Response: Could be… you’re asking for methane to boost the initial warming faster than the deep ocean would like, and then have more carbon come out later to account for the 5 degrees C temperatures a few thousand years out. But it’s the long-term temperature that provides this constraint, and if we’re both saying that it takes more carbon than you would get from methane to drive the long-term warming, than we agree. Remember that any biosphere carbon would bring its own isotopic signature. ]
Perhaps David considered all these (probably naive) points. But even so, I’m left wondering “What *would* be sufficient to spike temps 5 C in 13 years. Still more carbon, presumably?” Which leads onto:
[Response: I don’t know what it would take; this is way faster than climate models are usually pushed. ]
>”They also weigh in on the magnitude of the 13-C change and the amount of C released. They extrapolate the 13-C spike in the ocean against depth to estimate an atmospheric 13-C change, just after the carbon has been added to the atmosphere and before it invaded the ocean much at all, to get 20 o/oo.”
I think that defining terms here would help some of us–yes, that’s “me”–out. I initially thought “13-C” referred to temperature. Now I’m wondering if it’s the carbon isotope? And how about 0/00–“parts per thousand?” (As referenced here.)
[Response: Yes, so sorry for causing you work by being unclear. Yes, I meant delta-13 C, which is usually written with a genuine lowercase greek letter delta, and expressed as per-mille which is parts per thousand (analogous to percent is parts per hundred). ]
If those interpretations are correct, then I’m thinking the burden of this discussion is that the authors think that ‘thermogenic’ carbon is necessary to account for the PETM–in line with the somewhat well-known idea of volcanic combustion of coal beds, as mentioned a couple of times in Mark Lynas’s “Six Degrees.”
[Response: Yes, that is their conclusion. ]
(That last’s on my mind, since I’m in the process of updating my summary review of that book here. So far, I’ve done a couple of updates in the summary table articles on the 3- and 4-degree worlds, for anyone who may care.)
Any elaborations on any of this are welcome, but not necessarily expected–I, like most of us, am grateful for the effort that goes into the site as it is. Thanks, all…
Inline to my #109–Thanks so much!
Just one further (and playful) comment:
>”if we’re both saying that it takes more carbon than you would get…”
“We, Kimo Sabe?” I’m not daring to assert that; it’s above my pay grade! Just daring to ask (im?)pertinent questions… and appreciating the answers I do get regardless.
But I think the response does clarify one thing for me: the “The warming has to be due to CO2, as evidenced by its duration,” refers primarily not to the duration of the onset itself (which is what I was naively focussing on), but rather the fact that the warming lasted over millennial timescales.
I was taking seriously the description from Joe Romm’s site, which specifies 5 C in 13 years. (Head-spinningly fast, I think we’d all agree.) If warming was indeed that quick, then methane or other short-lived GHGs could have been involved, potentially invoking a spectrally broader and more intense radiative forcing. (The methane idea, I suppose, came also from the Lynas, as he mentioned that as one of the ‘usual suspect’ mechanisms proposed to account for PETM. I was actually surprised to note, upon rereading this sequence, to note that methane was not mentioned until I unwittingly smuggled the notion in myself. Though I note it’s been mentioned since.)
Re: Wright(2013)
I do not think they say the _temperature_ transition took 13 years. I think they say that the isotope excursions and pH drop occurred quickly. They do not claim much about the timescale of the temperature response.
Or do i misread them ?
sidd
[Response: The oxygen-18 is an indicator of temperature. David]
> https://twitter.com/leafwax
Thank you. Great pointer. Strong argument going on there.
#111–Dunno, Sidd. The PR says that it does:
That’s here:
http://news.rutgers.edu/research-news/new-finding-shows-climate-change-can-happen-geological-instant/20131003#.UqjiXRZD3tU
Romm, whom I cited above, quotes that verbatim.
But the PR doesn’t always get it right, does it?
Re: delta-018 in Wright(2013)
Thanx again Prof. Archer for your comment. I guess that while I accept the delta-018 is strong evidence for the annual nature of the clay couplets, but I question the absolute temperature scale, since, as they point out freshwater flux affects the isotope excursion.
“The variability in delta-O18 reflects changes in temperature, the delta-O18 of water … or a combination of both…We maintain that temperature must be a significant component of the intracouplet delta-18O variability, …”
So freshwater flux increased (or decreased) continually over the 13 year period, would result in drift of delta-O18 excursion. Now, they do point out that (in regard to the annual cycle)
“the required changes in salinity are far greater than are observed on the modern mid-Atlantic
shelf or even at sites at comparable water depths off the Amazon fan ”
But those were times of great turmoil indeed, so i still have a question mark in my mind on the absolute temperature scale. Especially in light of Prof. Zeebe comment that such a large temperature swing in such a short time would require decoupling ocean heat capacity from surface temperature, which would have required strong magic.
[Response: Strong indeed. But as Hank also notes, this isn’t a global average, maybe as you say changes in hydrology contributed. David]
sidd
Mr. Weddle writes:
“I had noted from James Hansen’s writings talk of climate sensitivity depending on the current climate (I remember seeing a graph of this but can’t find it right now) …”
Fig 7b in Phil. Trans. R. Soc. A 2013 371, 20120294, 16 September 2013
lookit
http://membrane.com/sidd/Hansen-2013-fig7b.png
i think PETM CO2 levels are around 4 on the x axis
That paper also talks about PETM a little.
sidd
Are they relying on only one site for the claim that “global” temperatures changed at this rate? How big a ‘catchment’ source for the sediment? Is the argument that ‘nothing but a global change could produce this result’?
[Response: What else would they be relying on? A site like this doesn’t come every day, there certainly aren’t a global array of them. This was just some coastal wash someplace, think Long Island Sound or some coastal setting where mud was accumulating relatively quickly. Assuming that the CaCO3 in it was produced in the water column, it’s pretty much local. I guess the argument is, nothing but local temperature change can explain the result. The leap to global has to appeal to an assumption about climate dynamics. David]
Thanks Kevin and inline comments as well. Do keep up with links like that for people like me. I will be looking at them and absorbing what my inadequate scientific background allows me to.
> What else
Gavin remarked here some years ago, after a China trip, that the meeting gave hope that sediment records would begin to be cross-correlated, rather than studied independently.
That’s the “what else” I was wondering about — what else besides this one site was (or could be) looked at to make the “global” statement, and whether there are any other imaginable explanations for the single site record besides a global atmospheric change.
And I was wondering where the source of the sediments was, if they know (is it for example a river outflow collecting sediment from a catchment? Or a deep ocean basin getting sediment from a vast area of ocean?)
Argh. The emergency geoengineering people are back:
http://www.examiner.com/article/agu-conference-2013-bye-bye-arctic-hello-extreme-climate-change
I’d guess there’s no chance of requiring the geoengineers’ CO2 to be pumped back down into the formation while they’re sucking out all the methane, since their argument for sucking out the methane is that It’s All Gonna’ Blow so why not drill wells, sell and burn it…..
Some good corrective commentary on the Guardian article I cited above at #95 (http://www.theguardian.com/environment/earth-insight/2013/dec/09/us-navy-arctic-sea-ice-2016-melt) just posted at the carbonbrief:
http://www.carbonbrief.org/blog/2013/12/could-arctic-summers-be-sea-ice-free-in-three-years%E2%80%99-time/
Dang, I tried to bracket “since their argument is ….” with snark on/snark off but it didn’t work.
To be clear, that last bit is my opinion of their plan.
Mr. Hank Roberts wonders:
“…whether there are any other imaginable explanations for the single site record besides a global atmospheric change.”
atmosphere is well mixed on 13 yr scale including delta-C13
“And I was wondering where the source of the sediments was, if they know (is it for example a river outflow collecting sediment from a catchment? Or a deep ocean basin getting sediment from a vast area of ocean?)”
shallow, like prof Archer sez, think long island sound
sidd
A seasonality trigger for carbon injectionat the Paleocene-Eocene thermalmaximum
Enhanced chemistry-climate feedbacks in past greenhouse worlds
The forgotten methane source
Biogeochemistry and Budgets of Methane (IPCC AR4)
Re Dinoflagellate cyst Apectodinium Augustum
Sidd, can you tell me more about the conditions at the time where that sediment was laid down, and whether for example it’d make any difference if the sediments were material brought in from the ocean during seasonal storms year after year, versus washed down the river from inland during the same annual storm cycle? Could there be something different about the local source material — ocean plankton producing one kind of sediment exposed to the atmosphere, versus say peat bogs or coal seams being washed out upstream and delivering locally derived material directly to the sediment beds? I’m seriously trying to get more of a picture than I have been able to come up with, wondering what possibilities can be imagined (and then how they can be eliminated).
Understood these kinds of sediments are very rare and finding more around the world hasn’t happened yet — and when it does, and the records get correlated, we’ll have a clear picture of a global change happening. Til we do — what else if anything -could- be imagined to produce such a local record.
The notions out there in the literature include for example a comet impact, or spontaneous combustion of coal beds, causing a carbon spike. Could anything local and small scale produce a local effect in the sediments, or does it have to be global “because …”.
er correction, spontaneous combustion of _peat_ beds.
One extensive recent popular summary of the time from National Geographic, October 2011: World Without Ice
http://ngm.nationalgeographic.com/print/2011/10/hothouse-earth/kunzig-text
So even before it began sea level was much higher, the icecaps had already melted — then something else happened ….
2013 Arctic Report Card press conference video is now out: http://www.youtube.com/watch?v=dZZsTgl-jHQ
At minute 14, it is pointed out that sea-bottom-dwelling creatures are moving further and further into the Arctic. Has anyone included the effect of these new creatures in projecting what the stability of seabed permafrost and hydrates may be going forward?
The positive biotic feedback mechanisms on land and in the Ocean, which lead to non-linear responses which changed ocean circulation to warm intermediate waters and thus could have created the conditions for large spikes of carbon isotope excursions.
Gavin, they’ve quit mentioning “metastable hydrate” in the public releases.
Seems the worry is a blowout of gas due to holes and cracks in the permafrost — but would they ask the petroleum folks to do anything different than they’re already doing? Drill more and faster for gas?
What about just encouraging some of the beasties that already thrive in high methane and low oxygen to propagate on the seabed? There’s stuff that could thrive in those conditions if the temperature’s close enough:
Azumi Kuroyanagi, Régine E. da Rocha, Jelle Bijma, Howard J. Spero, Ann D. Russell, Stephen M. Eggins, Hodaka Kawahata, Effect of dissolved oxygen concentration on planktonic foraminifera through laboratory culture experiments and implications for oceanic anoxic events, Marine Micropaleontology, Volume 101, May 2013, Pages 28-32, ISSN 0377-8398, http://dx.doi.org/10.1016/j.marmicro.2013.04.005.
(http://www.sciencedirect.com/science/article/pii/S0377839813000352)