Since we have been periodically posting updates since 2009 of climate model output comparisons to observations across a range of variables, we have now set up this page as a permanent placeholder for the most up-to-date comparisons. We include surface temperature projections from 1981, 1988, CMIP3, CMIP5, and CMIP6*, and MSU/AMSU satellite products from CMIP5 and CMIP6, SST and SSU from CMIP6, and we will update this on an annual basis, or as new observational products become available. For each comparison, we note the last update date, and where the comparison was first discussed.
This is a collation of opportunity. To be included, there needs to be a pre-existing public archive of the processed model output for the historical period and projections, and at least one regularly-updated observational data source. Lots of these archives have been produced, but they are not easily discoverable, if available publically at all. Please let us know of others that could be included as well by leaving a comment on the latest open thread. You can use these figures anywhere (with a citation and link back to RealClimate).
- Global mean surface air temperature
- Satellite estimates of tropospheric temperature
- Sea Surface temperatures
- Stratospheric temperatures
- Arctic Sea Ice Extent/Area
*Note that Hausfather et al. (2020) made a more complete assessment of surface temperature projections from models from 1970 through to CMIP3 (discussed here).
Global mean surface temperature anomalies
Hansen et al (1981)
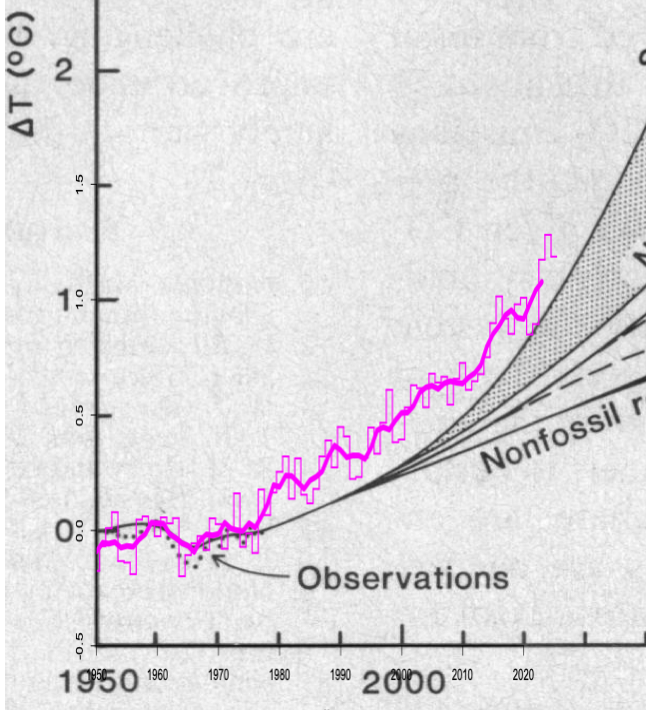
Original discussion (figure originally courtesy of Geert Jan van Oldenborgh, Hansen et al. (1981)). Observations are the GISTEMP LOTI annual figures and 5 year mean. Last updated: 27 Jan 2026.
Hansen et al (1988)
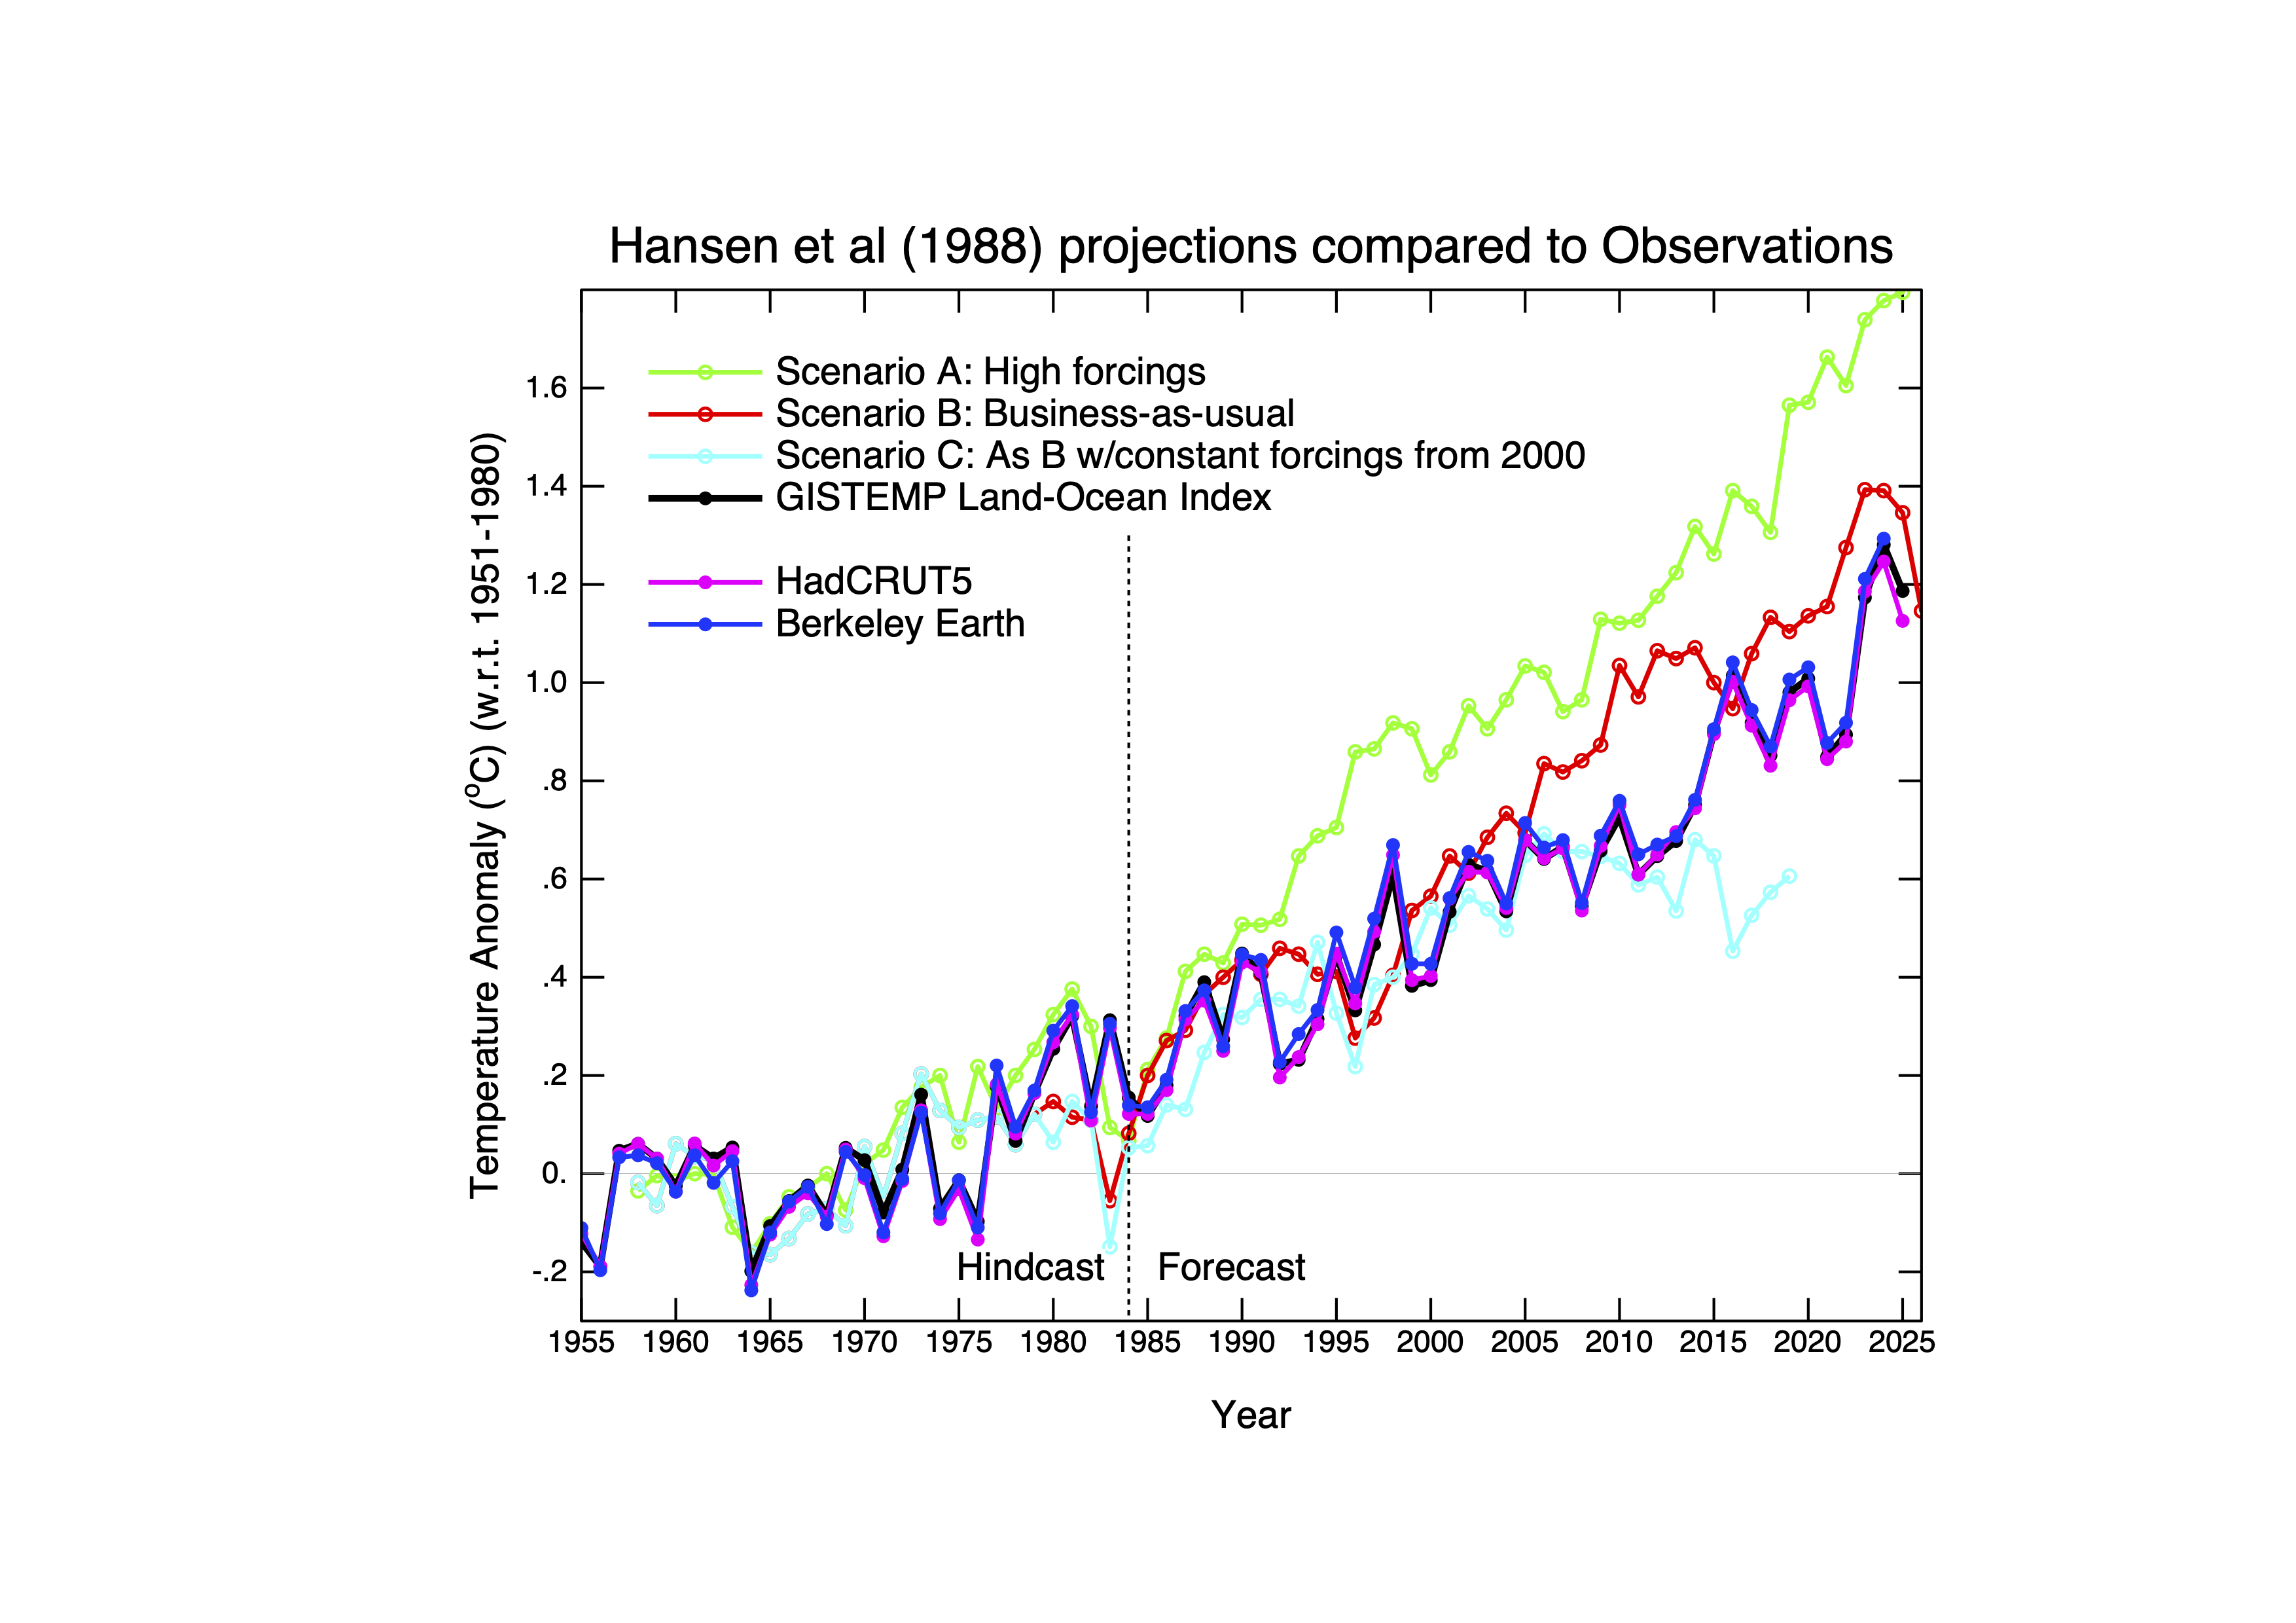
Original discussion (2007), Last discussion (2018). Scenarios from Hansen et al. (1988). Observations are the GISTEMP LOTI annual figures. Trends from 1984: GISTEMP: 0.23ºC/dec, Scenarios A, B, C: 0.35, 0.29, 0.15ºC/dec respectively (all 95% CI ~±0.02 or 0.03). Last updated: 24 Jan 2026.
CMIP3 (circa 2004)
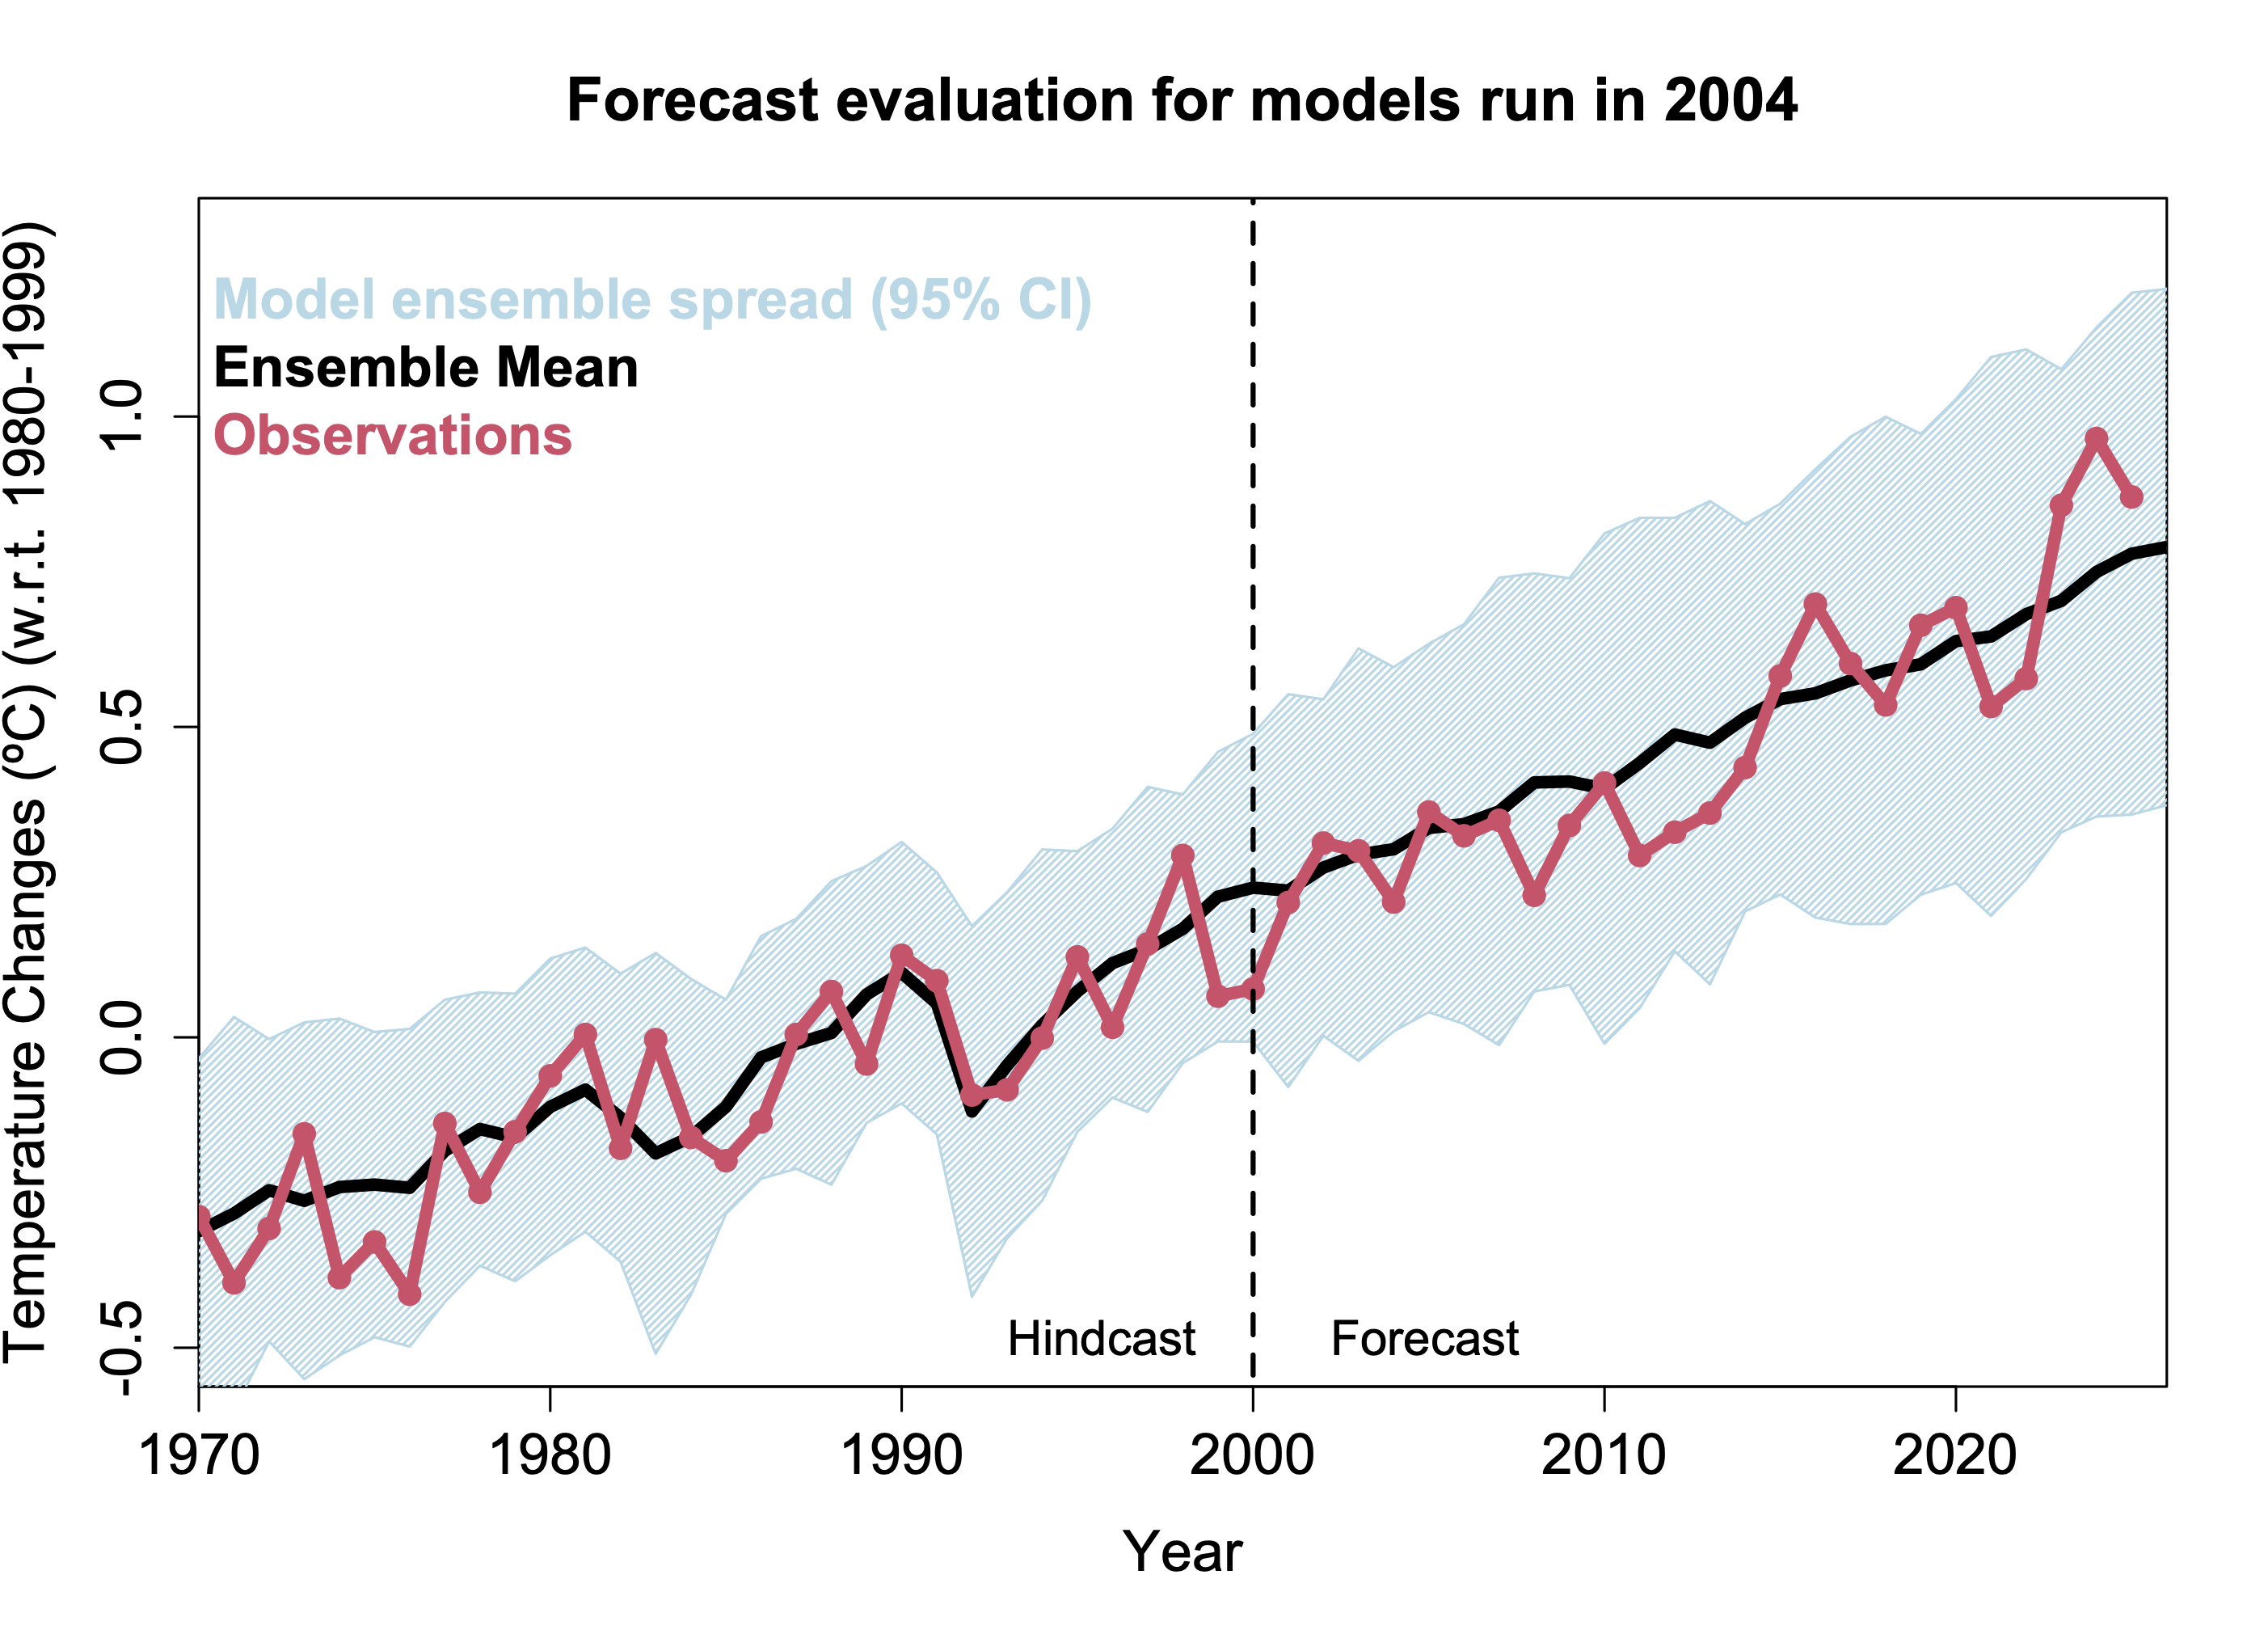
Last discussion (2015). Model spread is the 95% envelope of global mean surface temperature anomalies from all individual CMIP3 simulations (using the SRES A1B projection post-2000). Observations (GISTEMP) are the standard quasi-global estimates of anomalies with no adjustment for spatial coverage or the use of SST instead of SAT over the open ocean. Last updated: 22 Jan 2026.
CMIP5 (circa 2011)
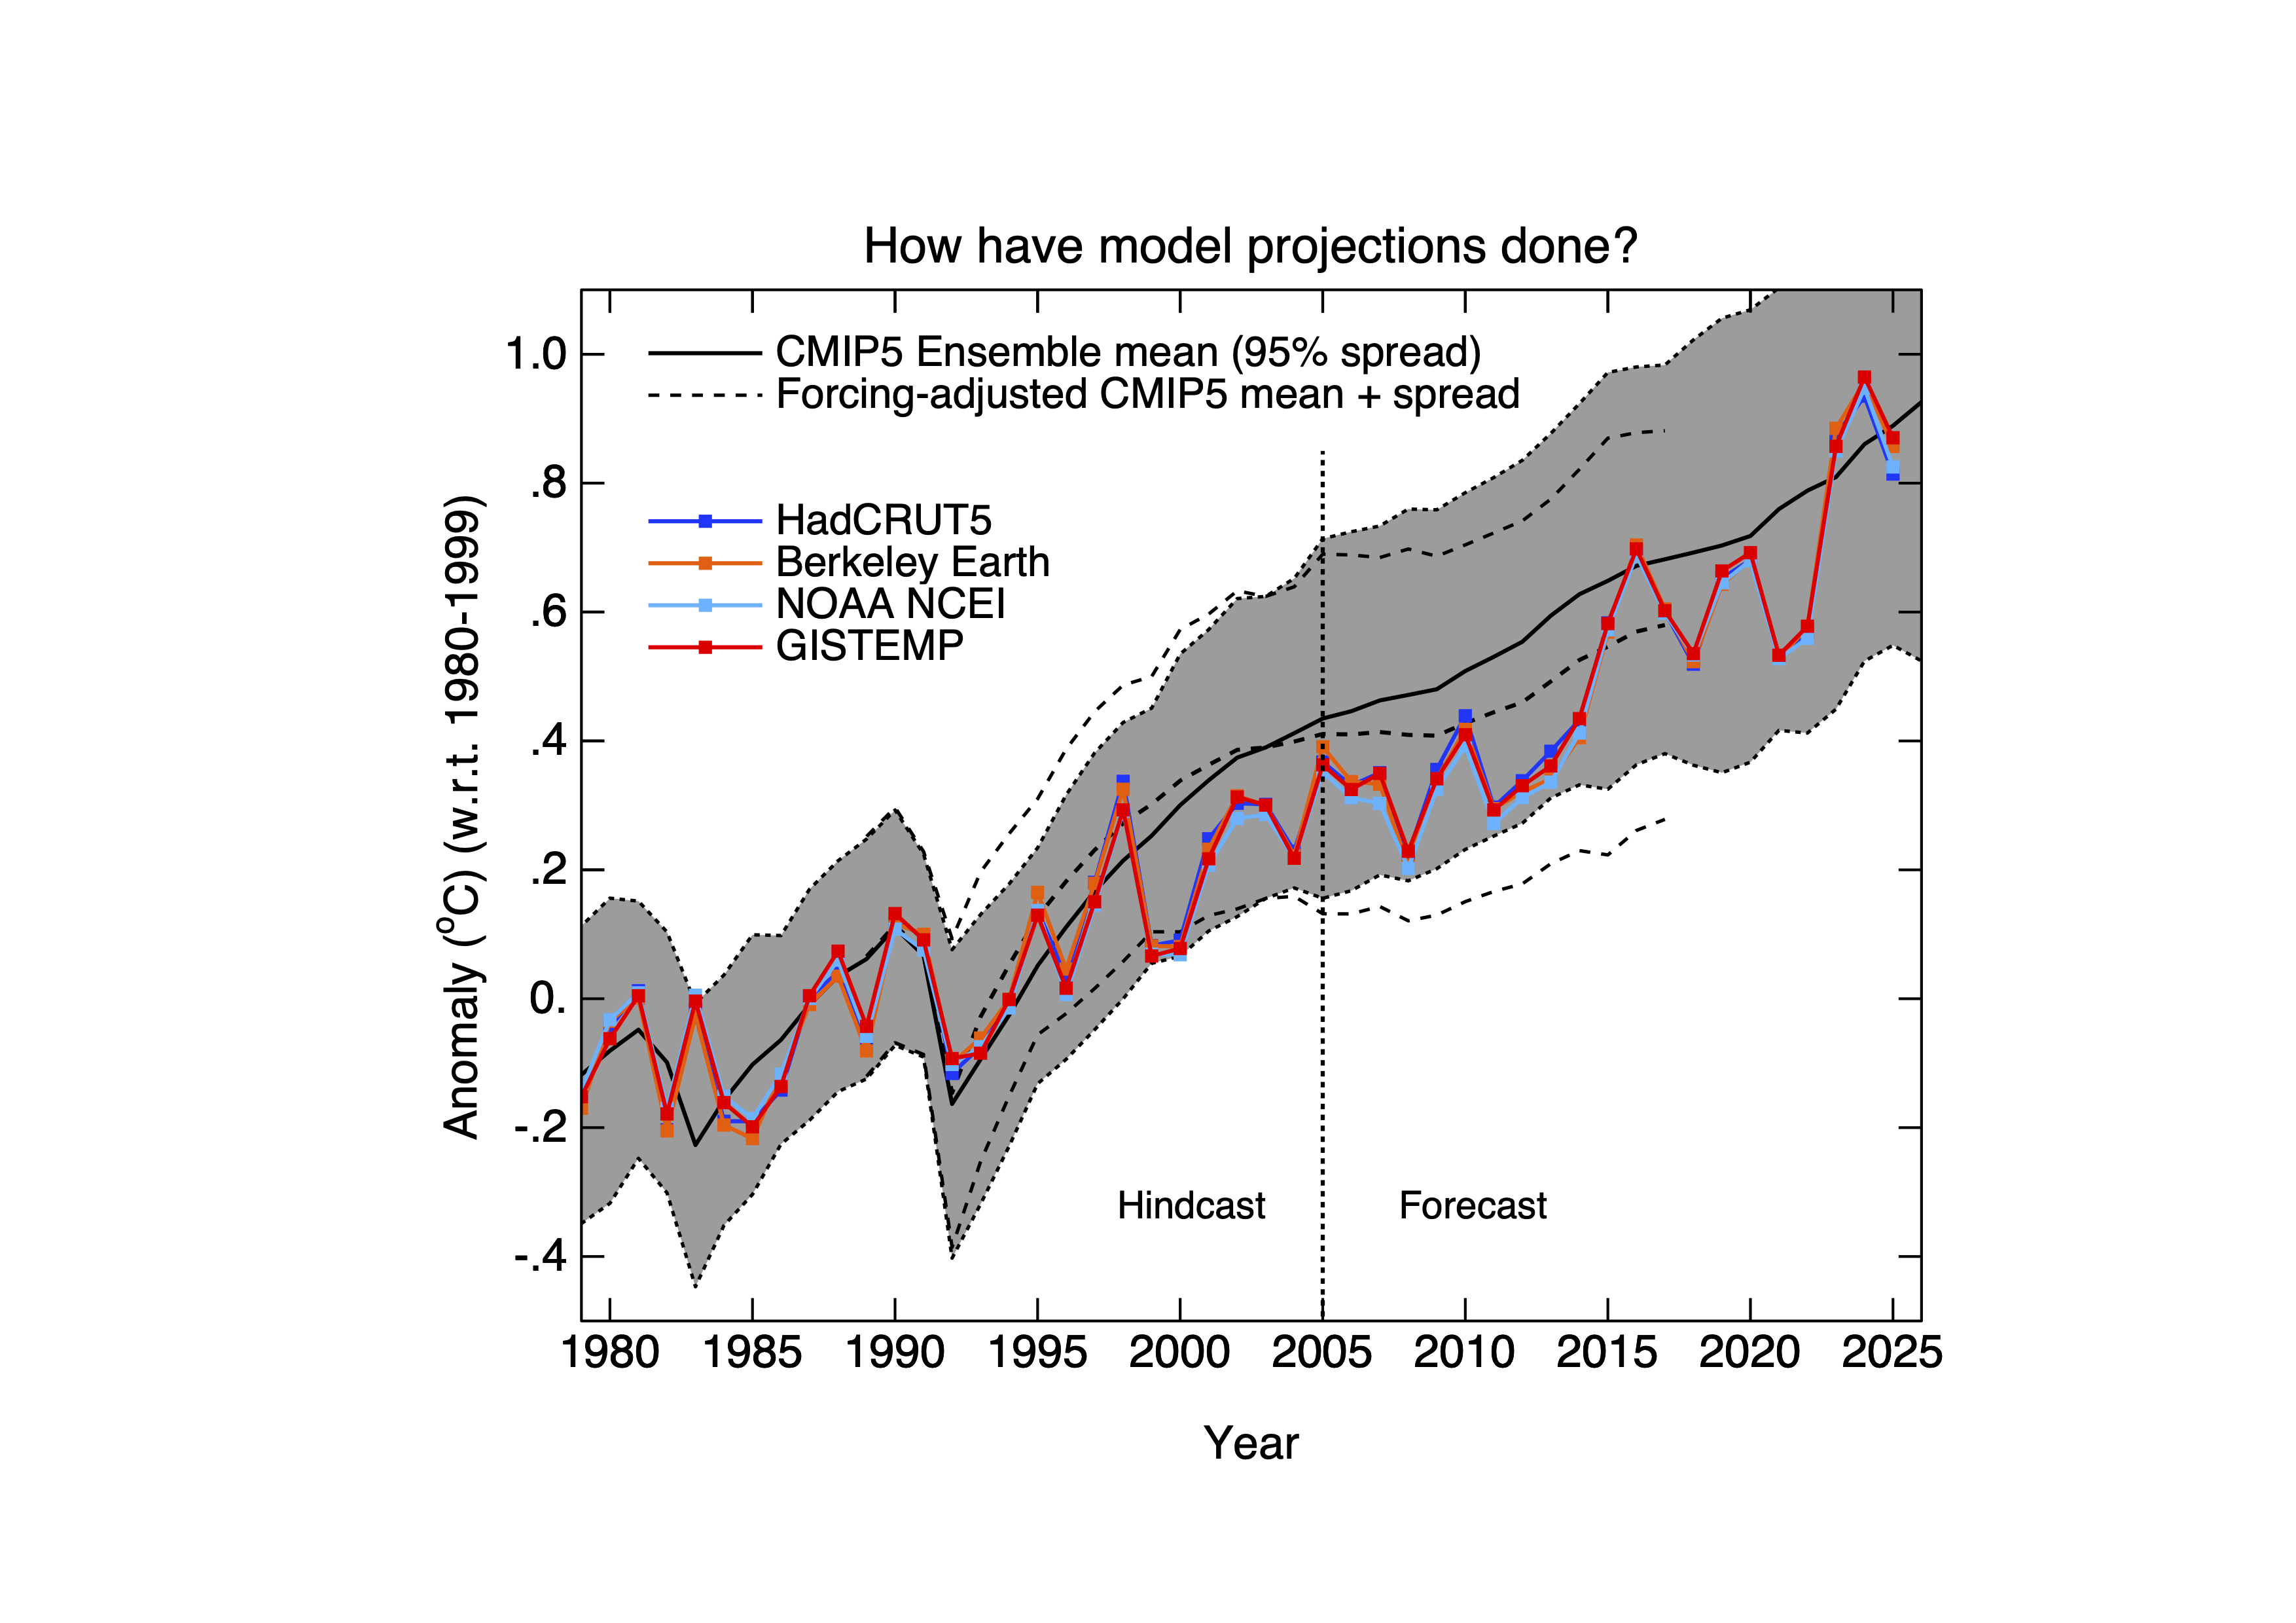
Last discussion (2015). Model spread is the 95% envelope of true global mean surface temperature anomalies from all CMIP5 historical simulations (using the RCP4.5 projection post-2005). Forcing adjustment is updated from Schmidt et al. (2014). Observations are the standard quasi-global estimates of anomalies with no adjustment for spatial coverage or the use of SST instead of SAT over the open ocean. Last updated: 24 Jan 2026.
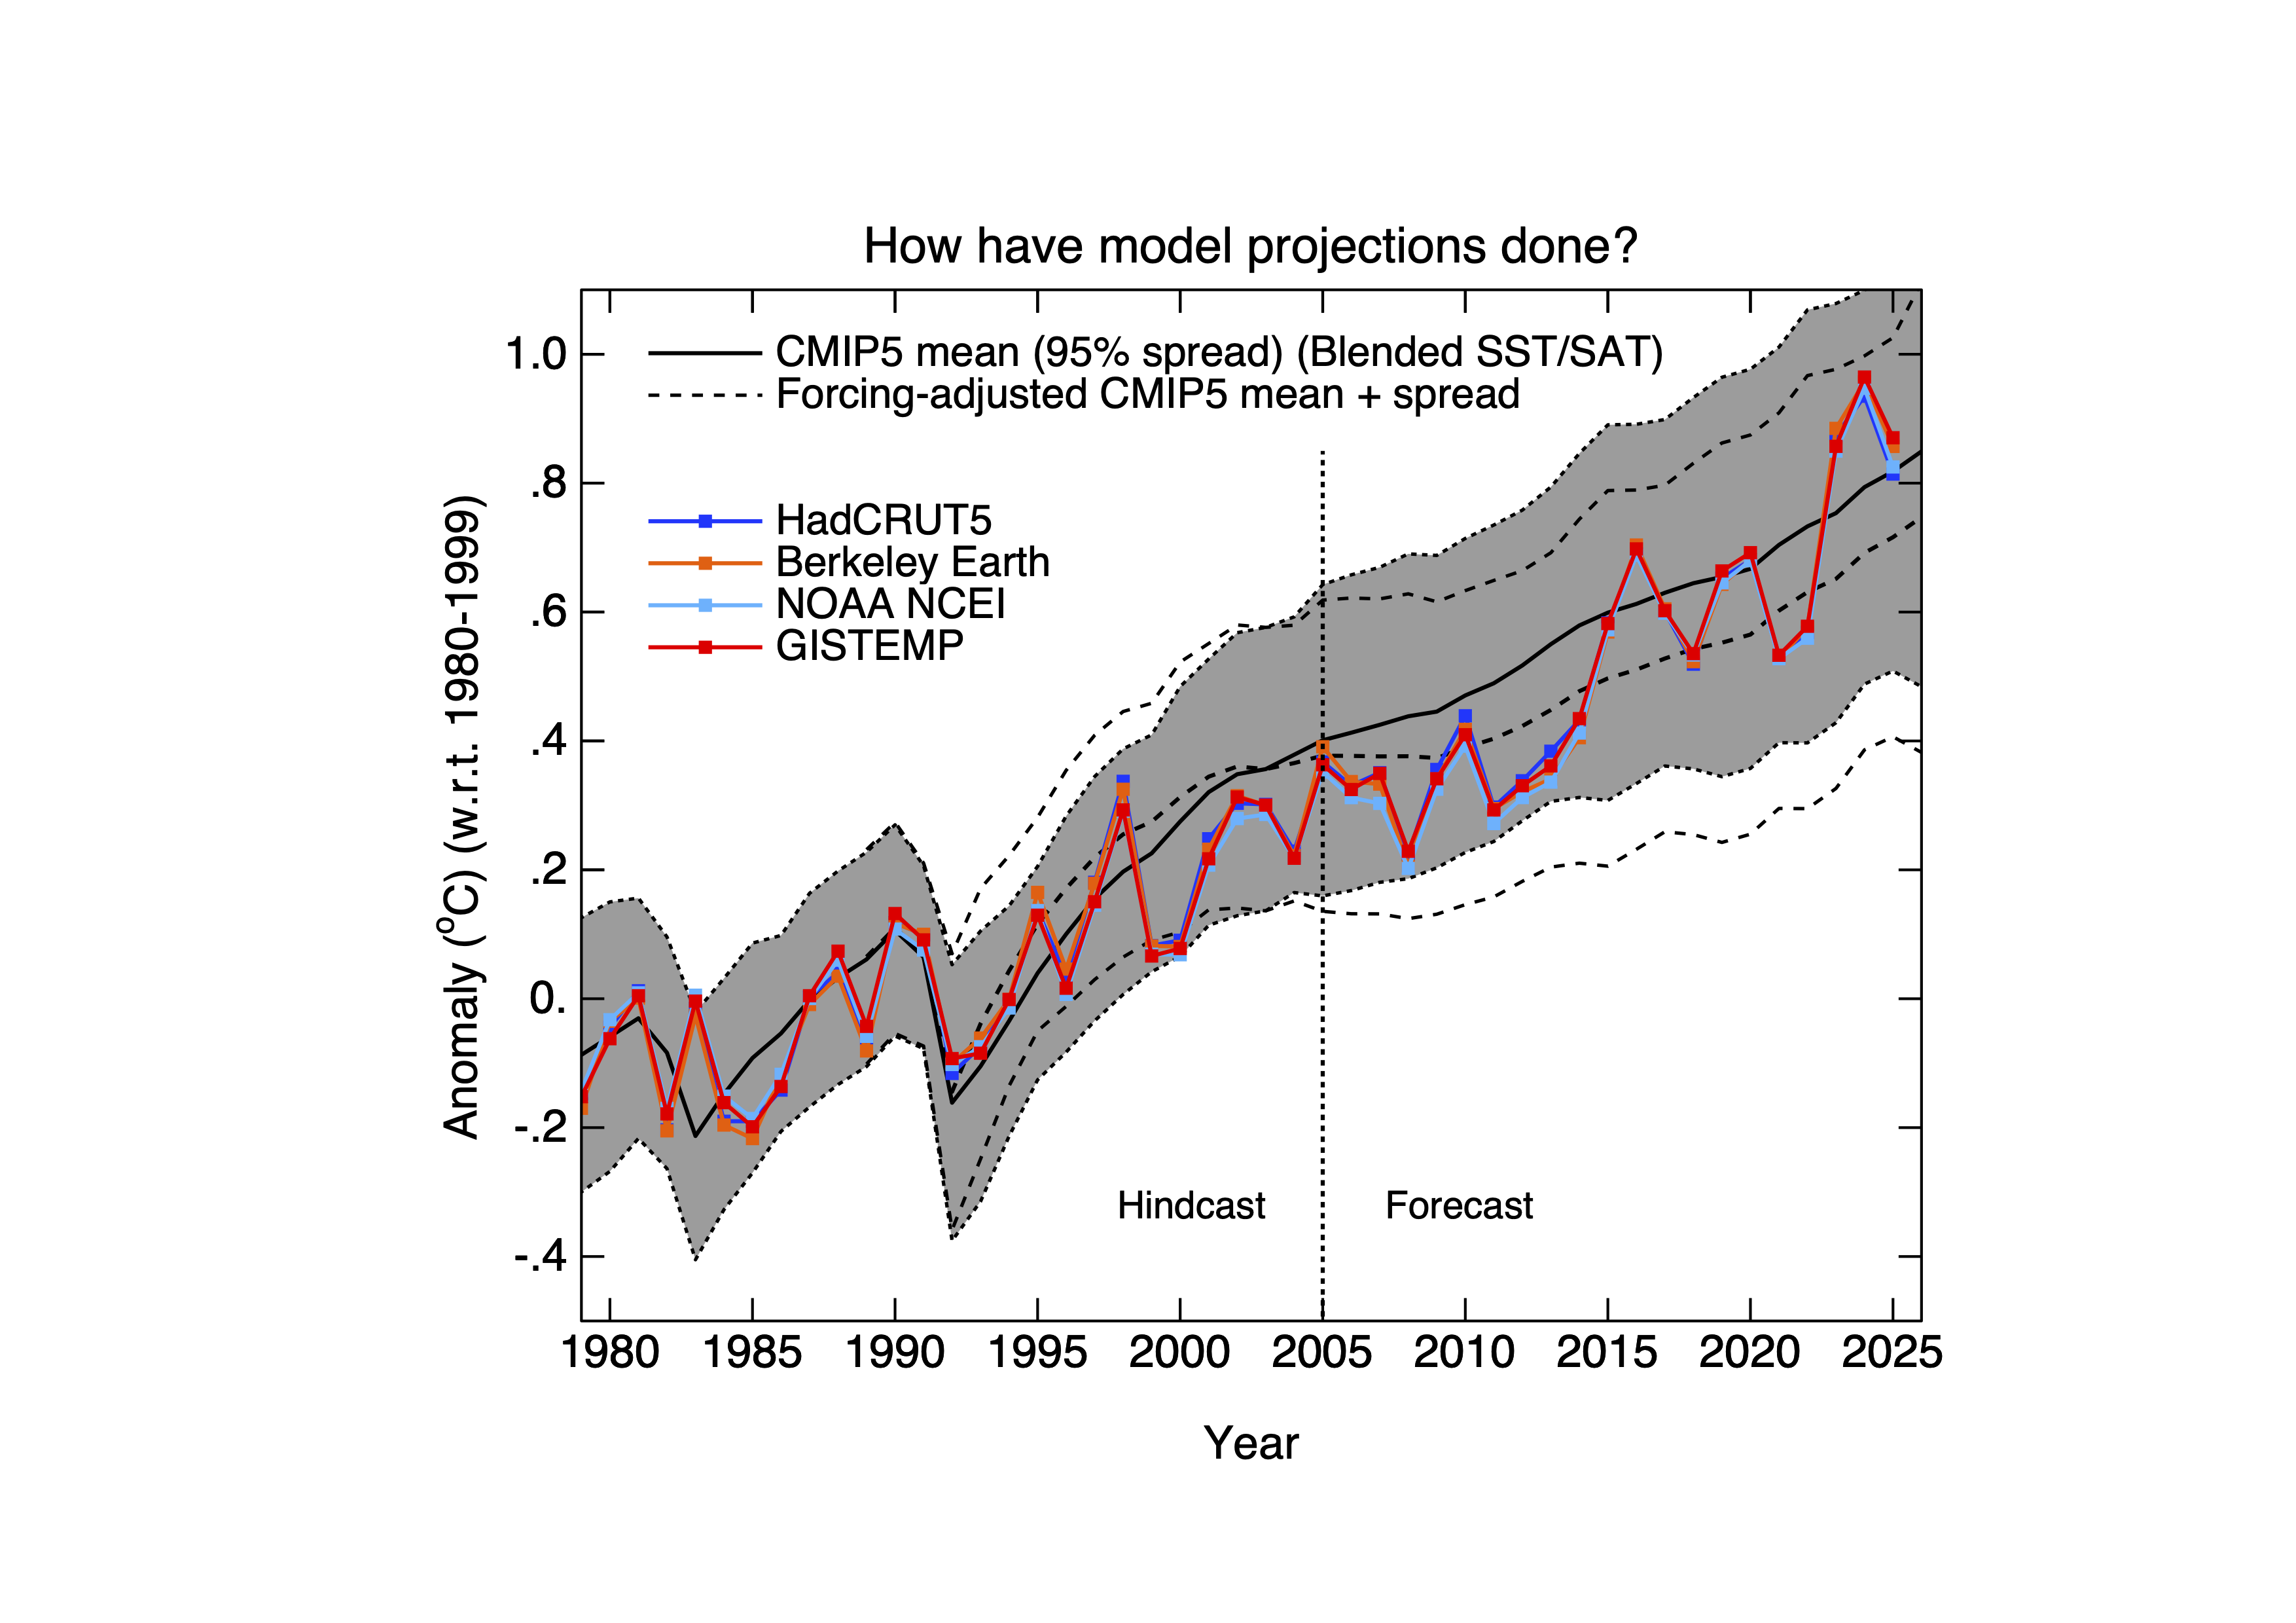
As above, but using the blended SST/SAT product from the CMIP5 models produced by Cowtan et al (2015) instead of the pure SAT field. Note that this makes about a 0.05ºC difference in 2022 (compared to a 0.1ºC difference estimated from the forcings adjustment above). Last updated: 24 Jan 2026.
CMIP6 (circa 2021)
The last phase of CMIP went from ~2019 to 2025. These models used observed boundary conditions (GHG levels, deforestation, solar, volcanoes etc.) up to 2014, and projections based on the Shared Socioeconomic Pathways (SSPs) from 2015 onward. The same caveat with respect to the comparison to the blended SAT/SST observations stands as with CMIP5, but this is a relatively small effect (i.e. it’s expected to be around 0.05ºC in 2022). Note however, that some CMIP6 models have climate sensitivities outside both the CMIP5 range and the range constrained by observations. Thus in these figures, we plot the full mean (1 ensemble member per model) and the mean of a subset of the models that have a transient climate response (TCR) within the likely constrained range [1.4,2.2]ºC as assessed by IPCC AR6 (Hausfather et al., 2022).
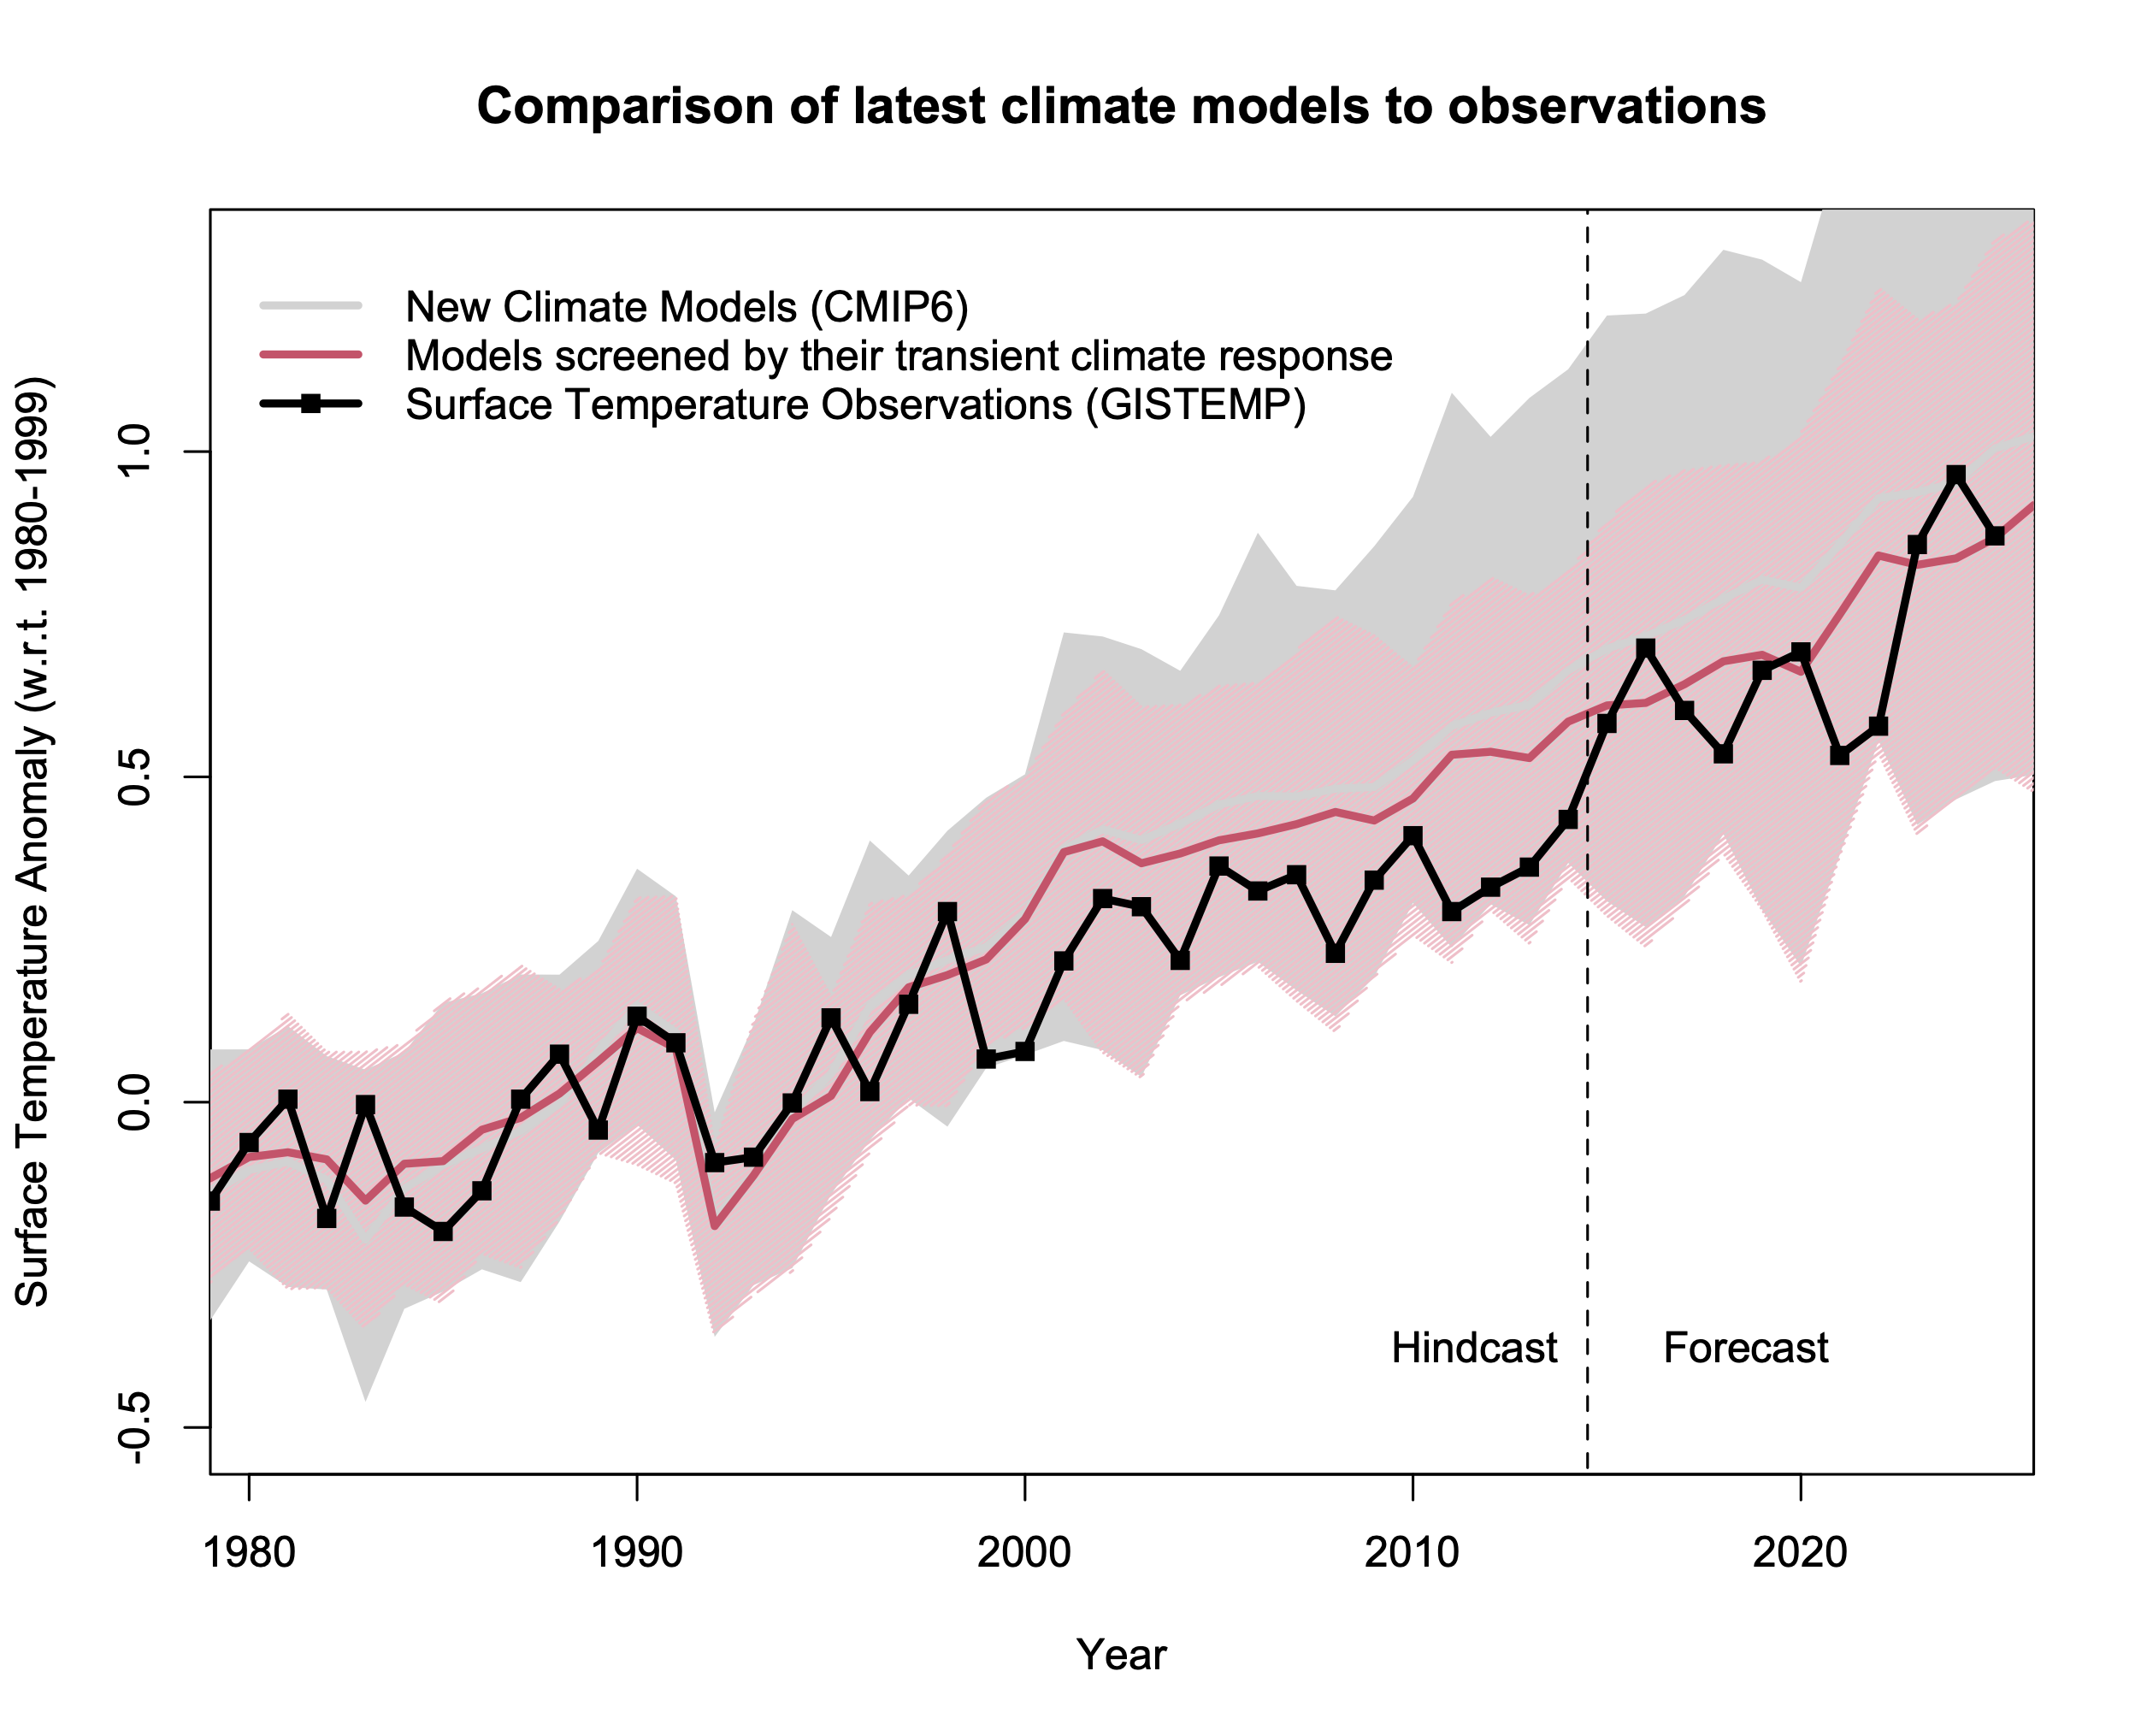
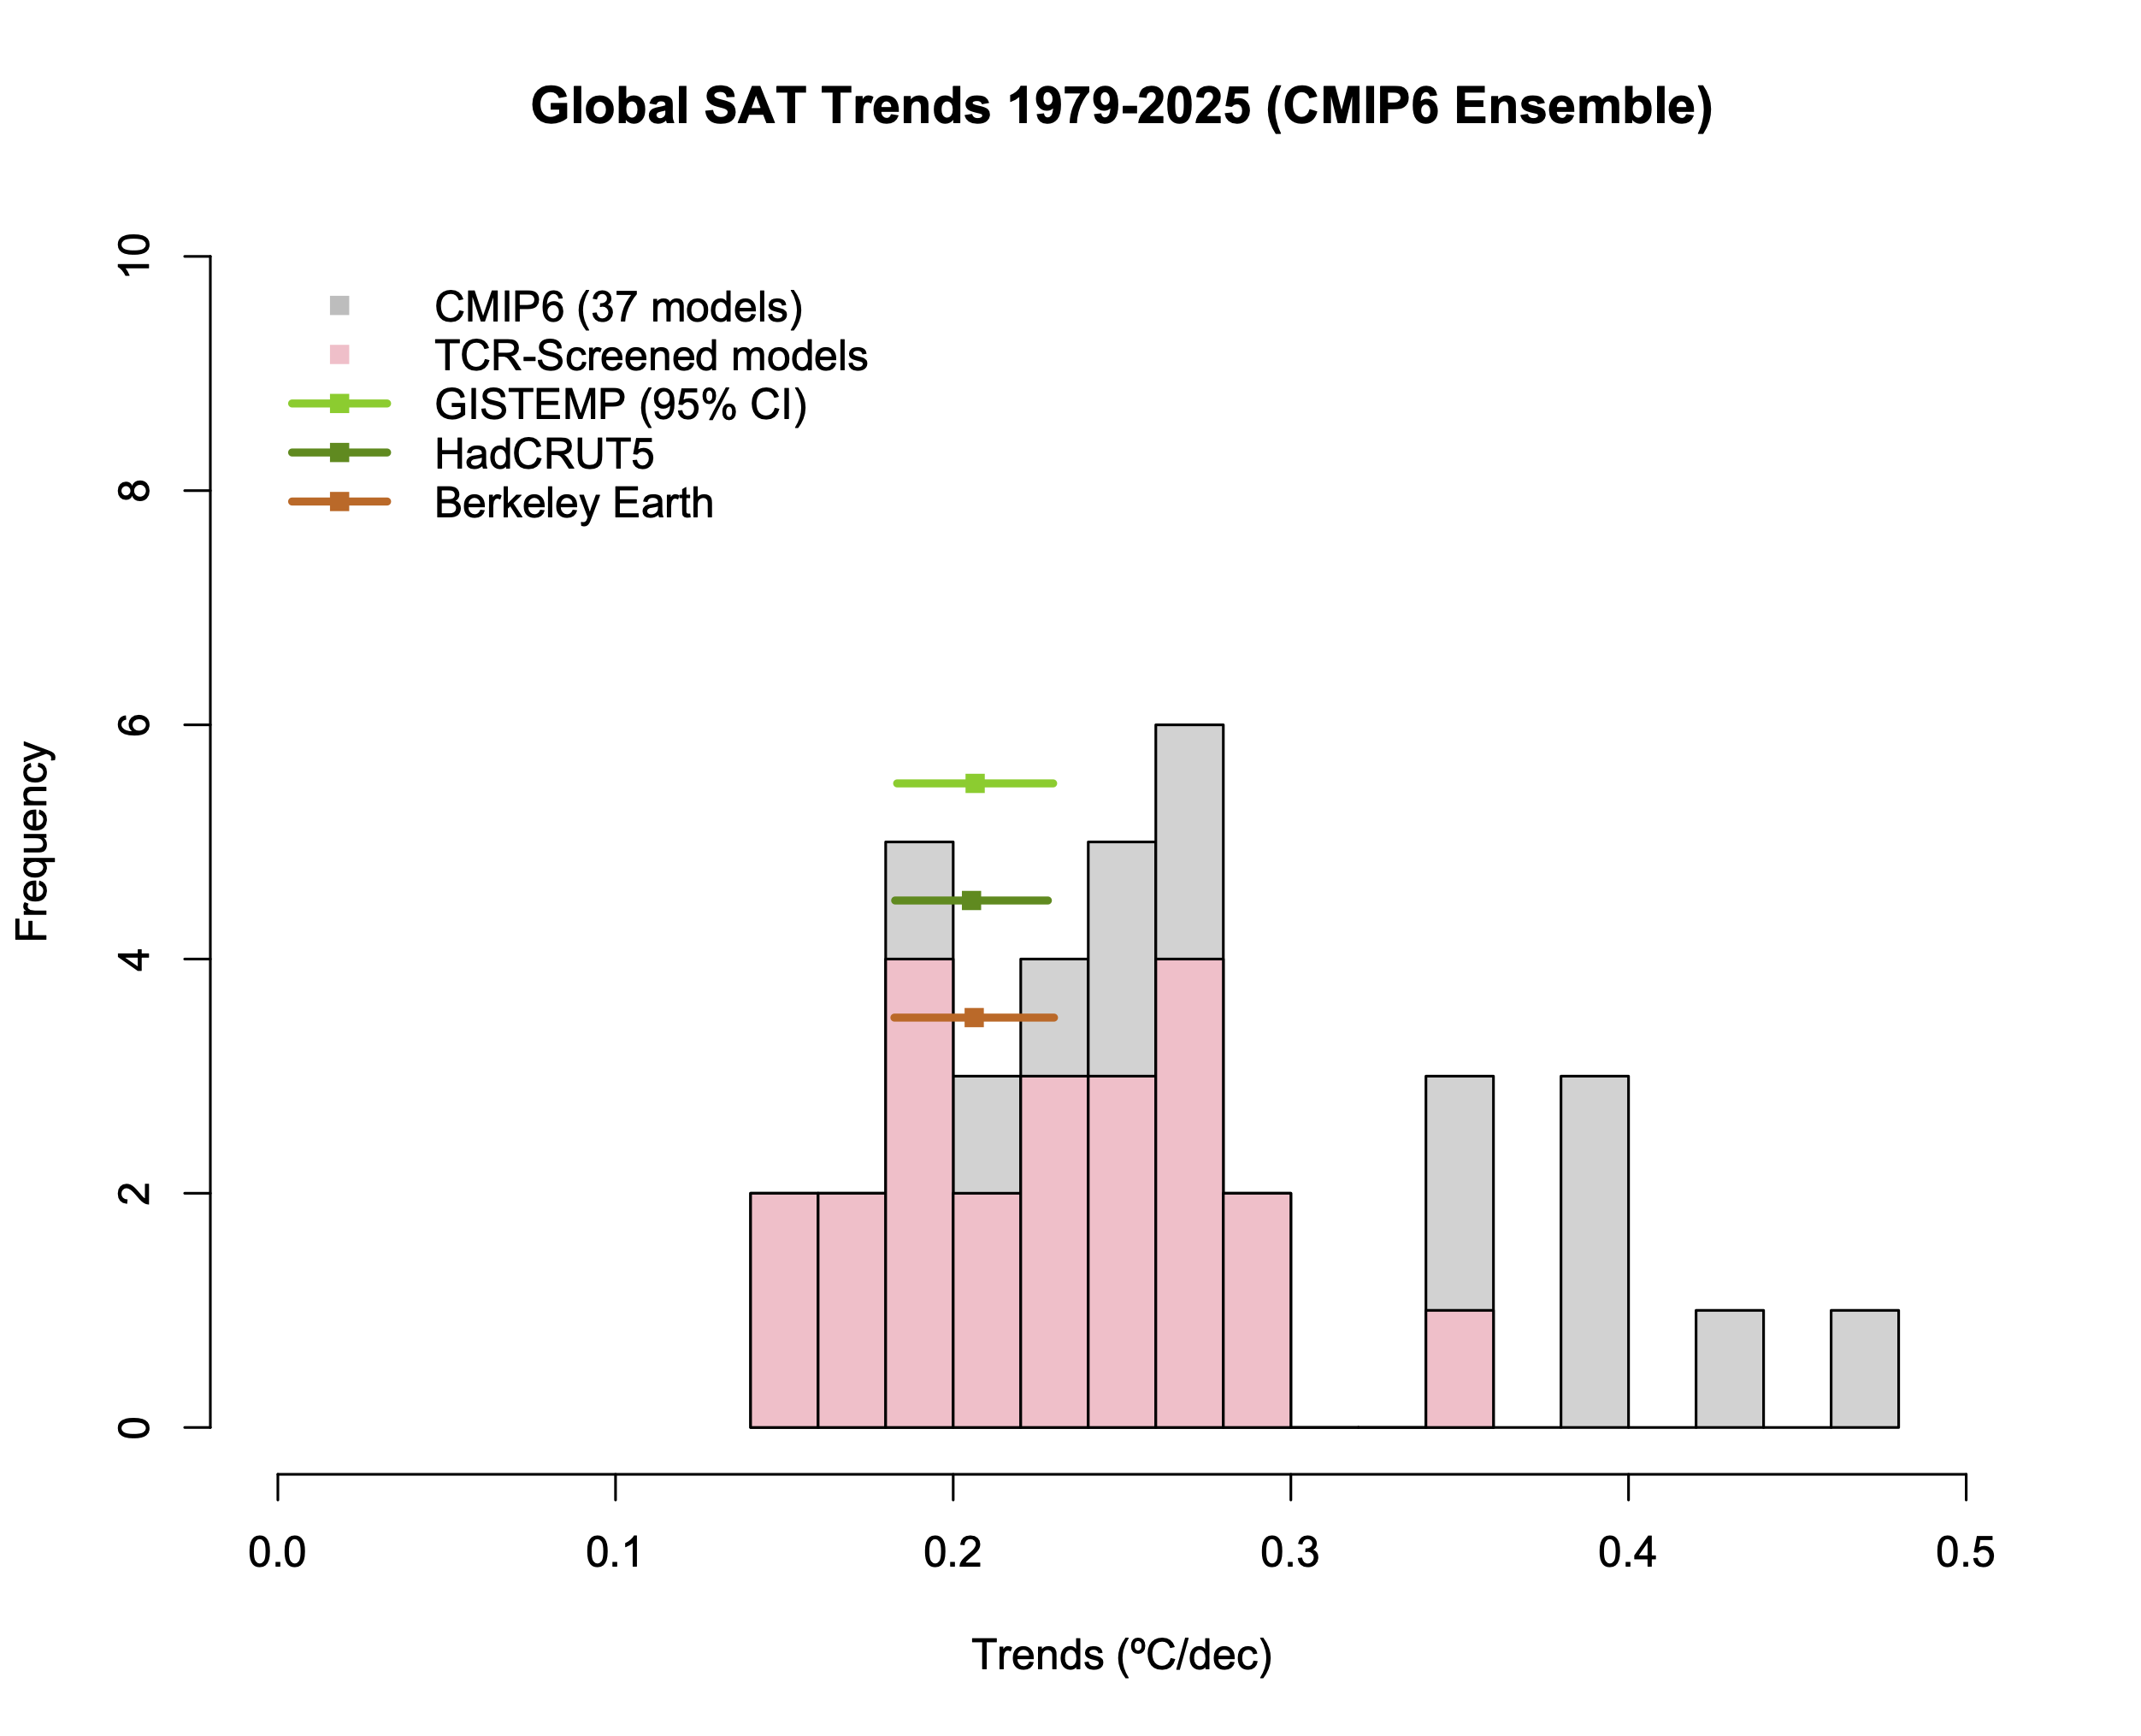
Model spread is the 95% envelope of surface air temperature anomalies using 37 model simulations from the historical runs and SSP2-4.5. TCR values used in the screen are Hausfather et al. (2022). Last updated: 22 Jan 2026.
Satellite-derived atmospheric temperatures
Where available, we compare models to TMT, TLT, Corrected-TMT and SSU levels, using the same screening for CMIP6 as described above.
TMT (global and tropical means) (timeseries and trends)
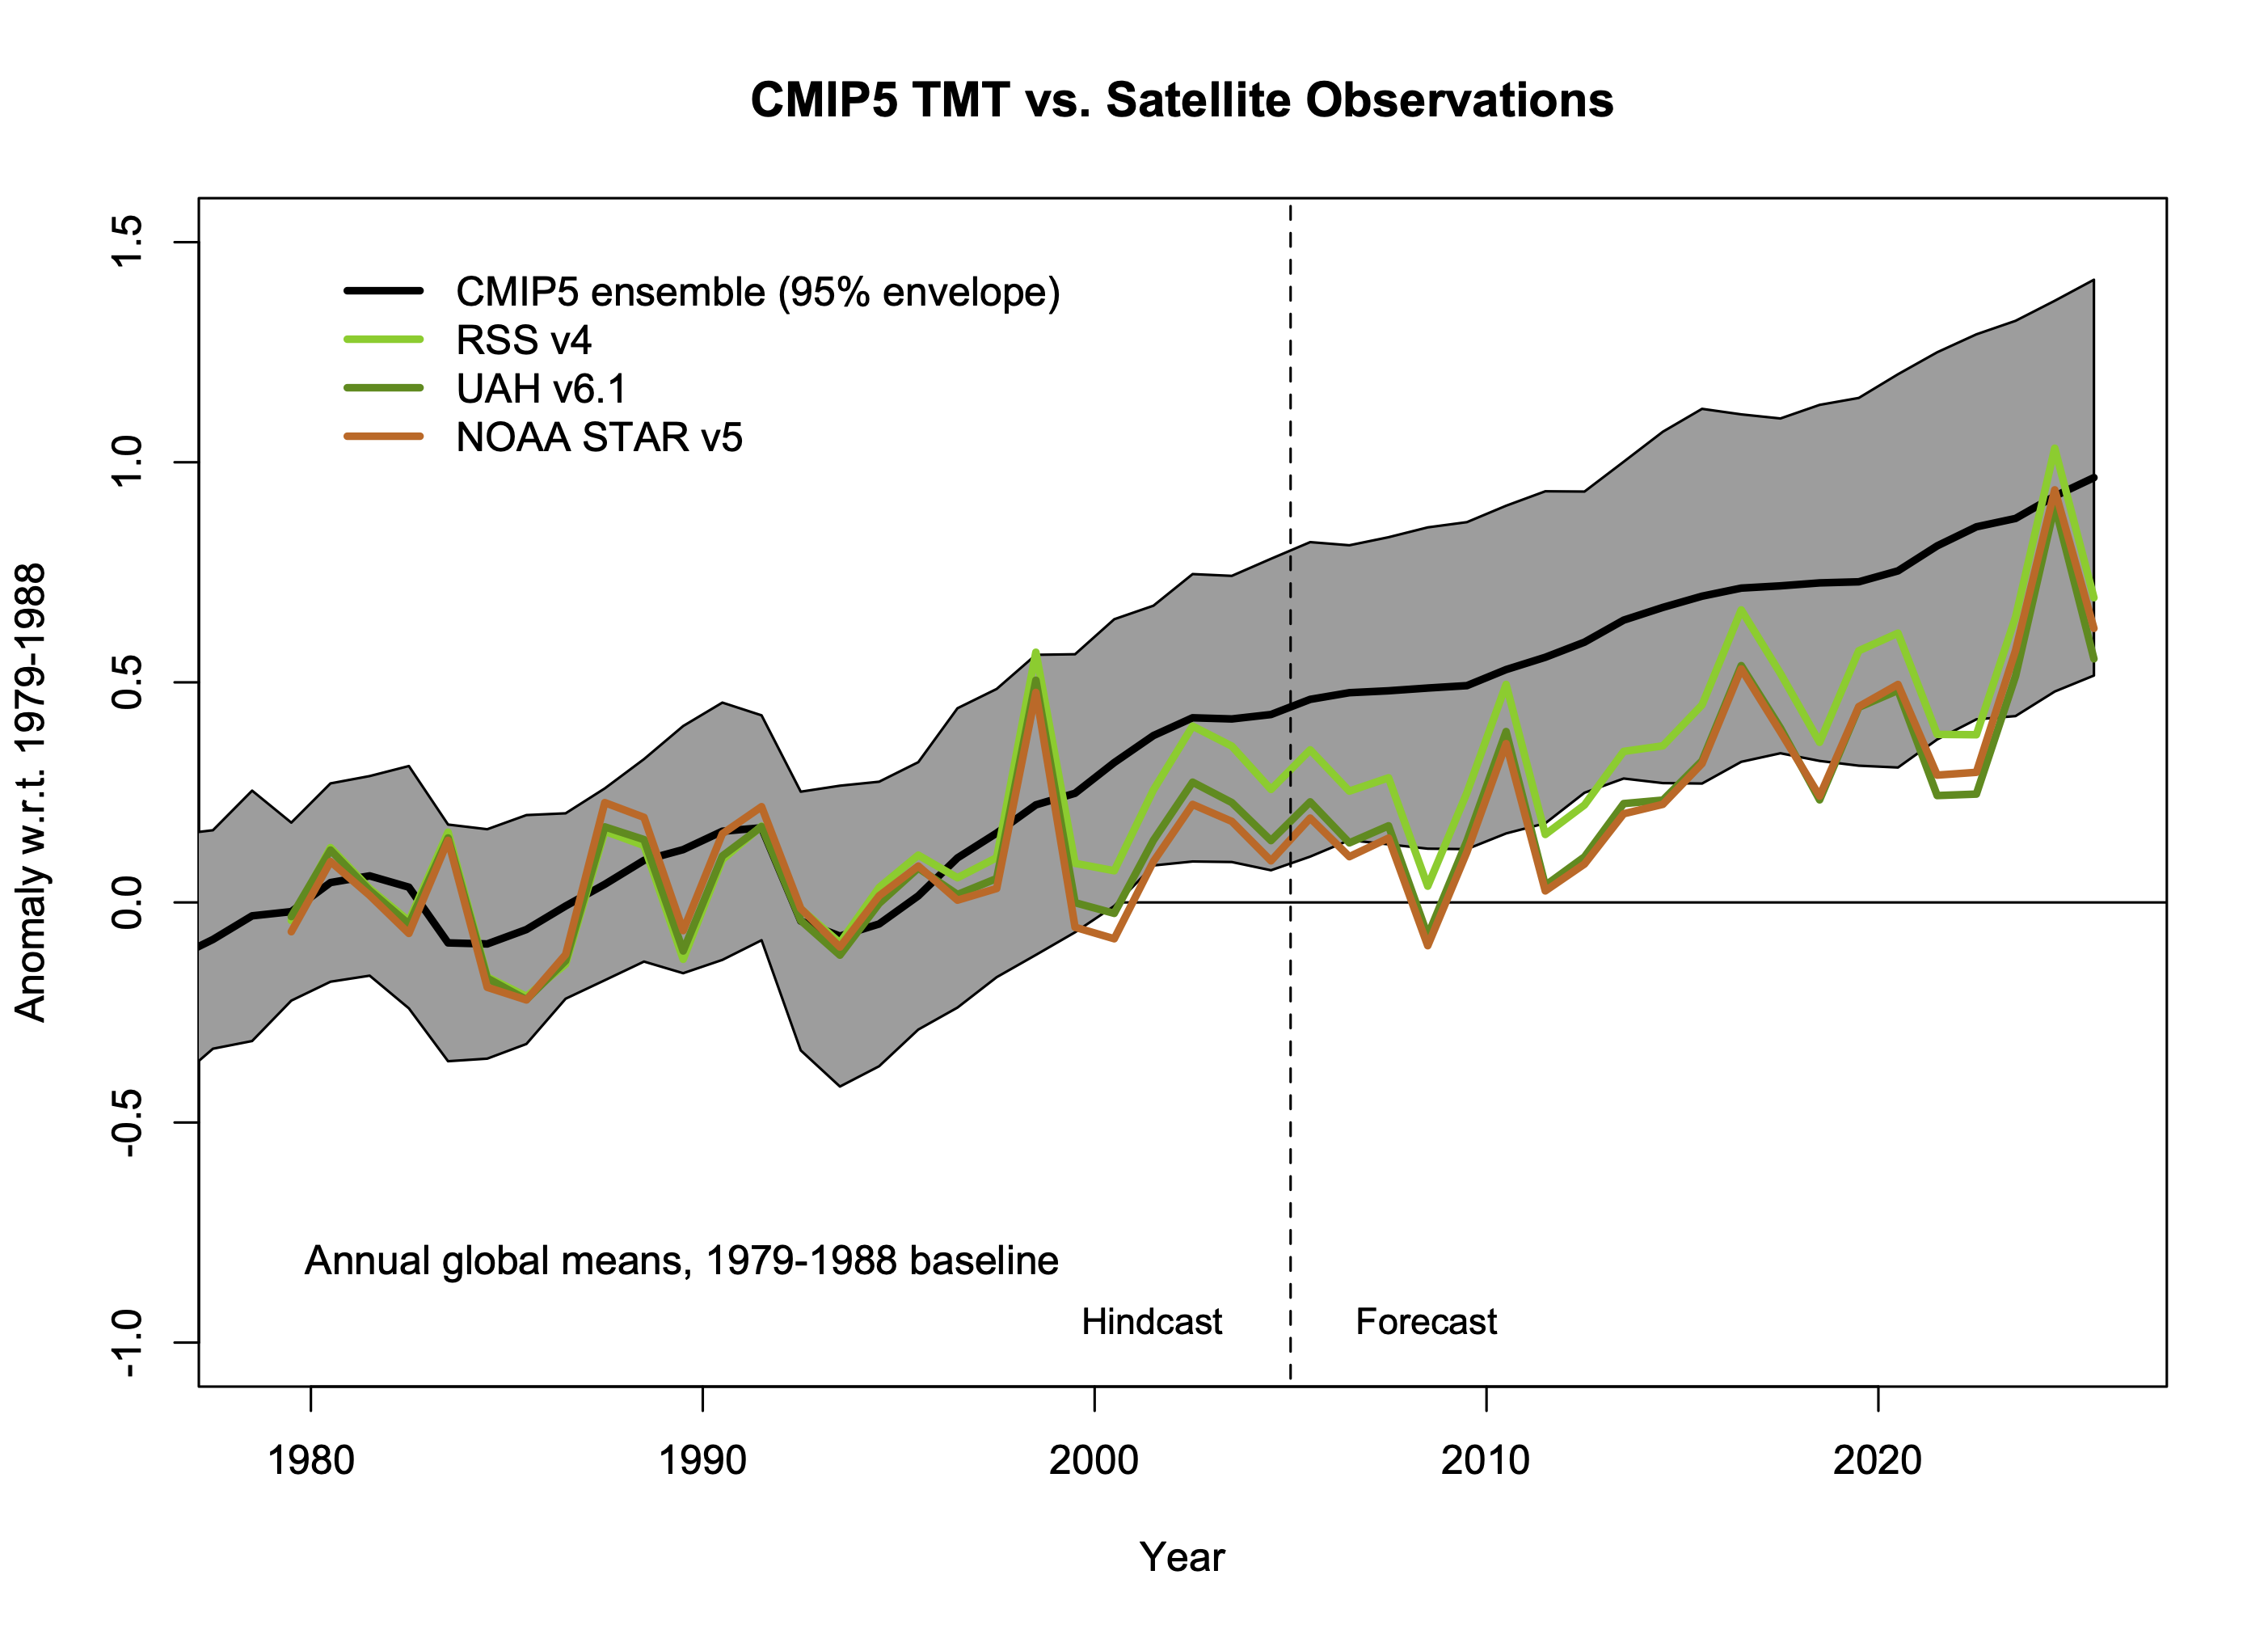
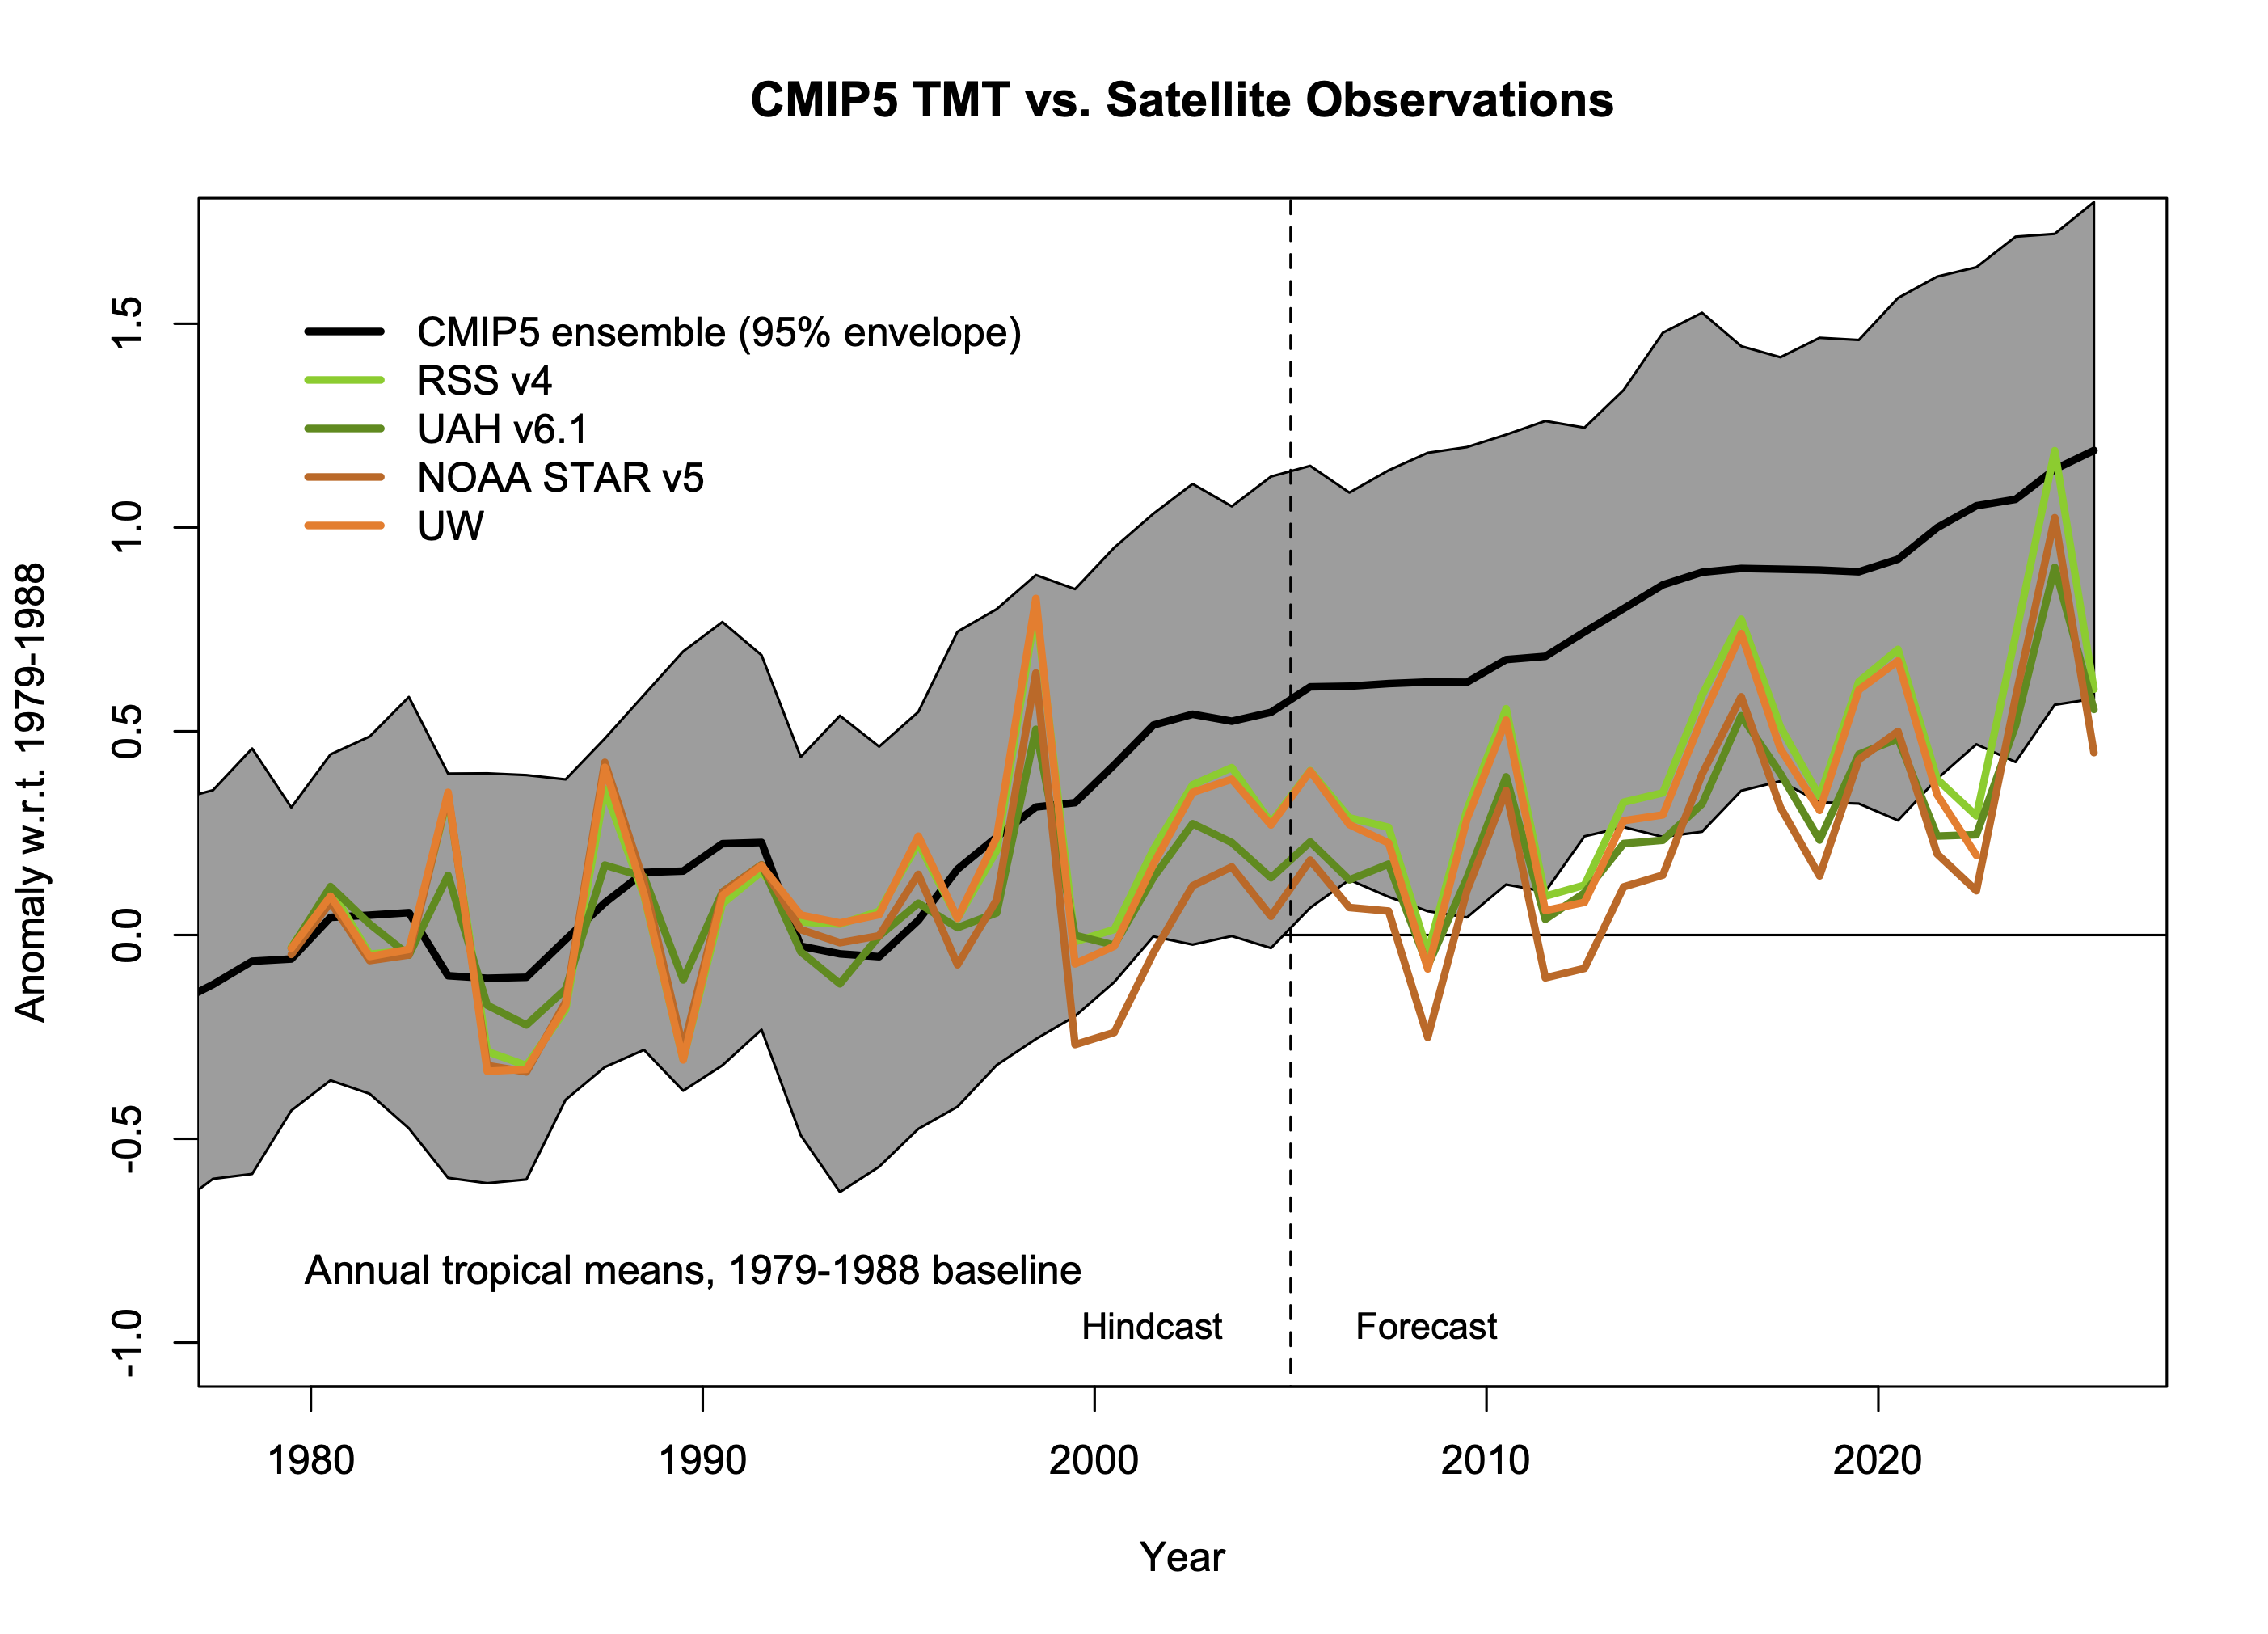
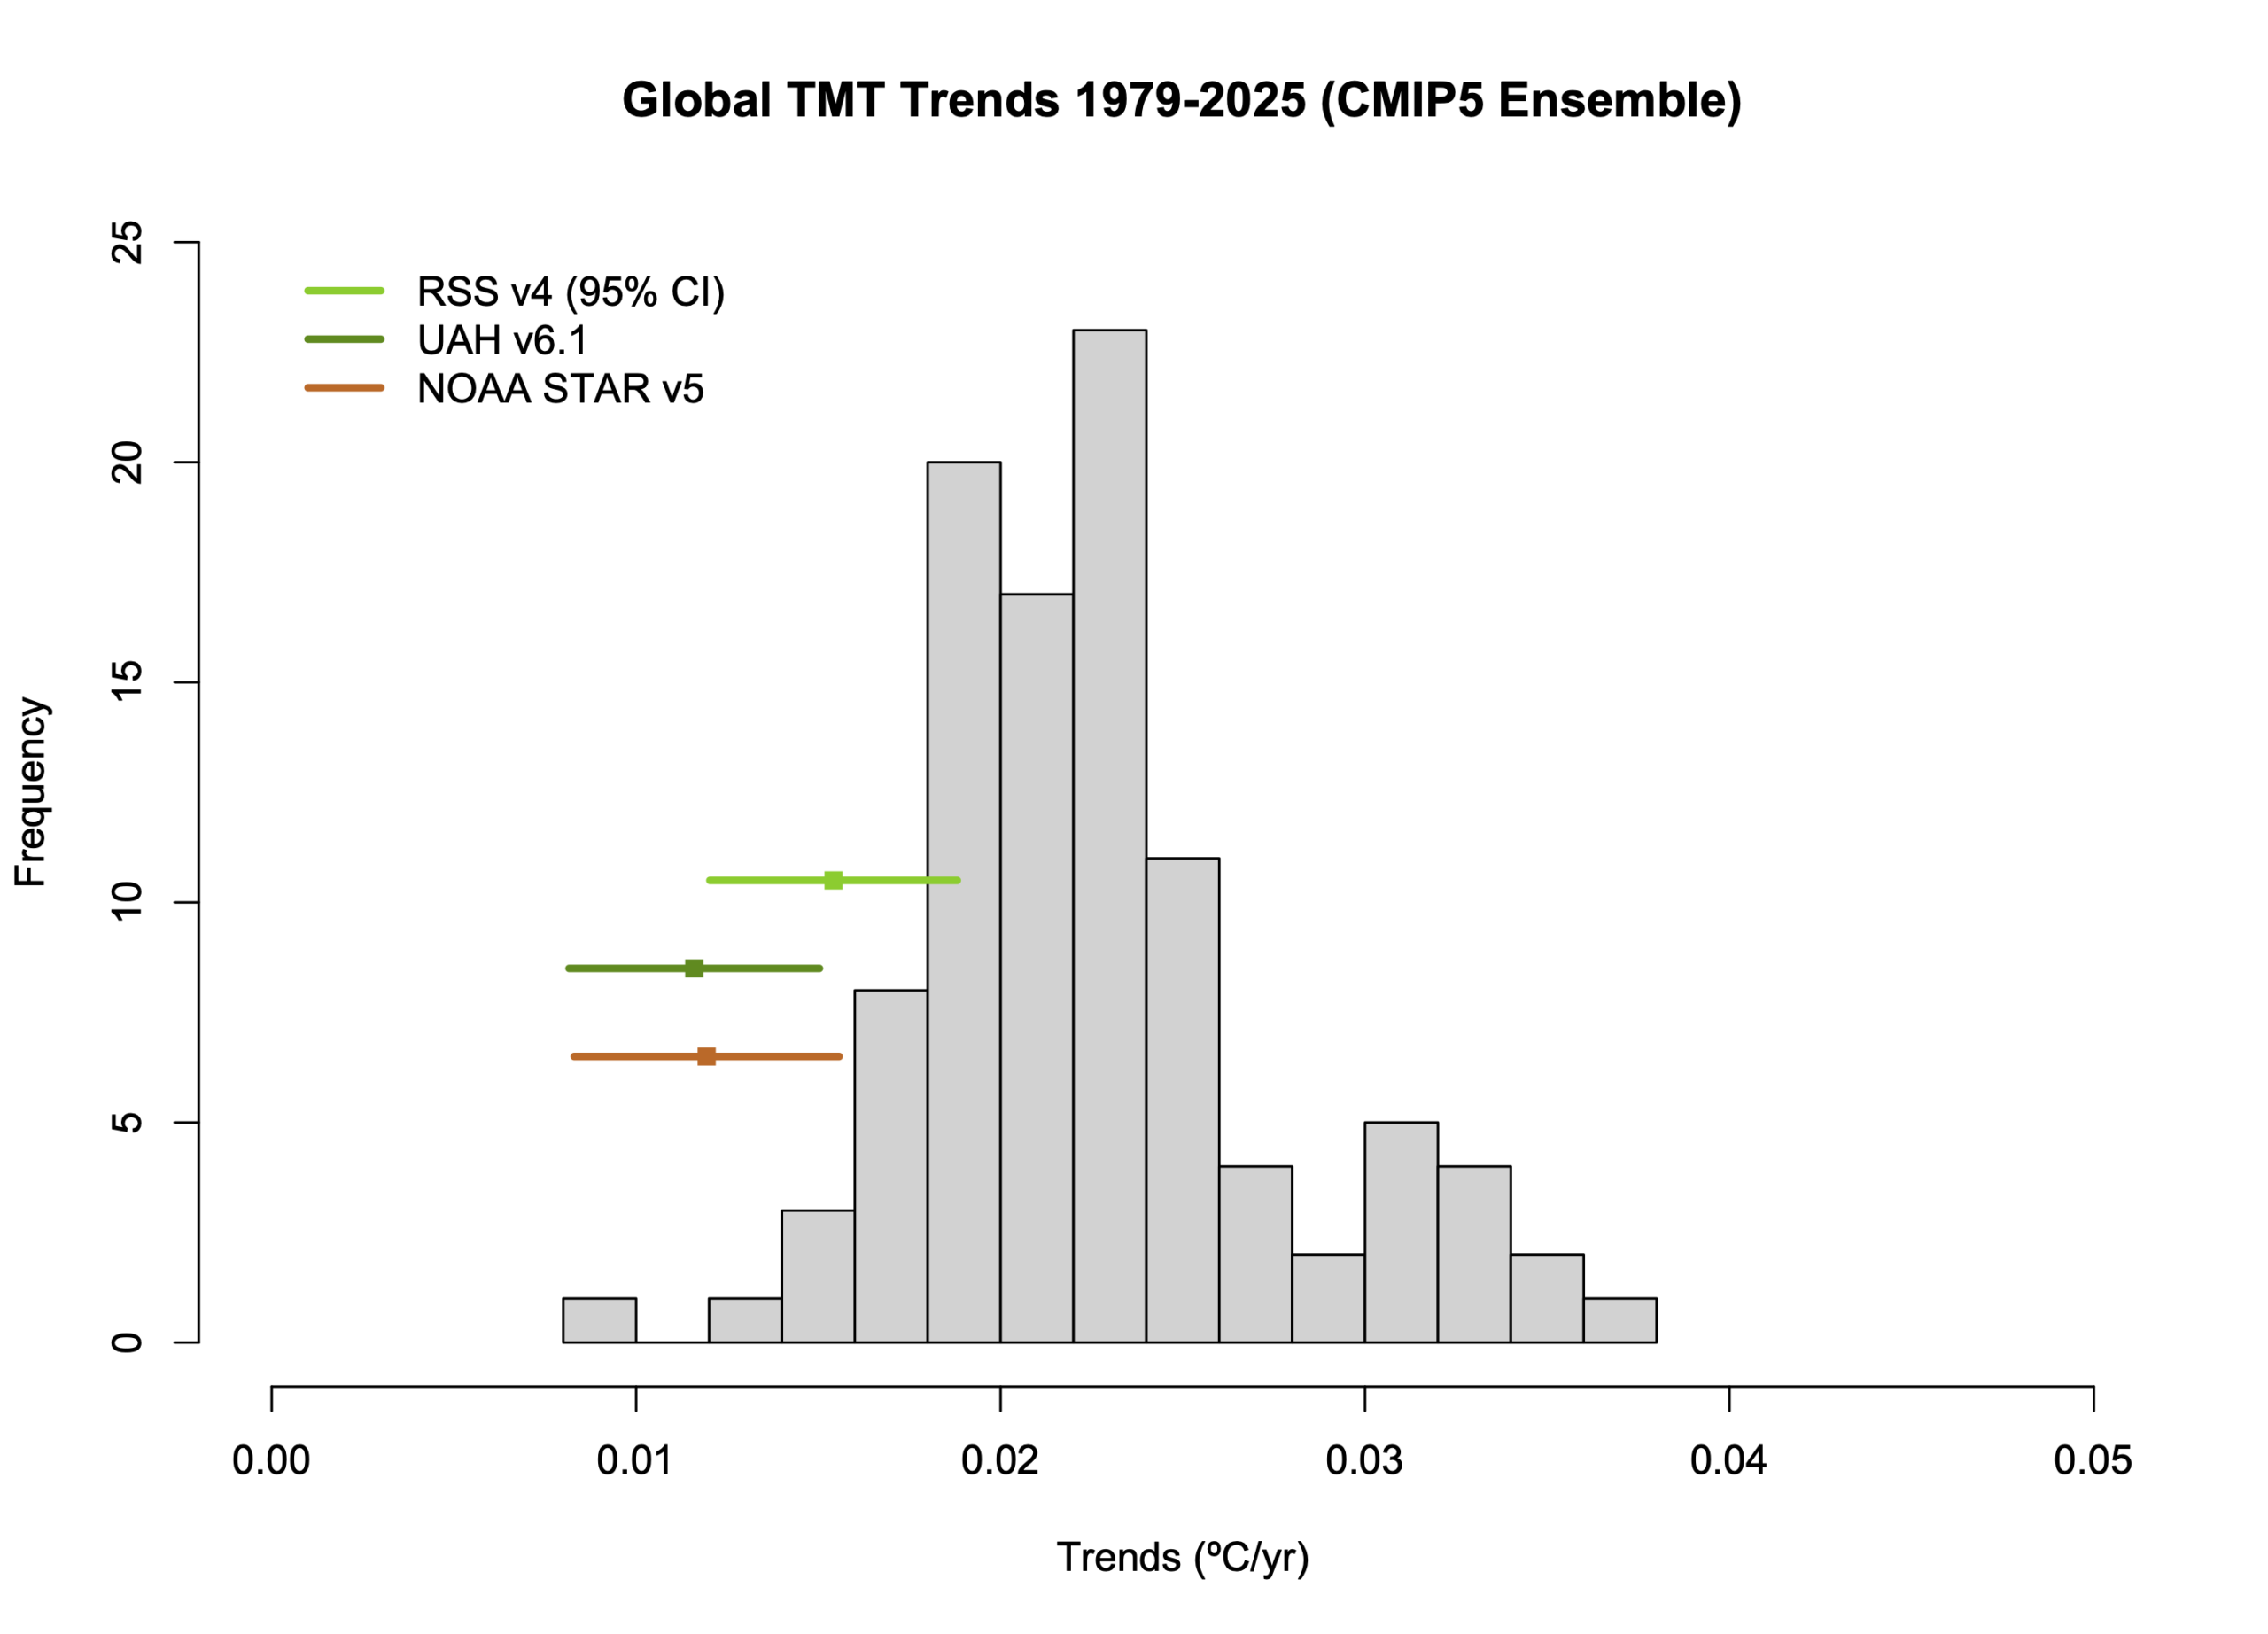
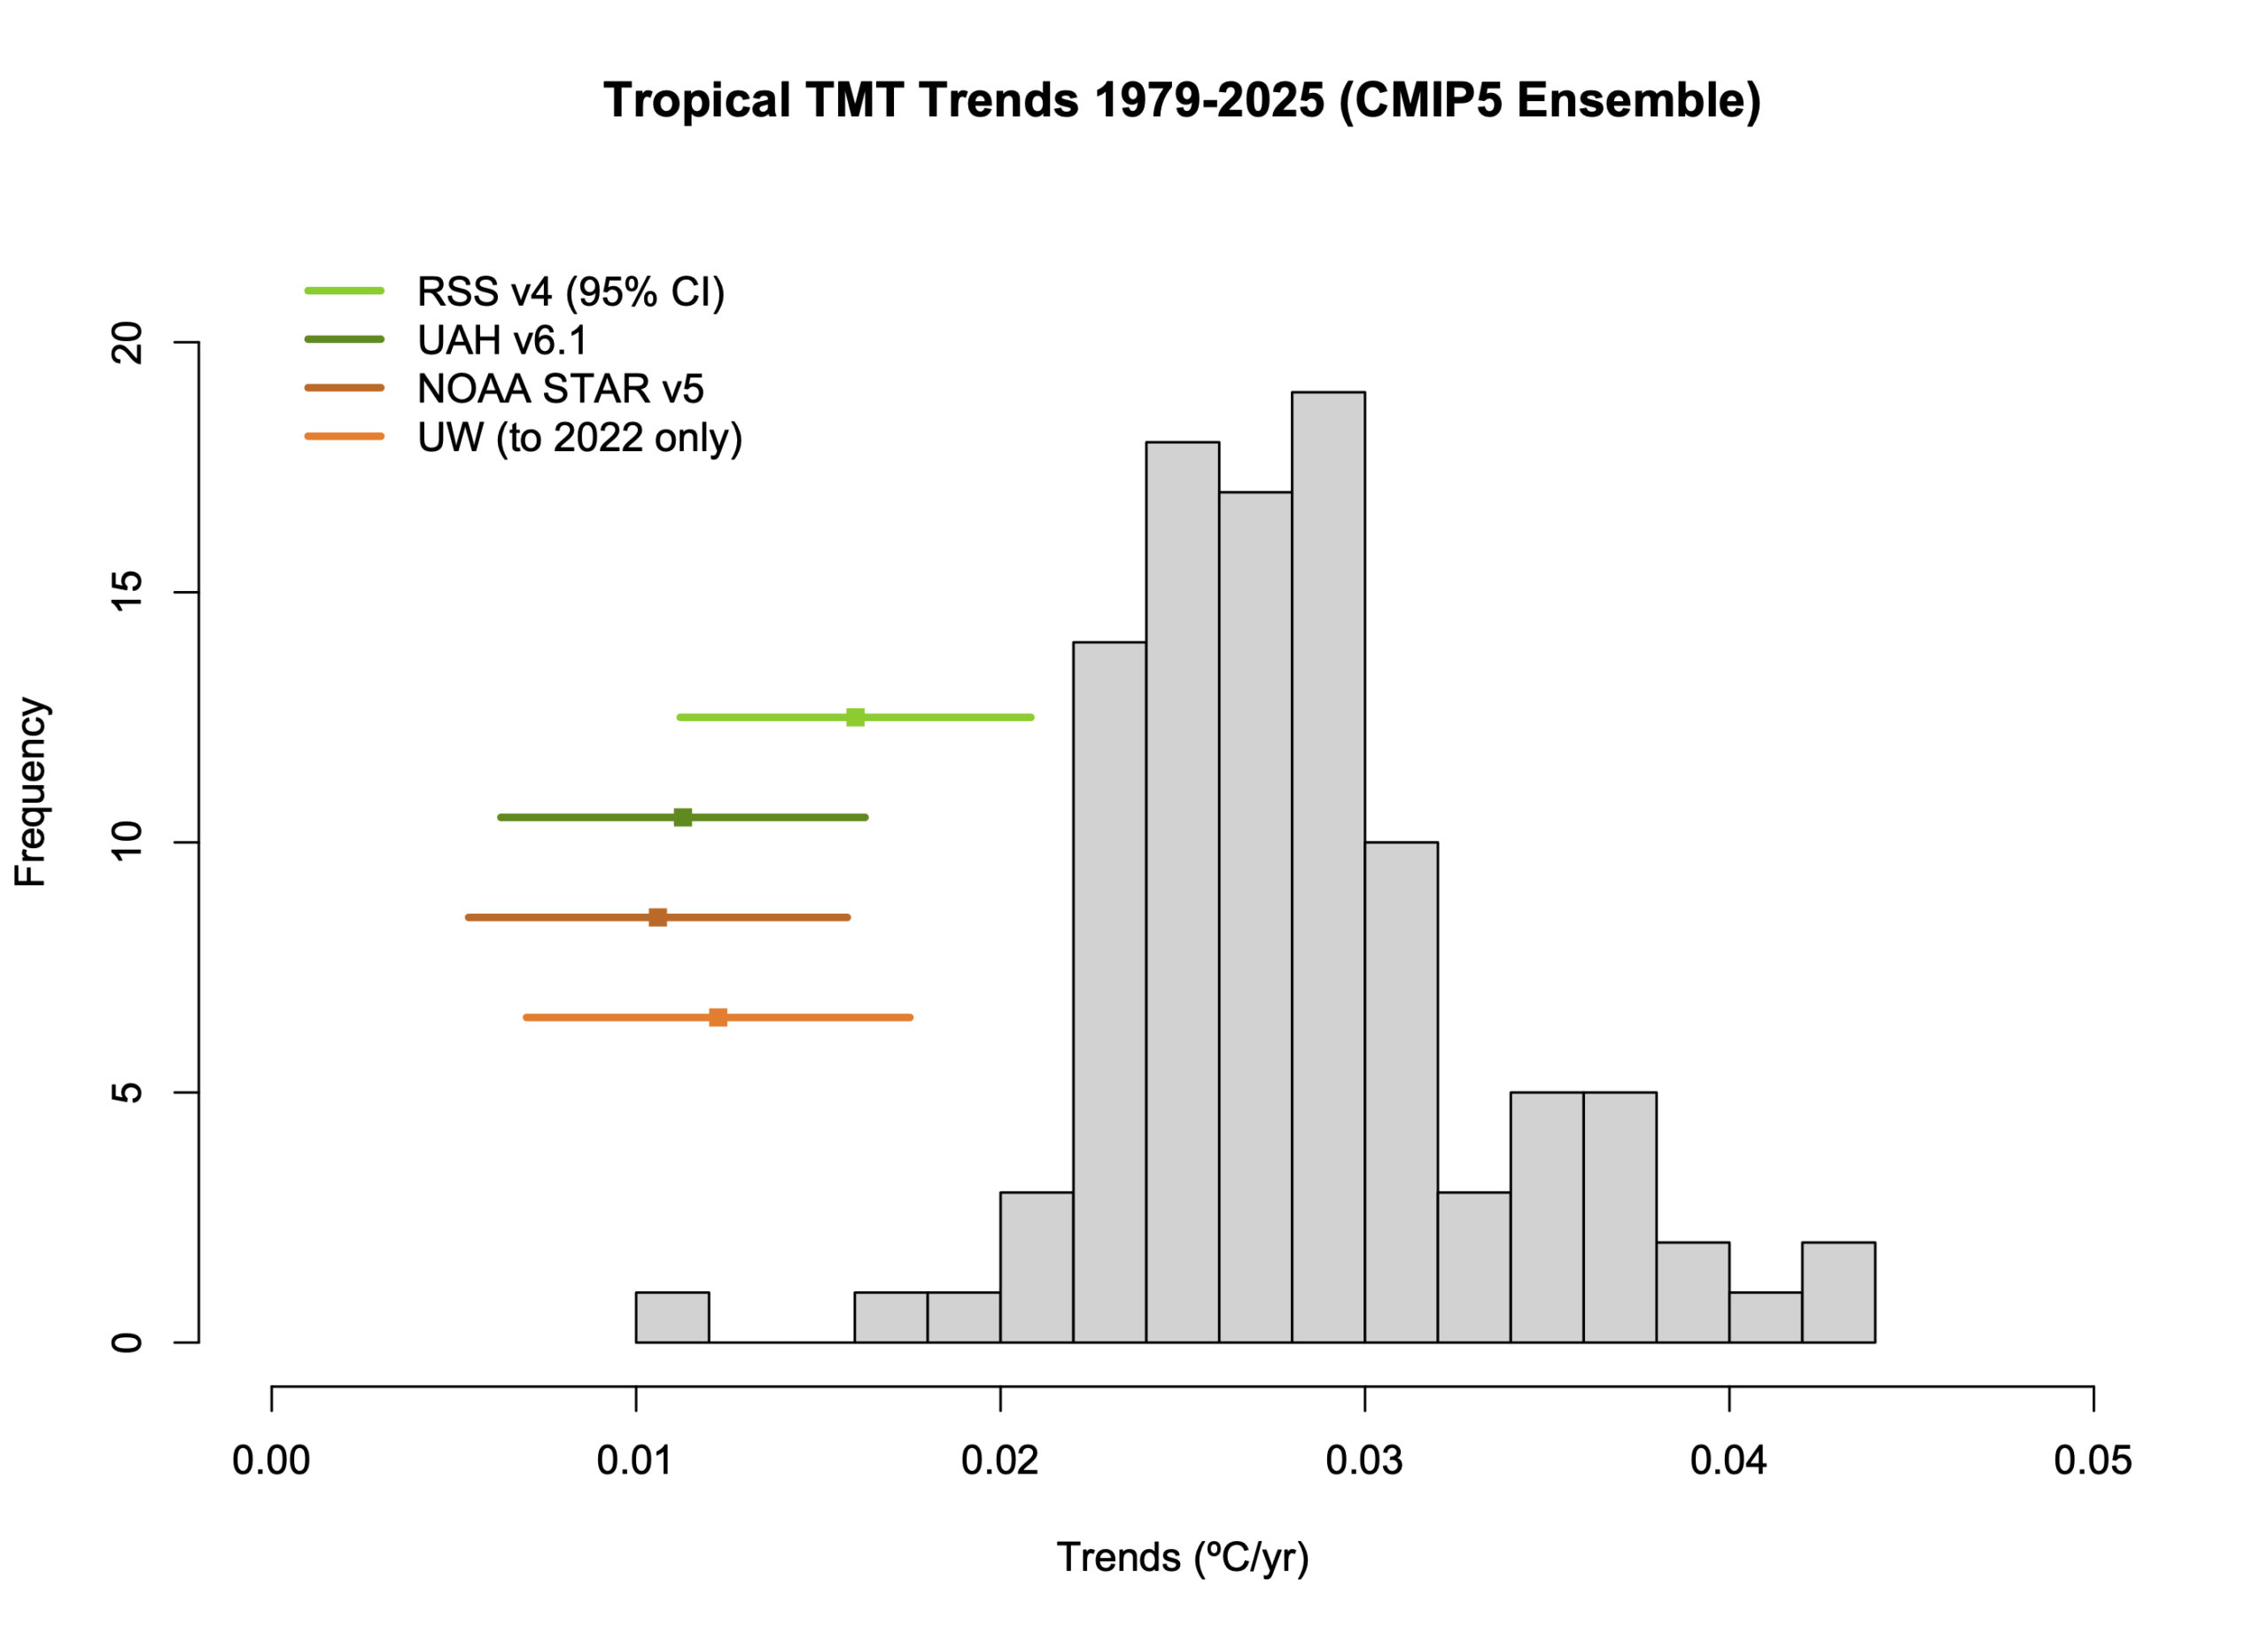
Original discussion (Jan 2017). Mid-troposphere satellite products from UAH, RSS, NOAA STAR and UW (Po-Chedley et al, “UW” tropical values only – updated to 2022 only). Model values use synthetic MSU/AMSU-TMT weightings, spread is 95% envelope of simulations, but this product only exists up to 2025, so these figures won’t be updated again. Last updated: 25 Jan 2026.
Corrected-TMT (Tropical means) (timeseries and trends)
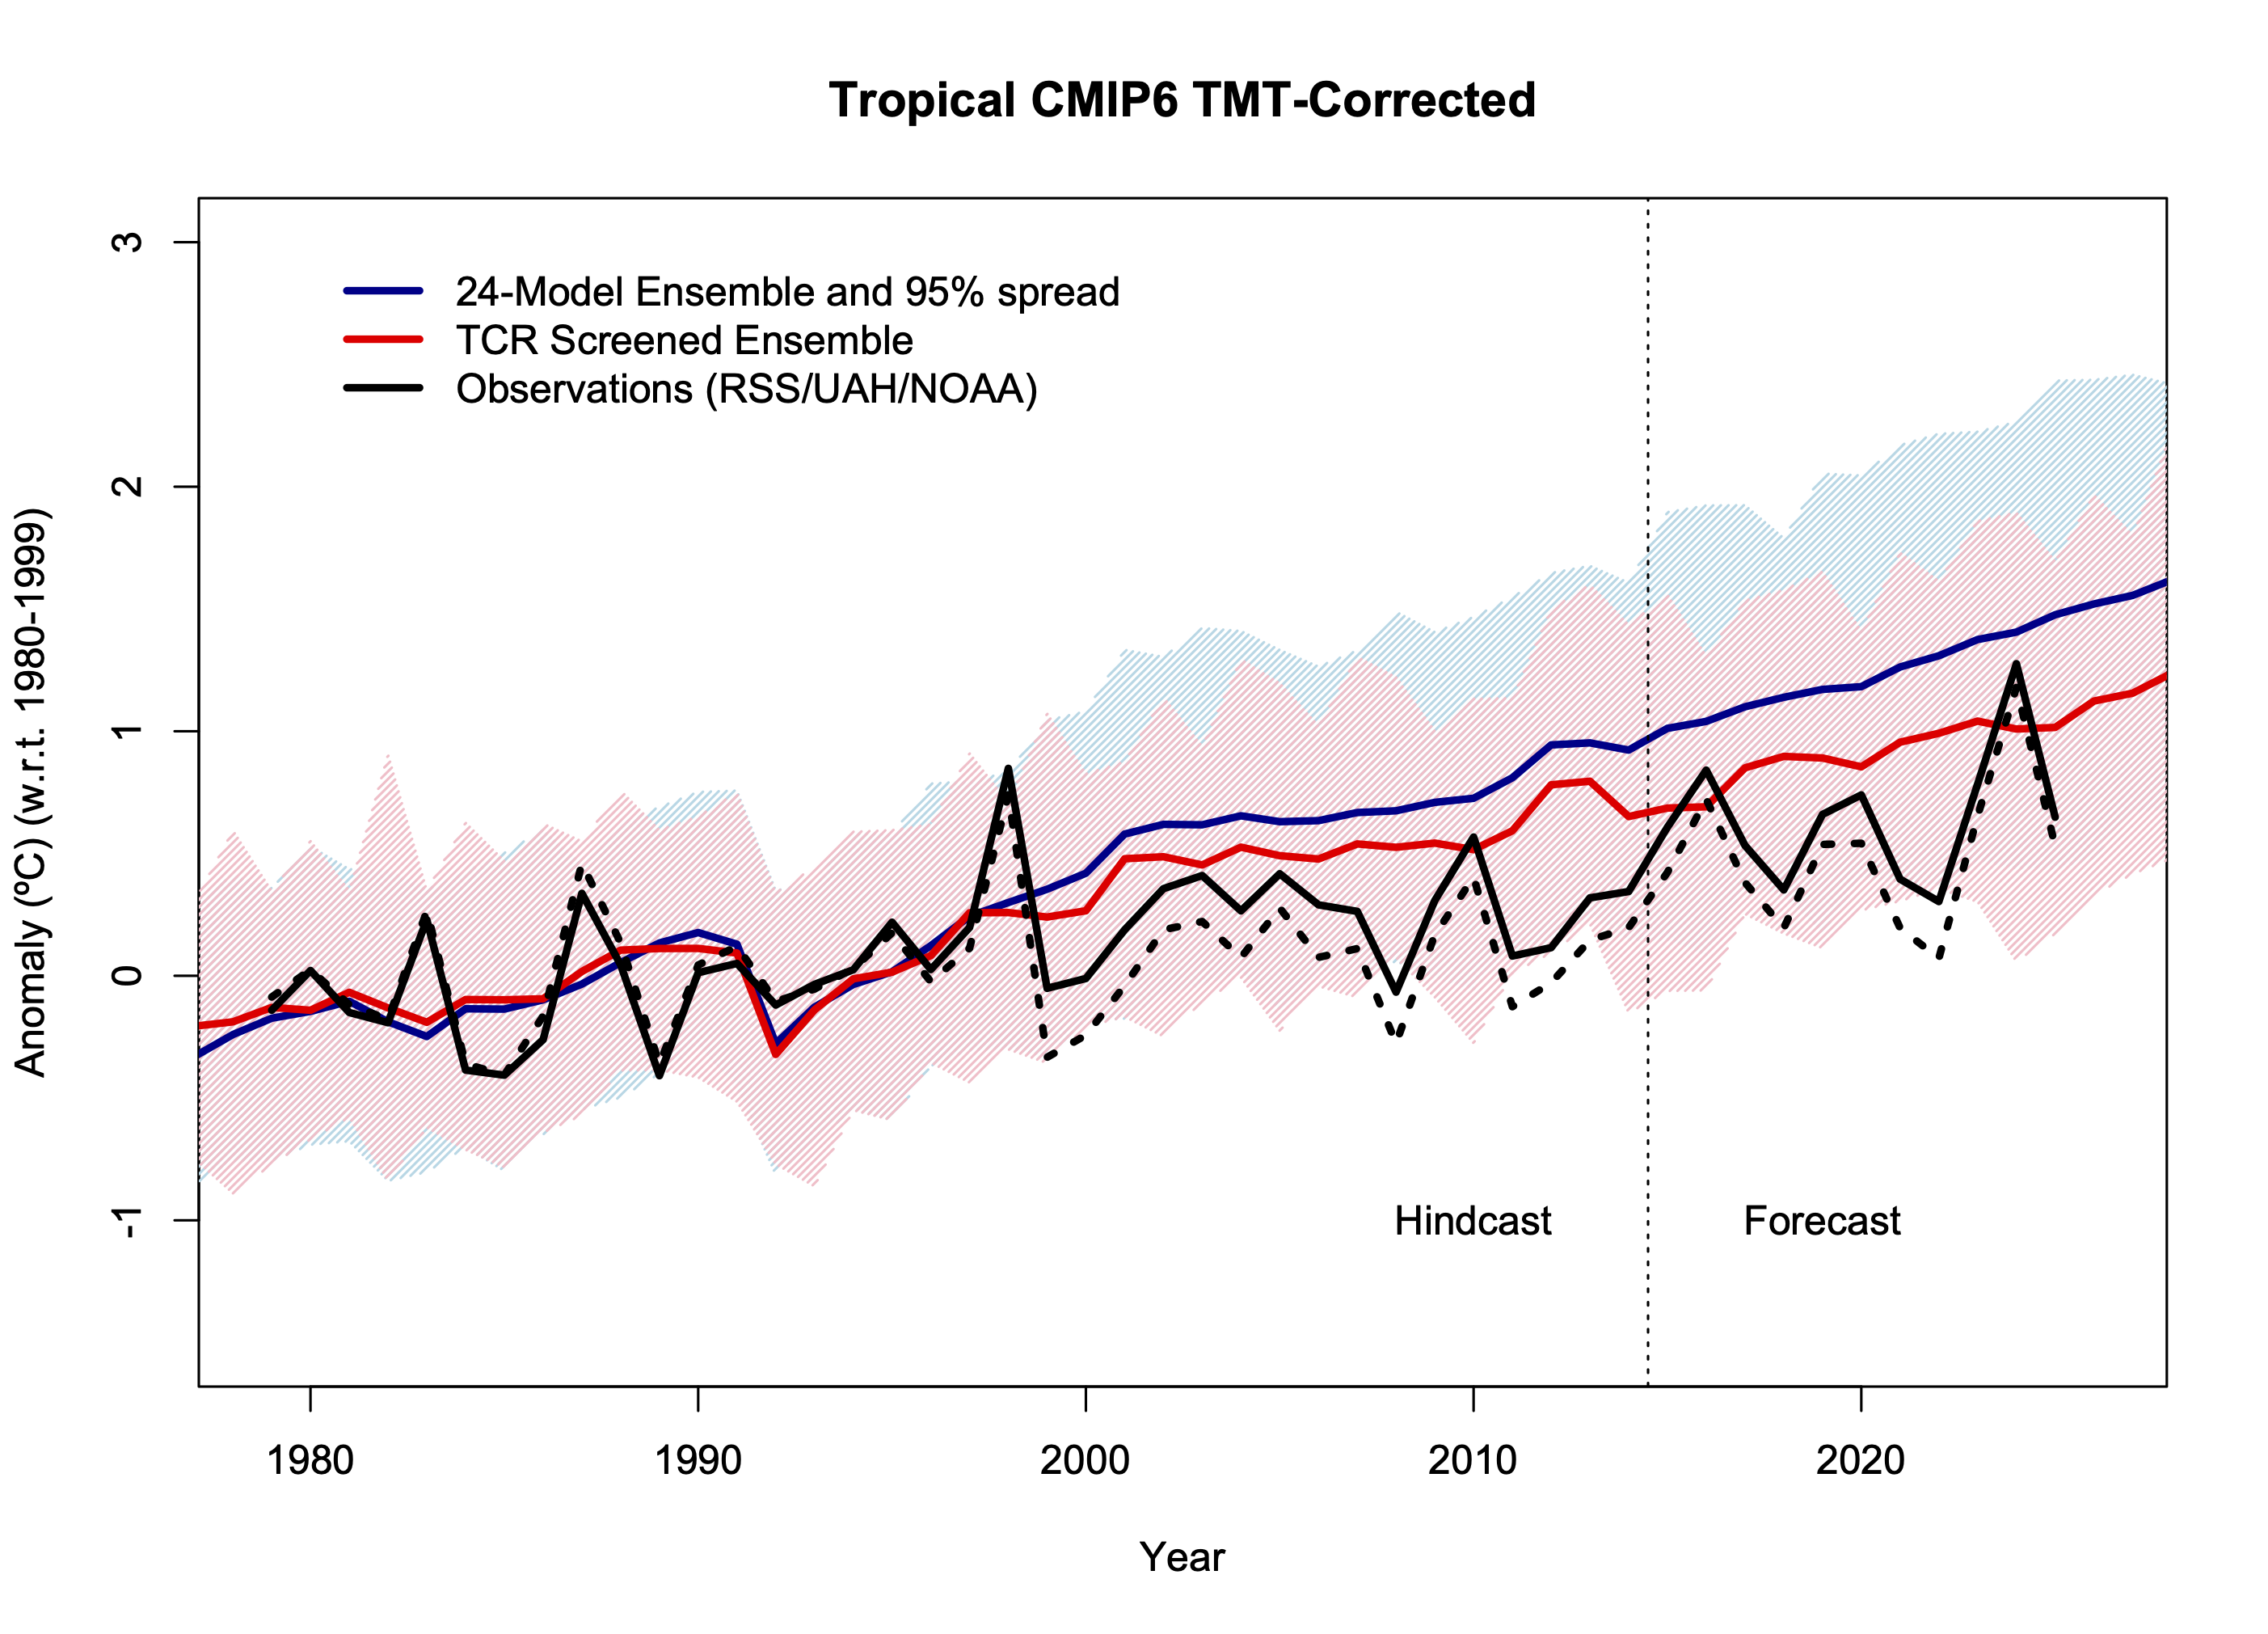
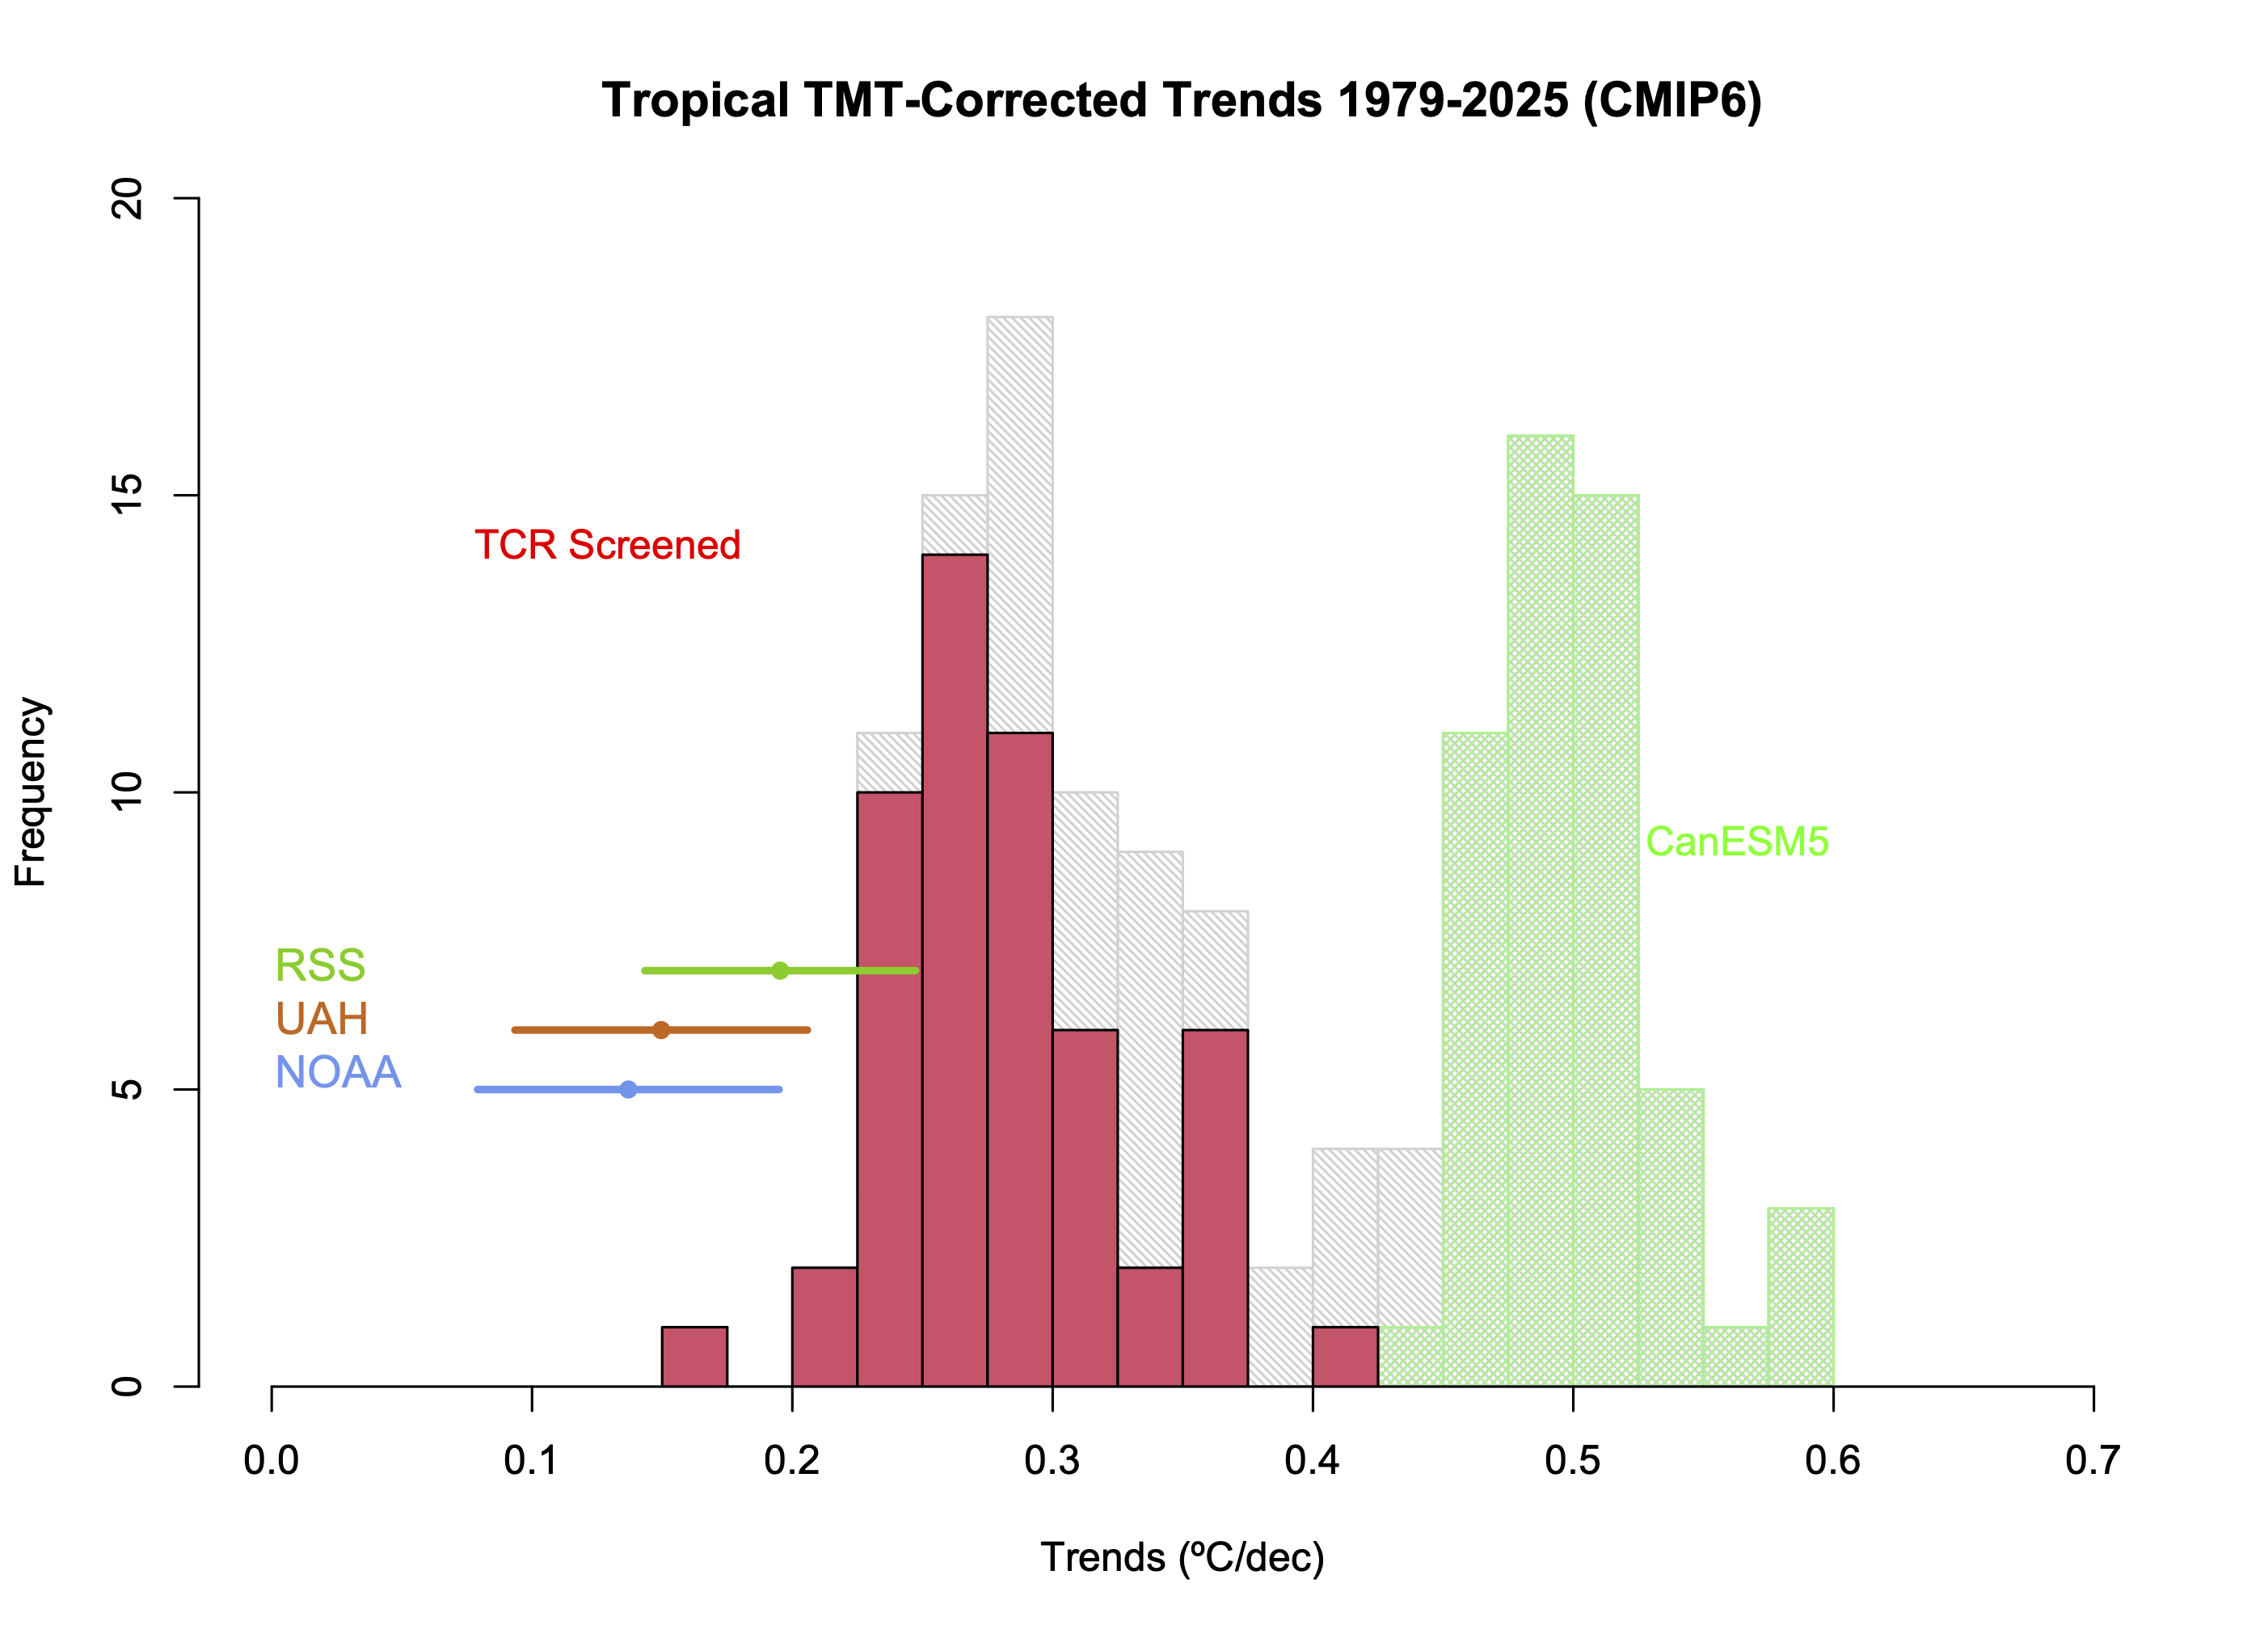
Original discussion Mar 2023. The TMT-corrected diagnostic (where the TMT is adjusted by the lower stratospheric changes (TLS)) in a 24-model subsample of the CMIP6 database (Po-Chedley et al., 2021) compared to RSS v4, UAH v6.1 and NOAA STAR v5. Plots includes the full ensemble, and then a subset of models that have a TCR within the IPCC AR6 likely range. Model values use synthetic TMT-corrected weightings, spread is 95% envelope of simulations. Last updated: 23 Jan 2026.
TLT (timeseries and trends)
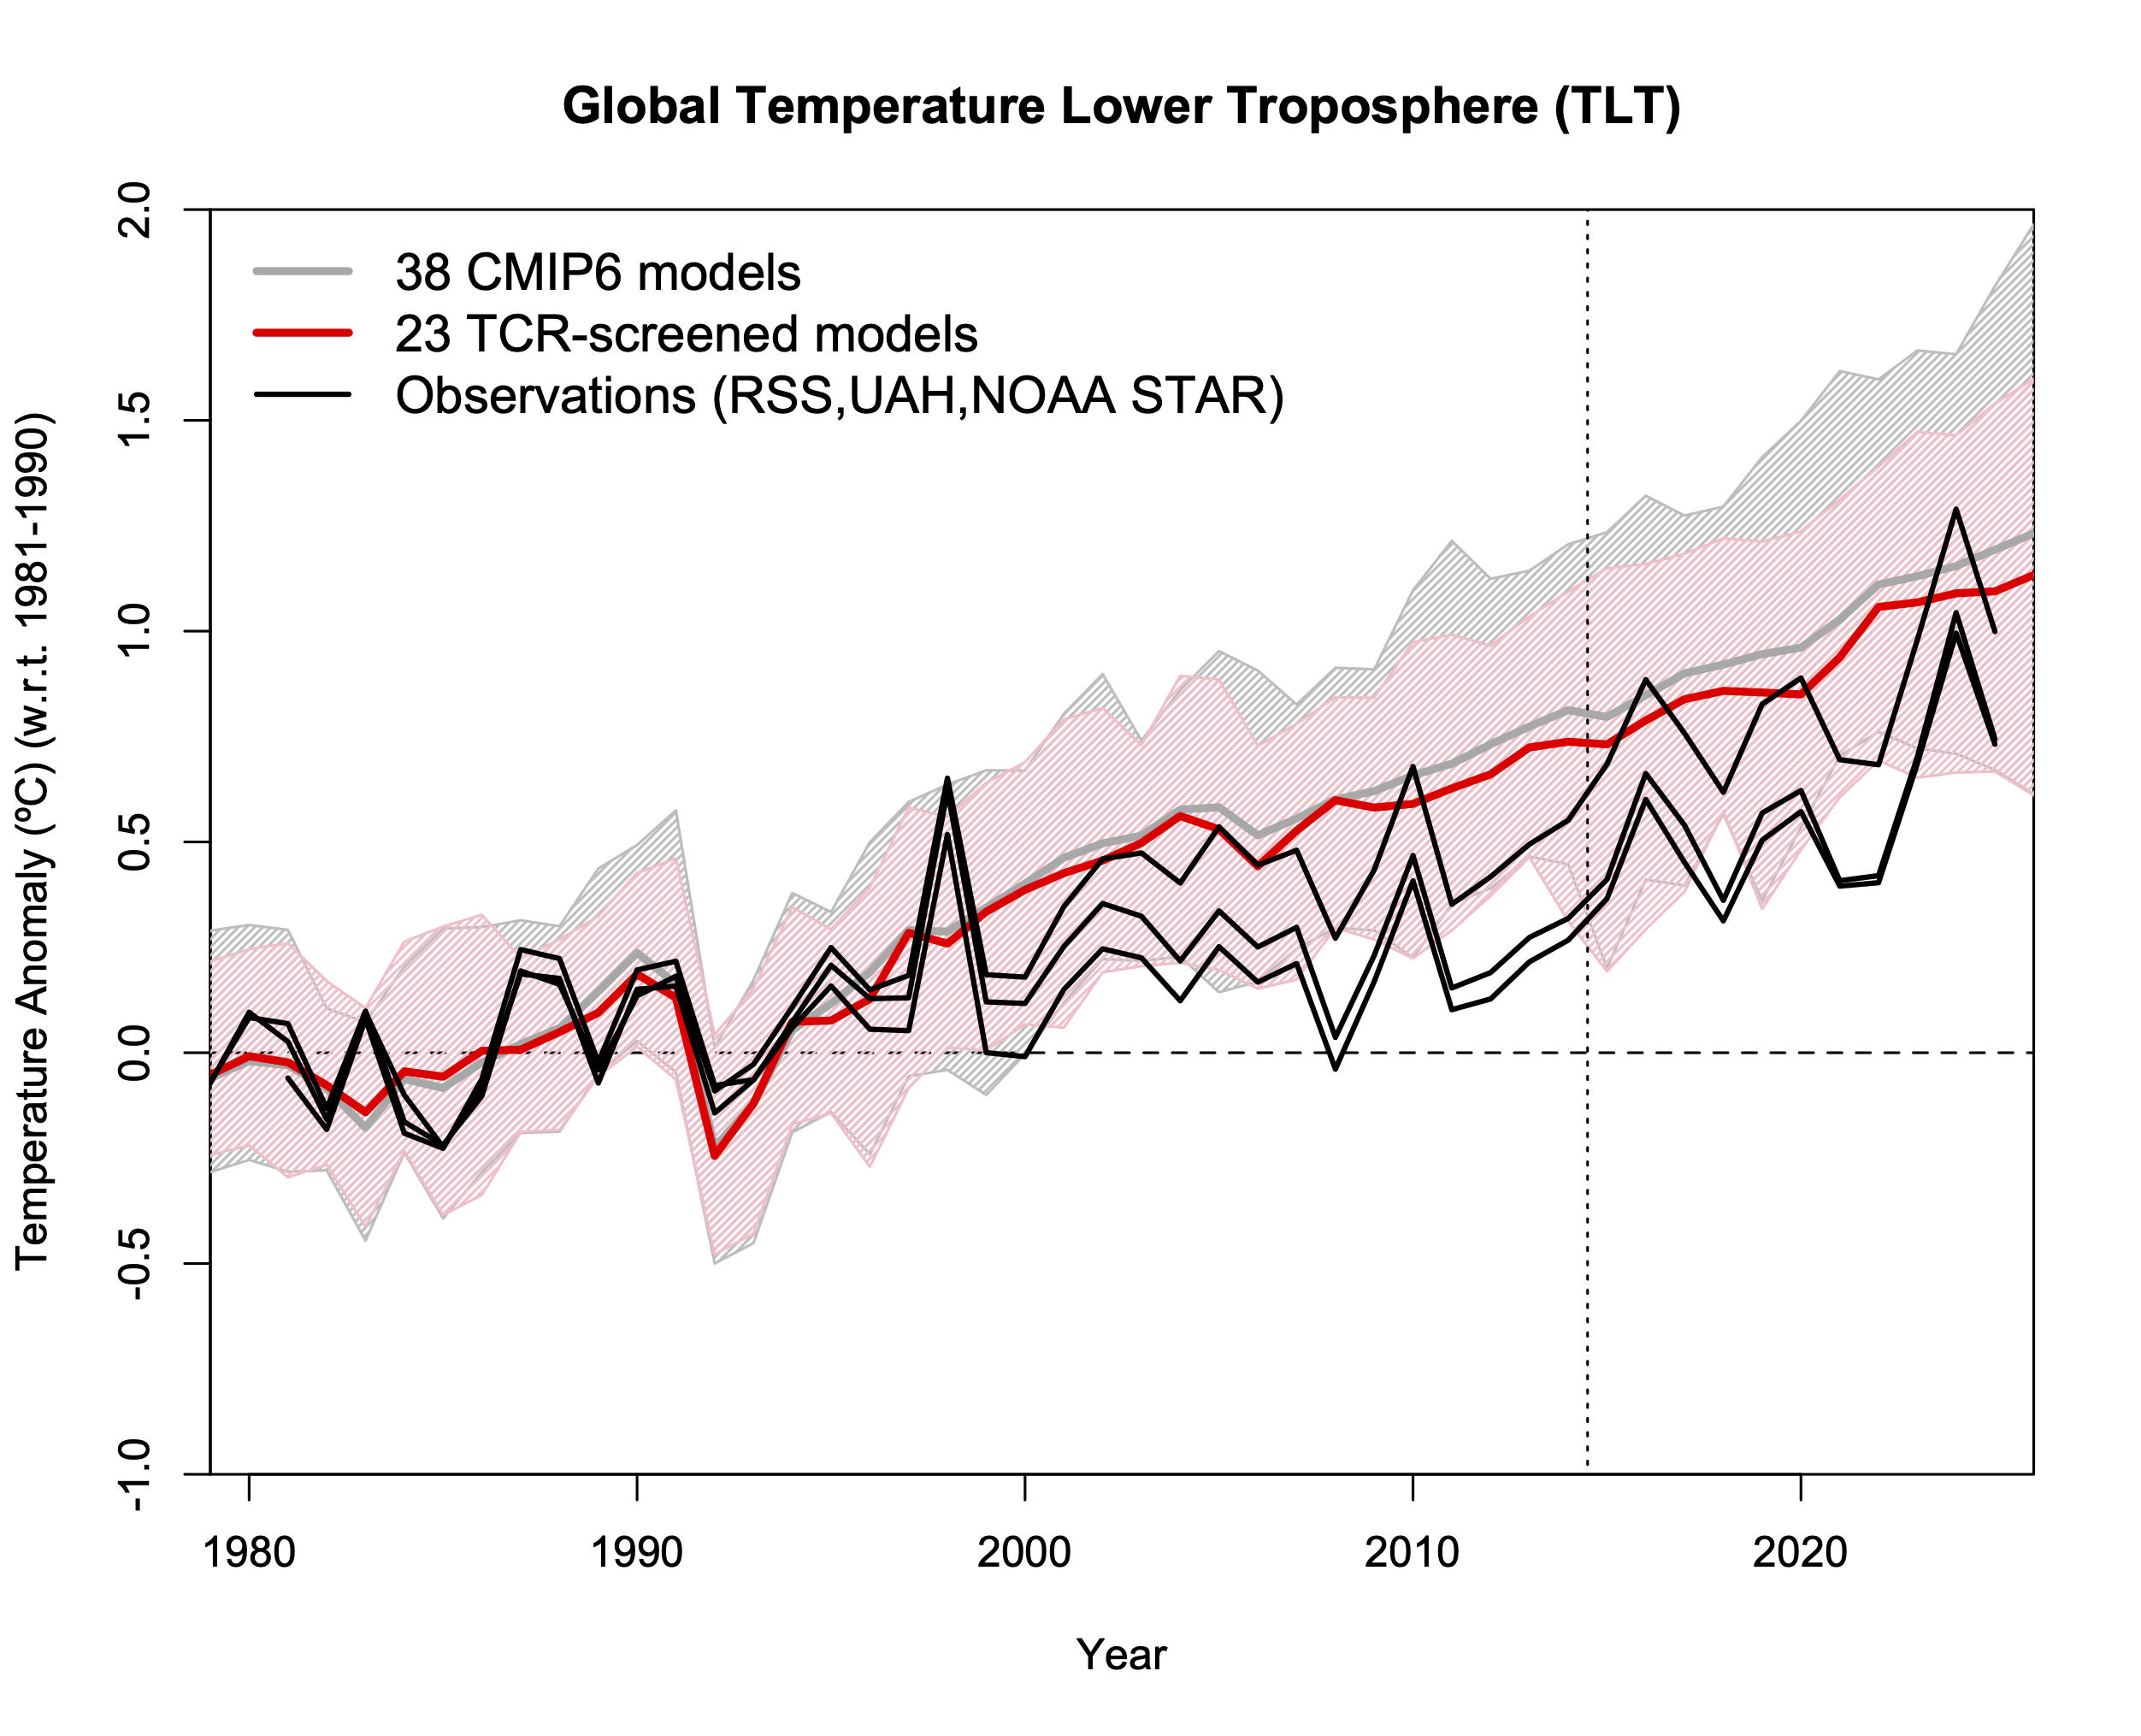
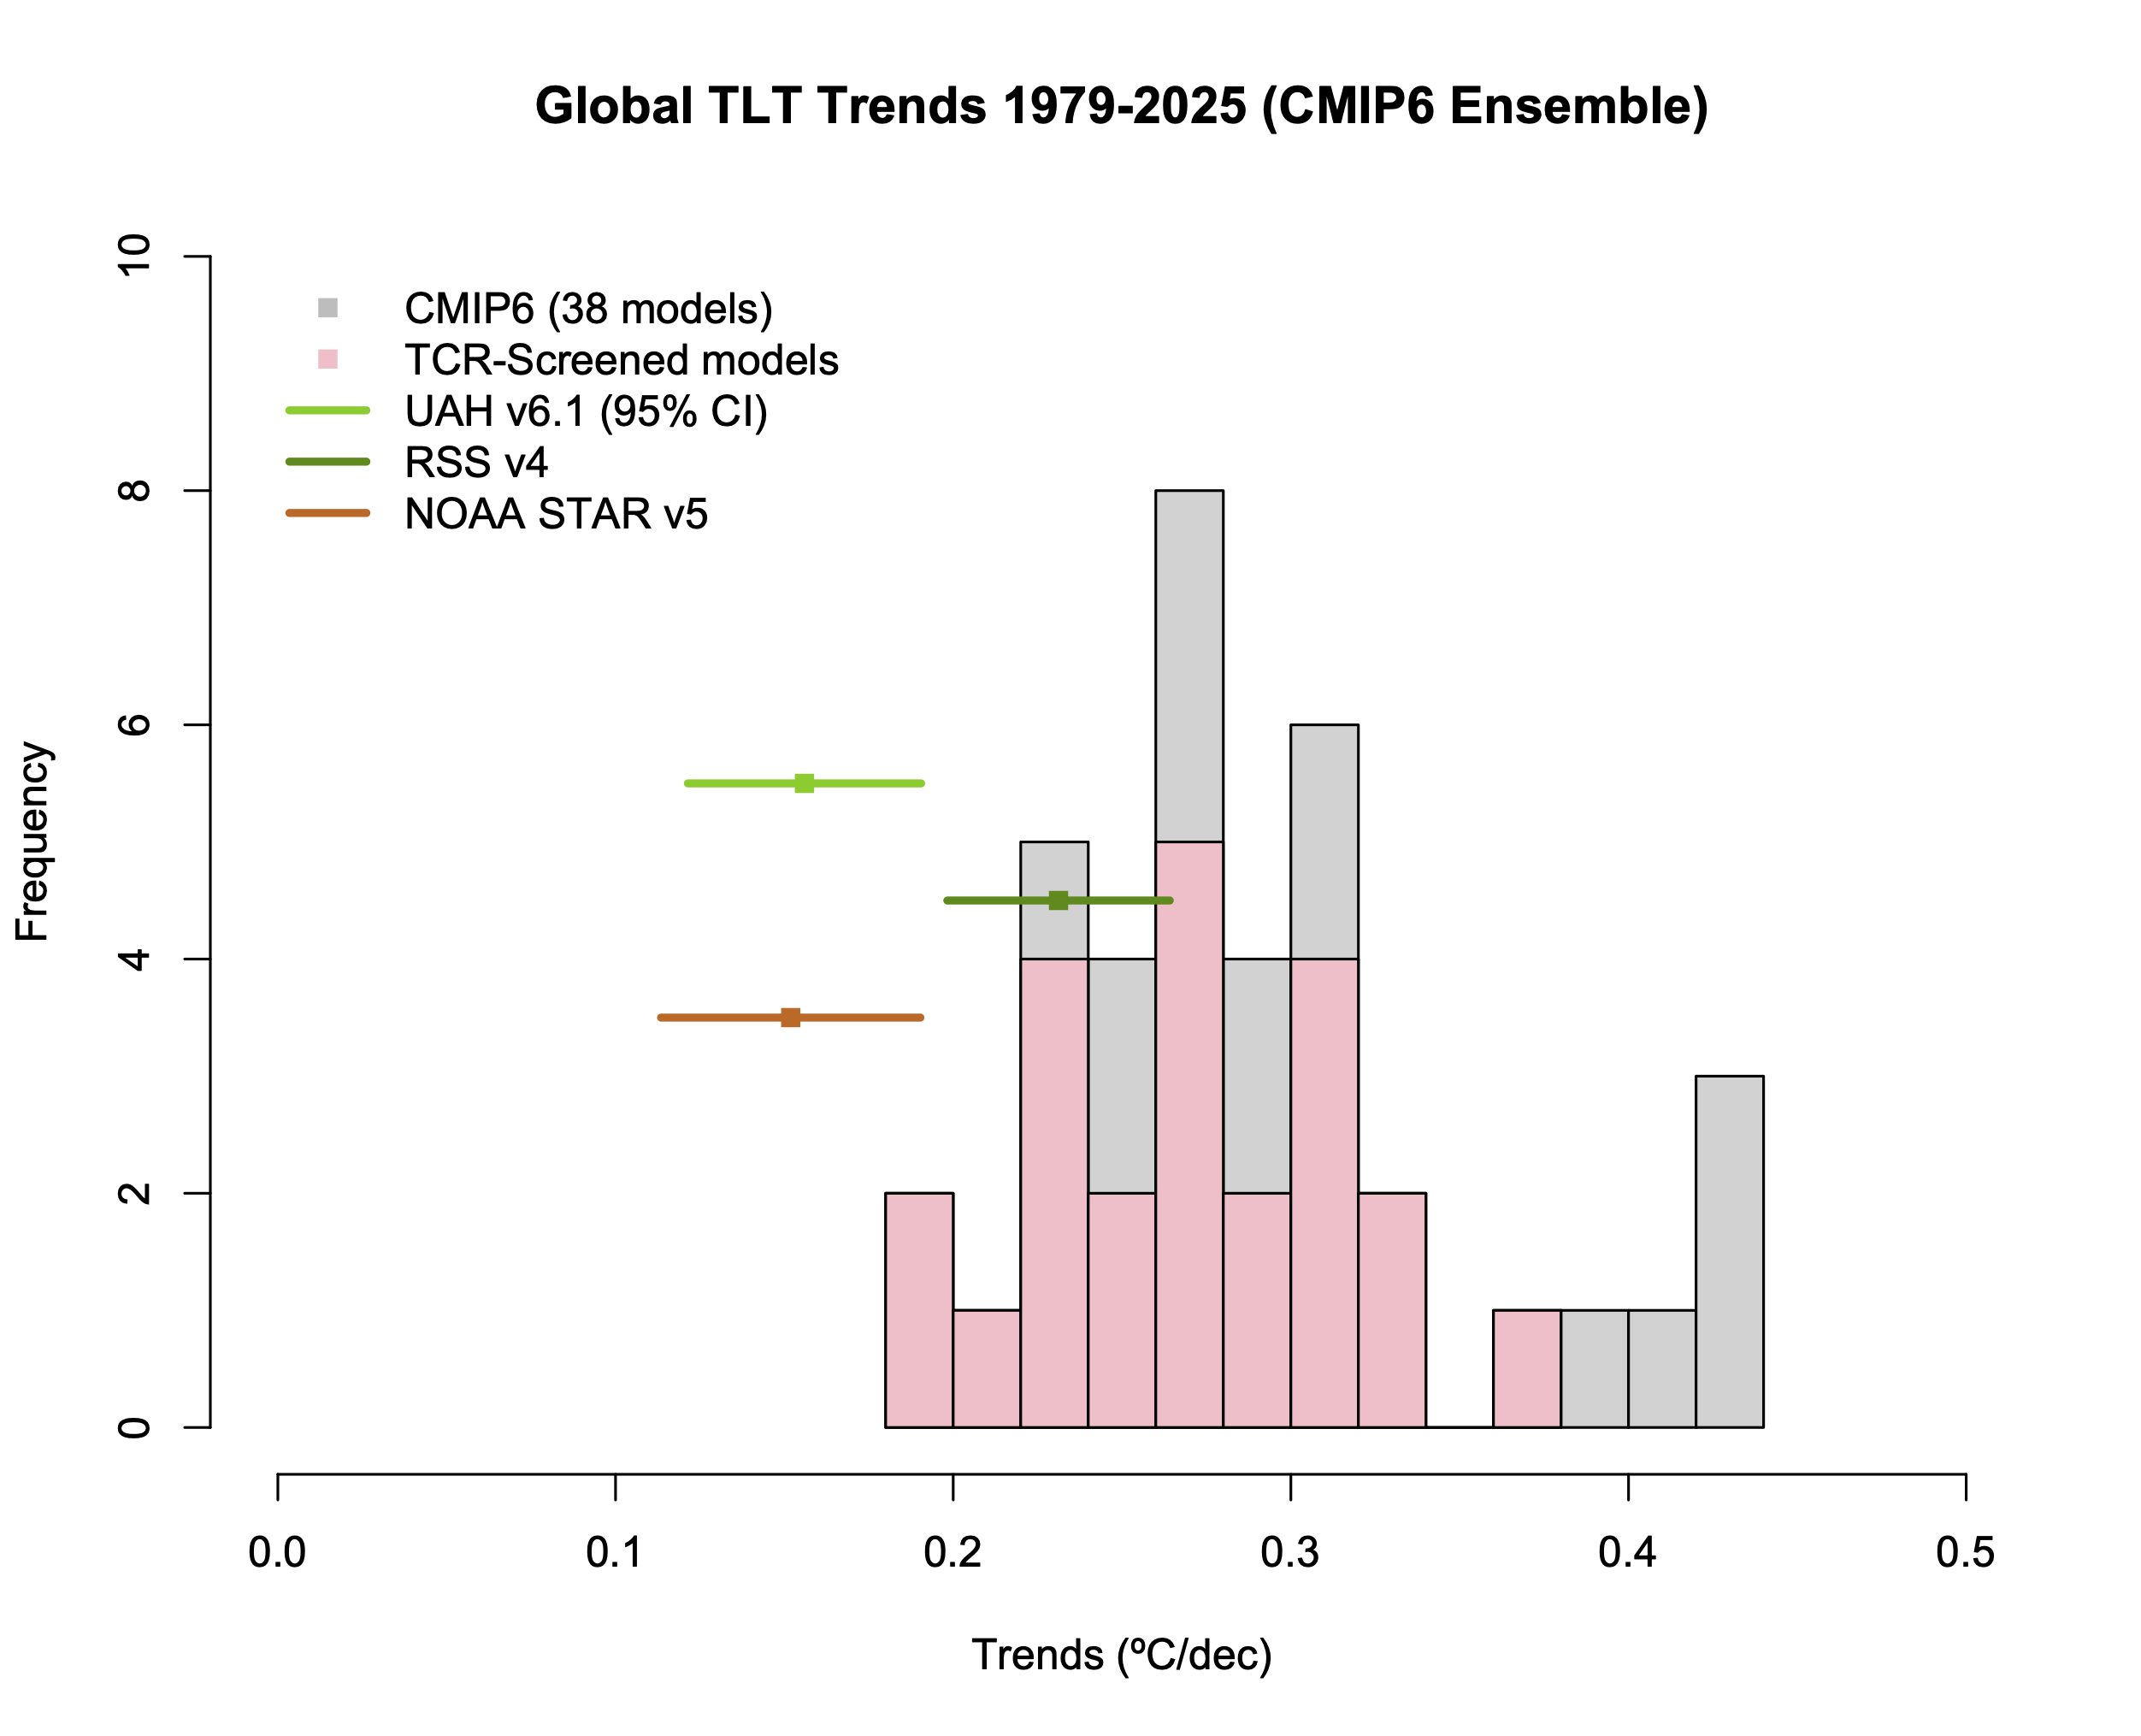
The Temperature of the Lower Troposphere (TLT) diagnostic in a 38-model subsample of the CMIP6 database (McKitrick and Christy, 2020) compared to RSS v4, UAH v6.1 and NOAA STAR v5. Plots includes the full ensemble, and then a subset of models that have a TCR within the IPCC AR6 likely range. Model values use synthetic TLT weightings, spread is 95% envelope of simulations. Last updated: 22 Jan 2026.
Stratospheric temperature changes
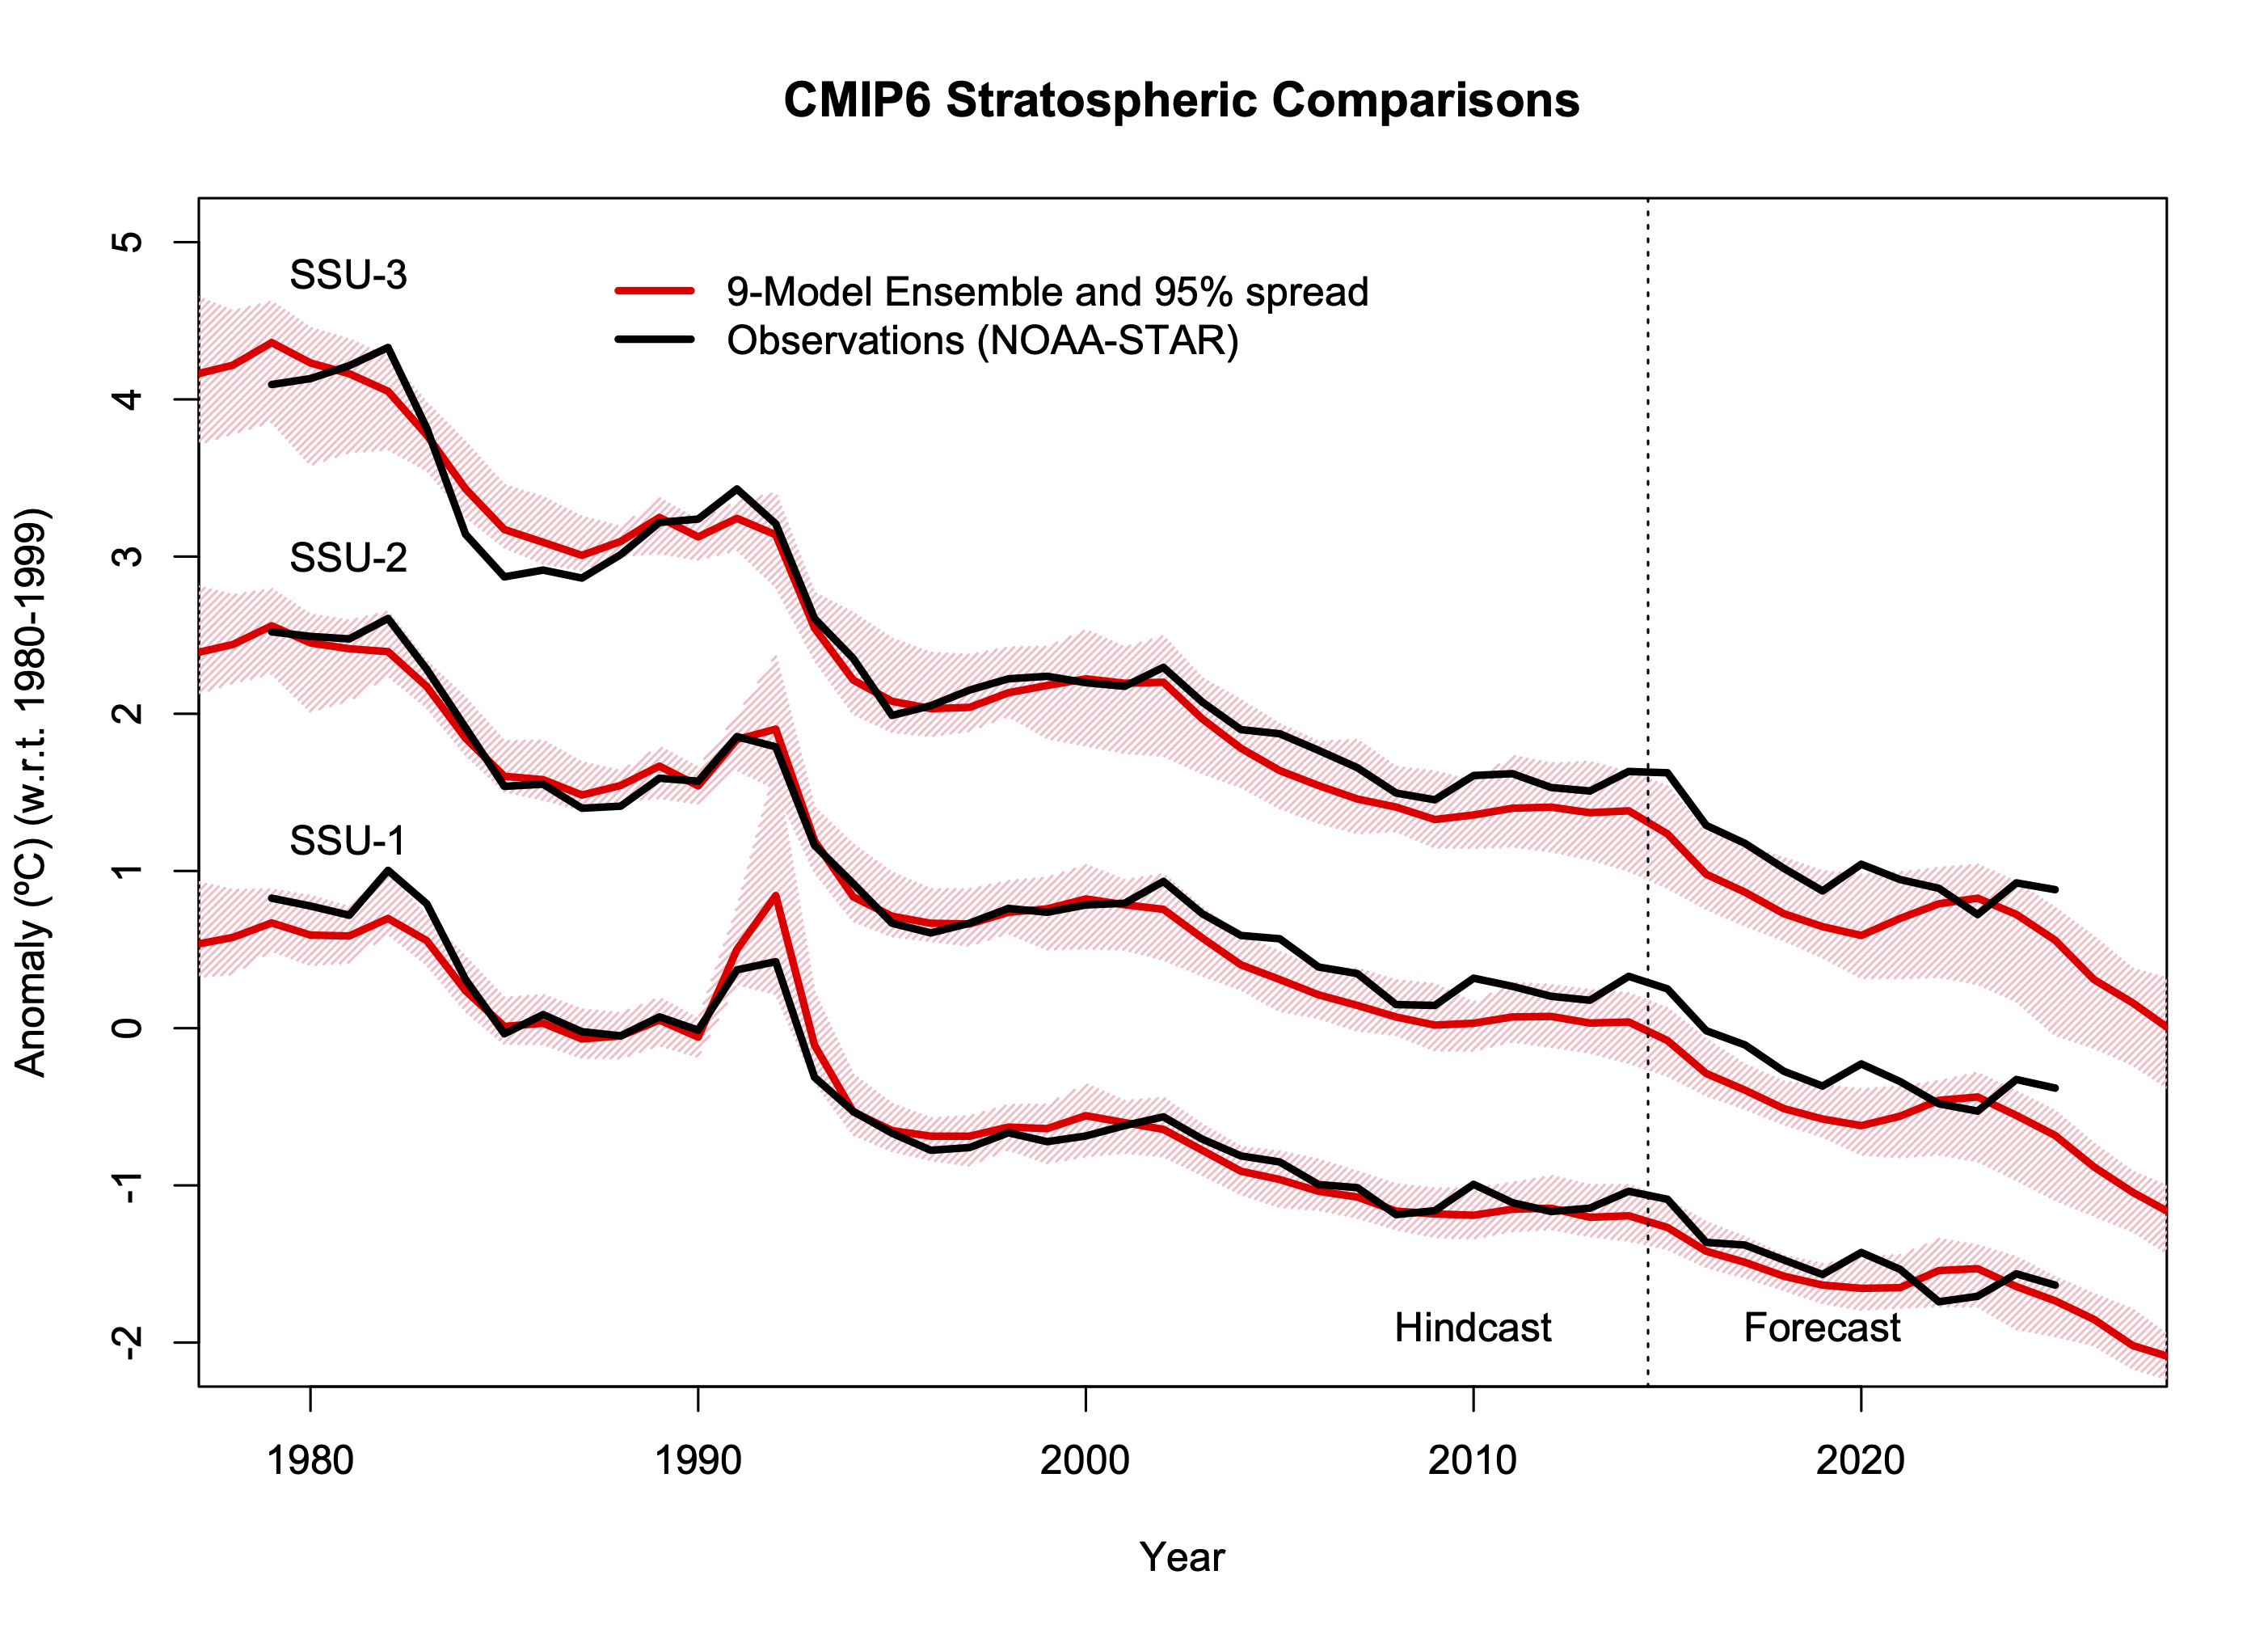
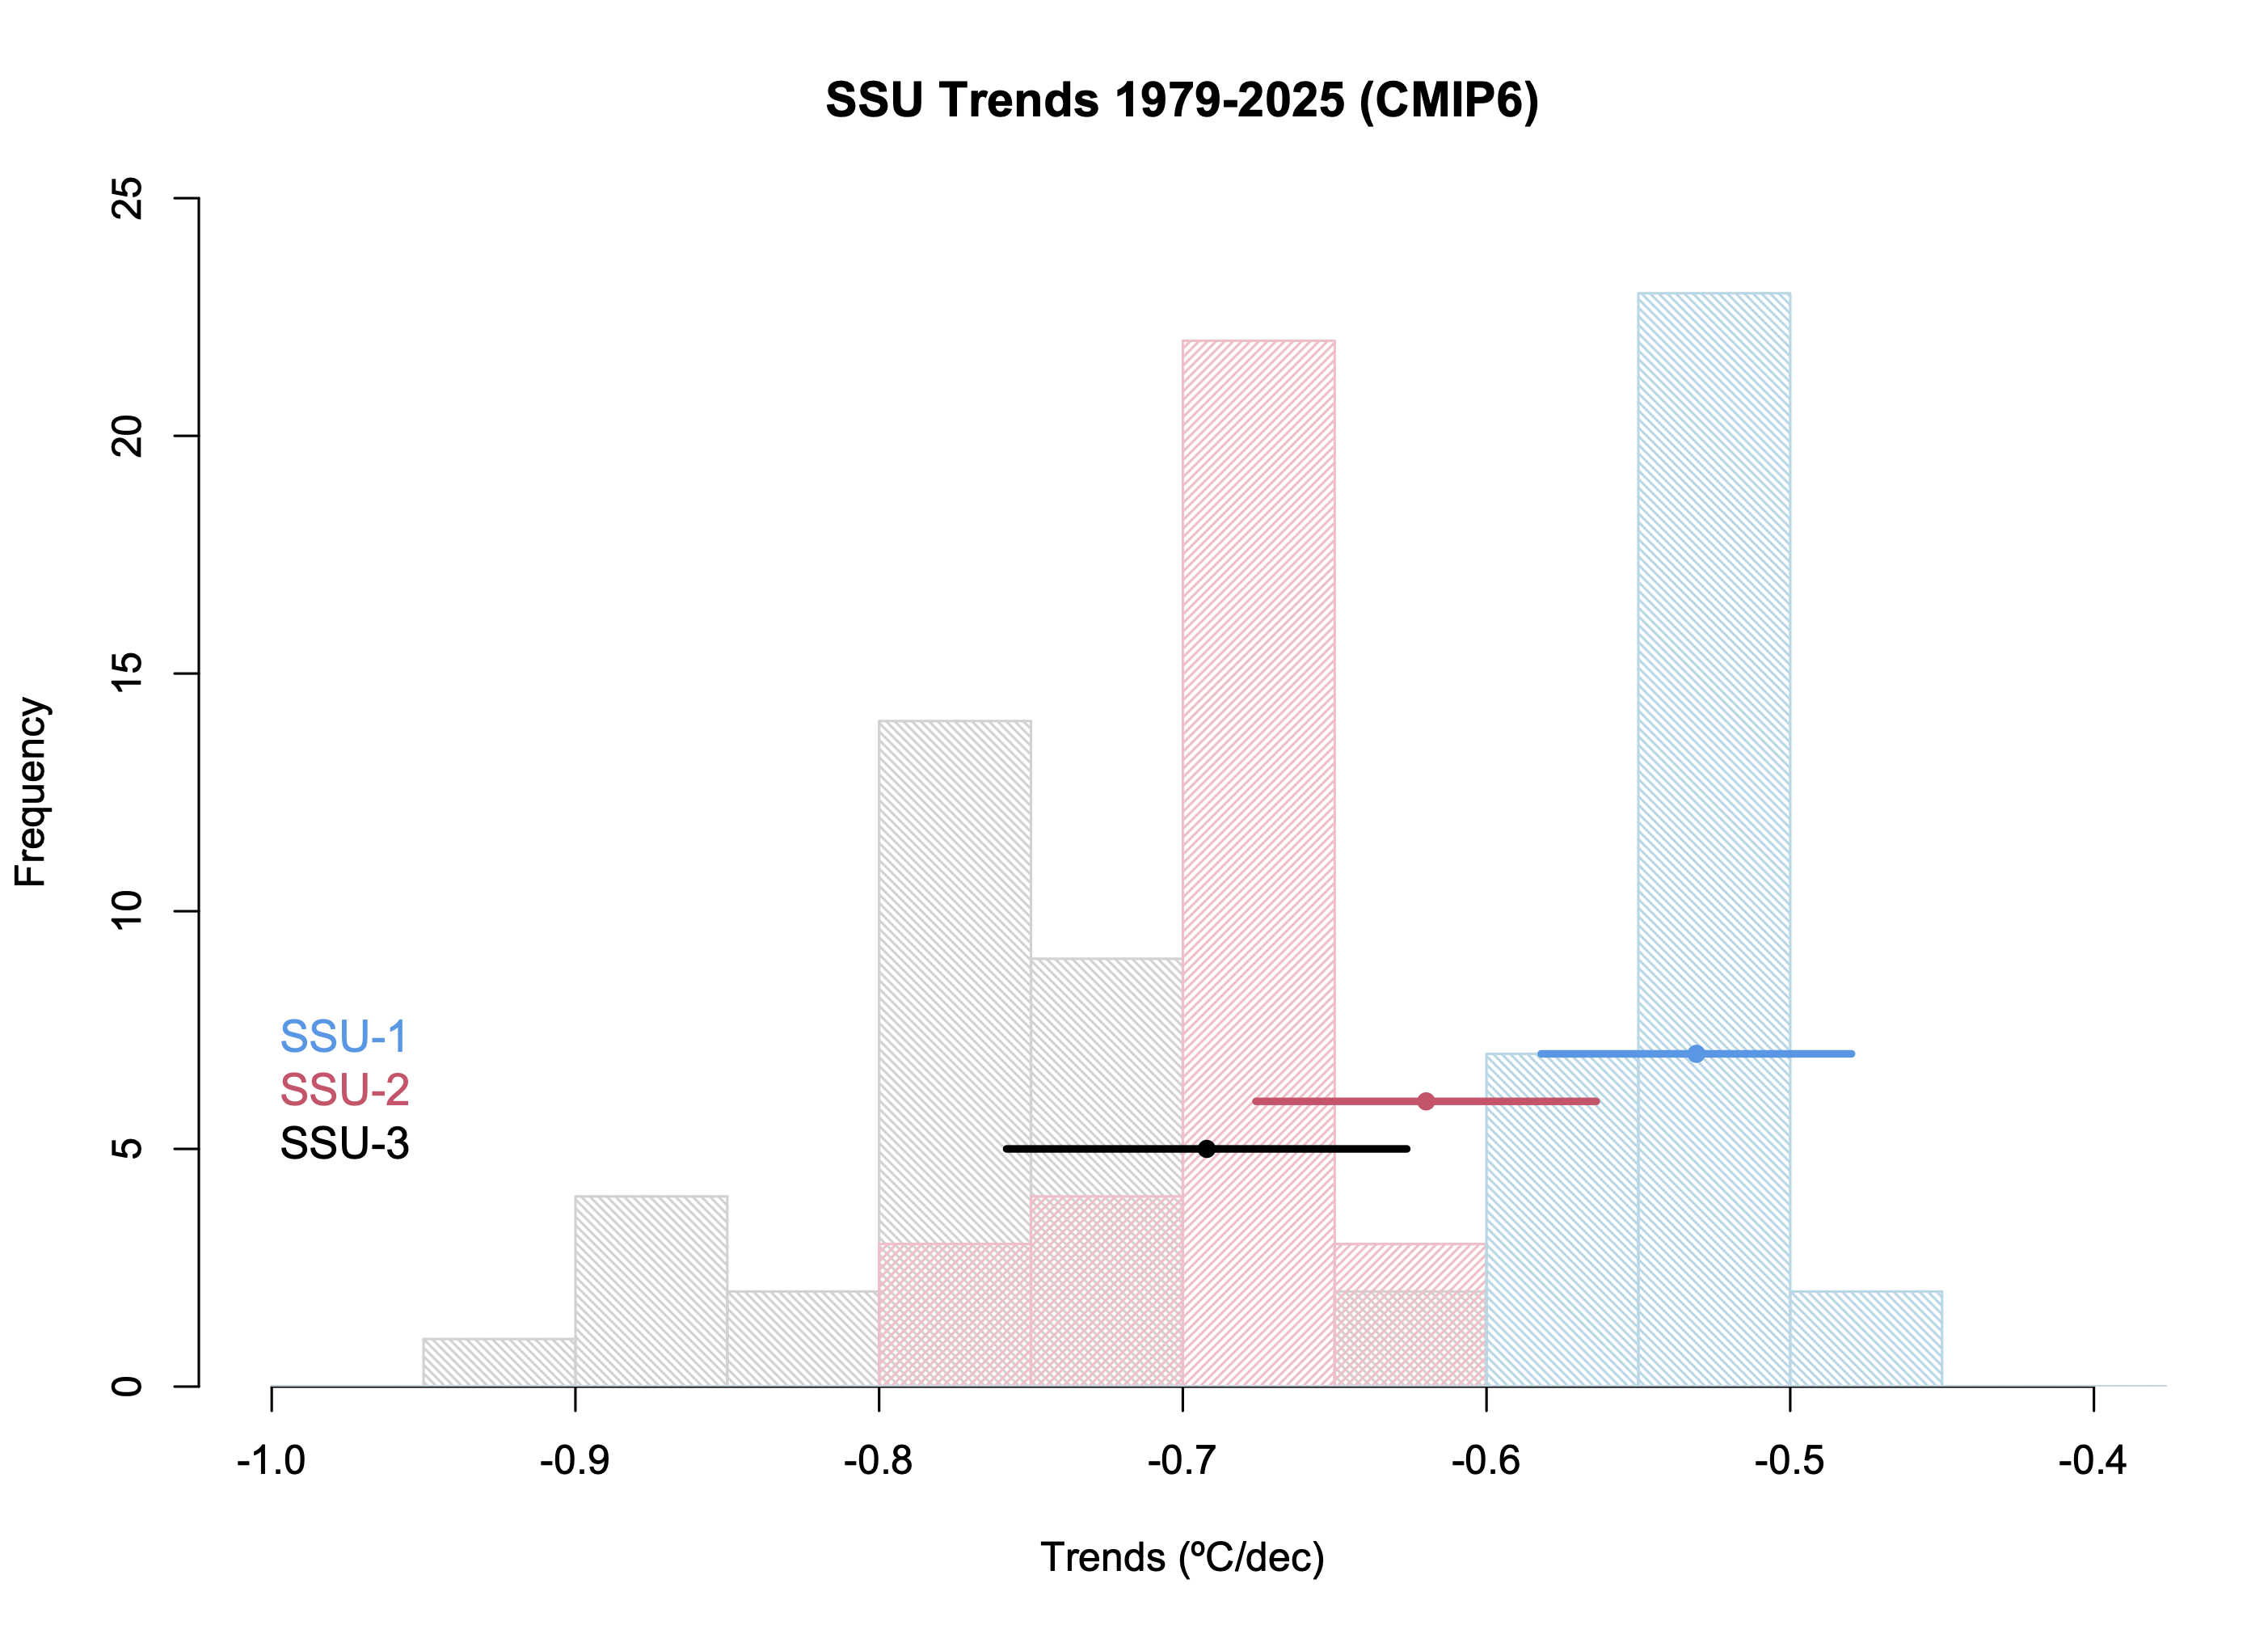
Original discussion 5/21/23. Global mean SSU trends for three channels (NOAA-STAR v3.0) compared to a 9-member subset of the CMIP6 archive. Last updated 23 Jan 2026.
Global SST changes
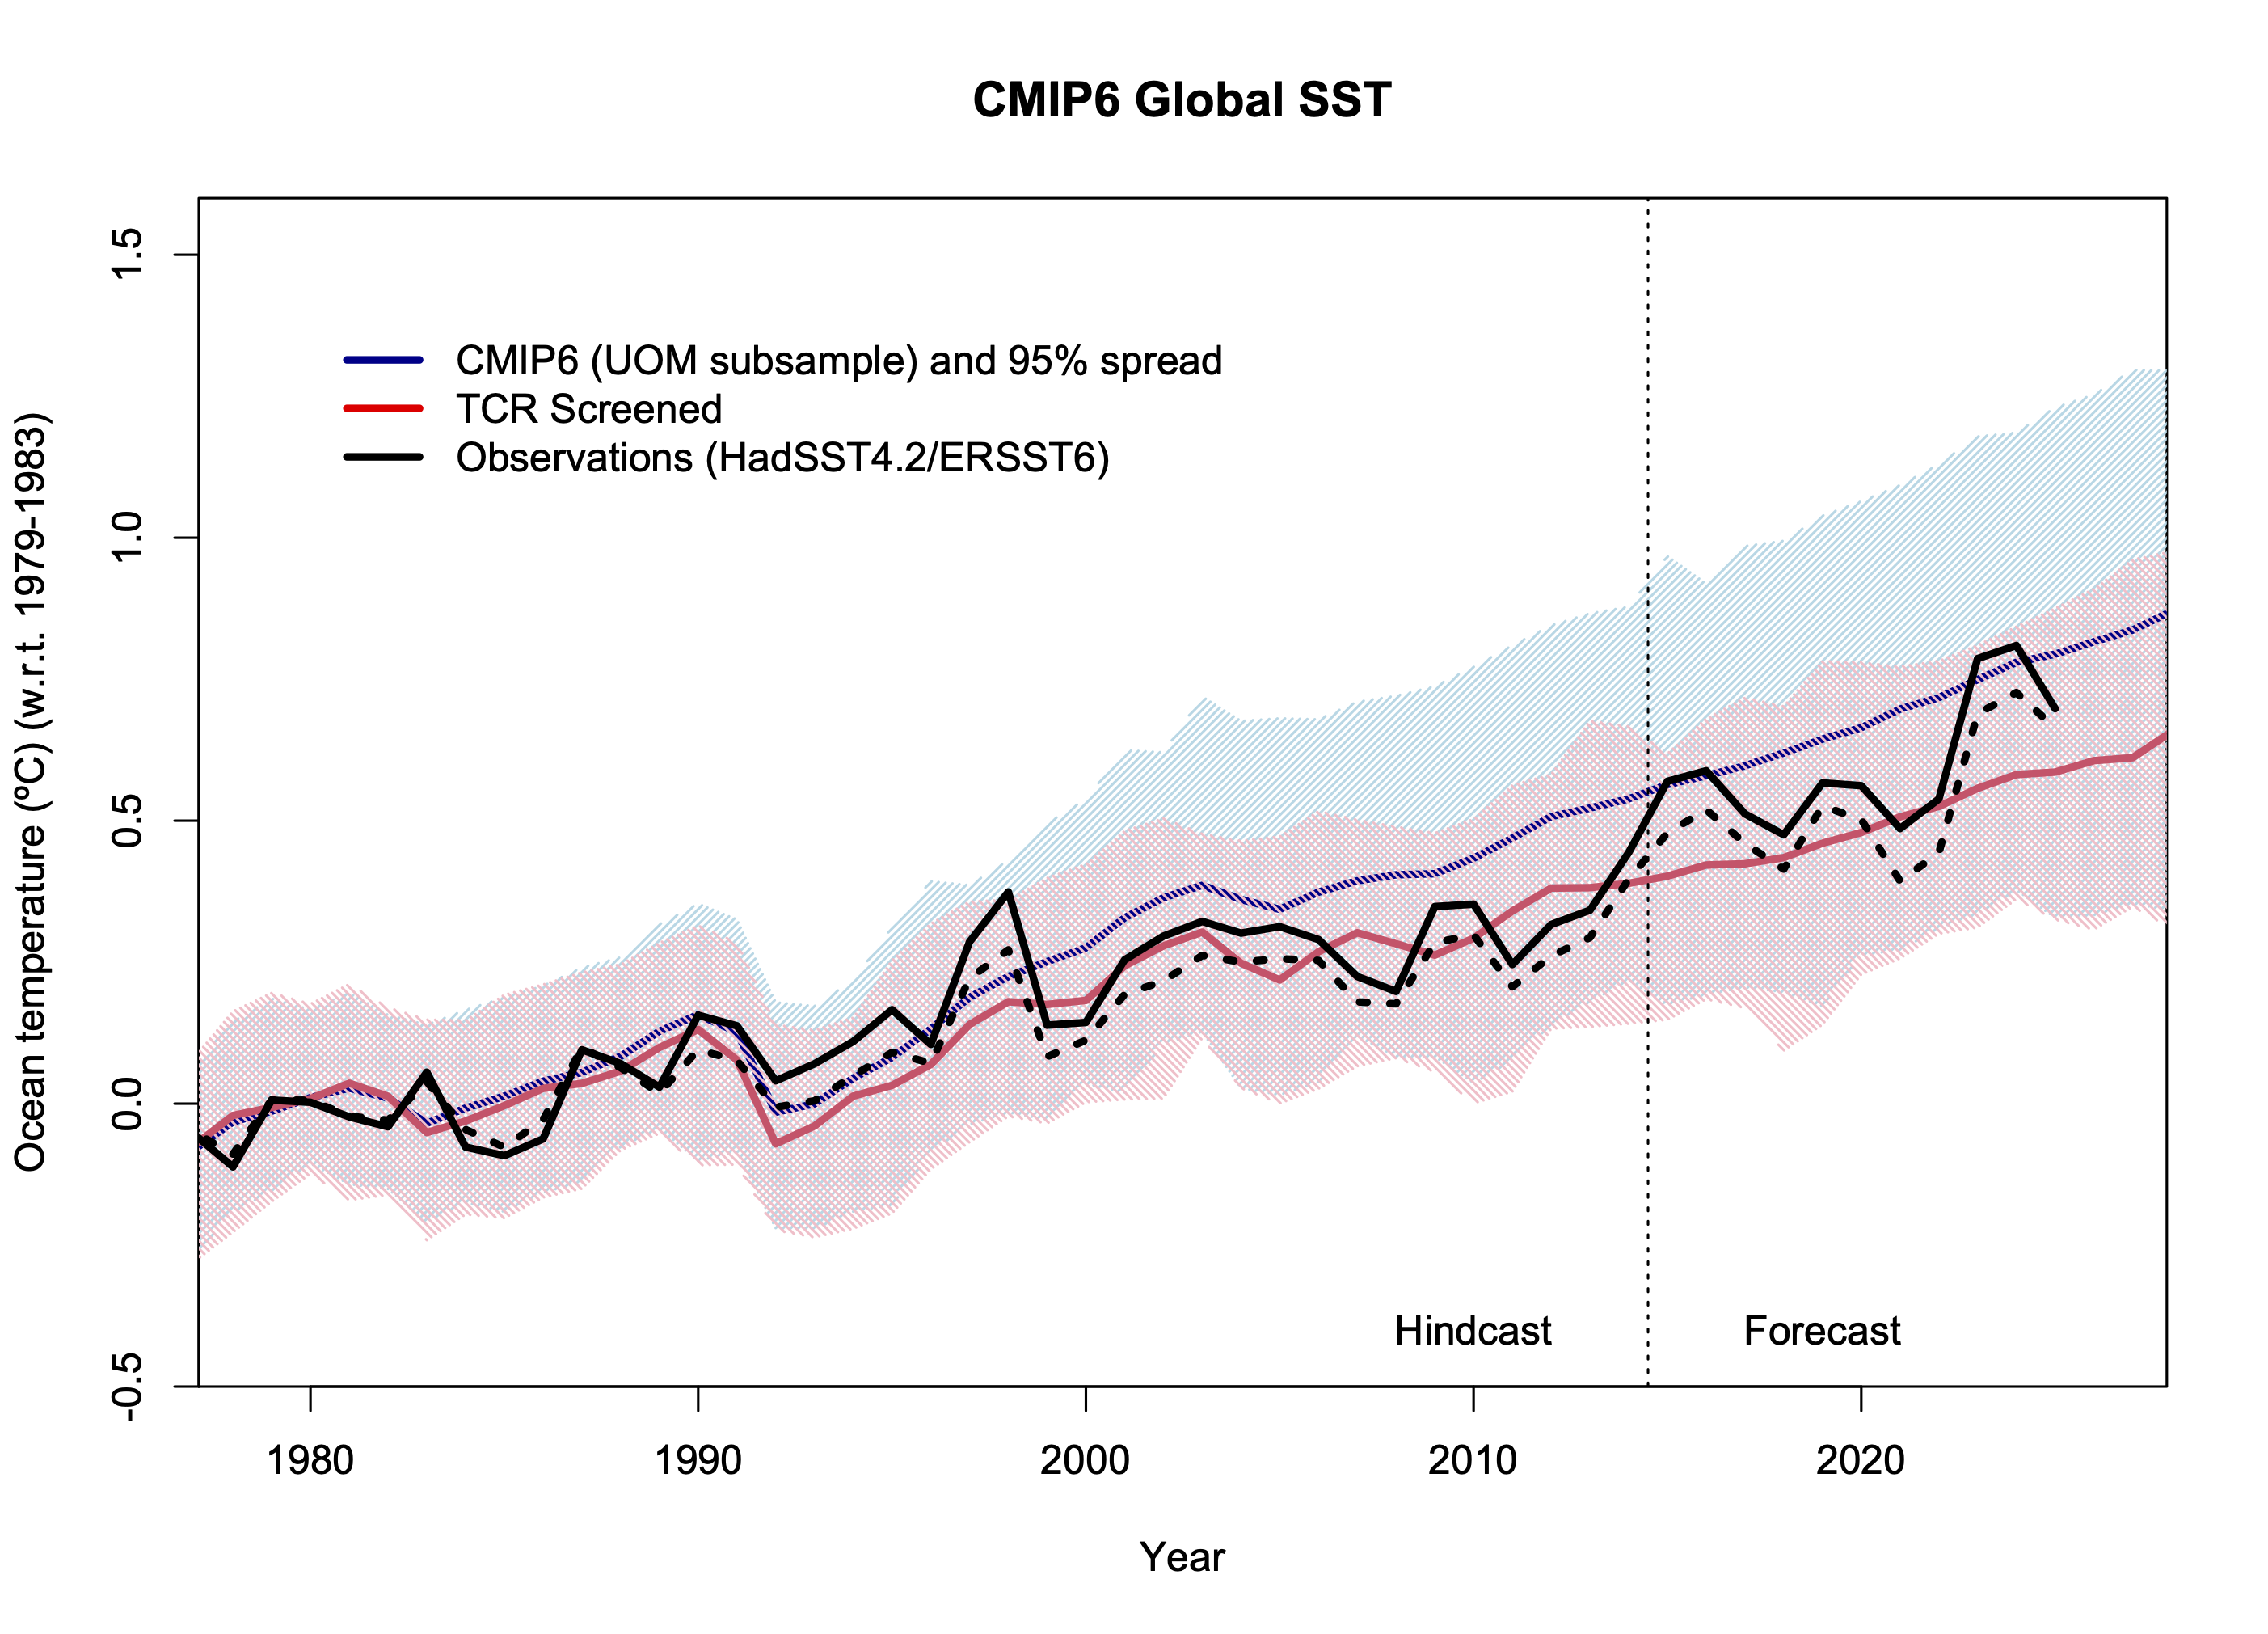
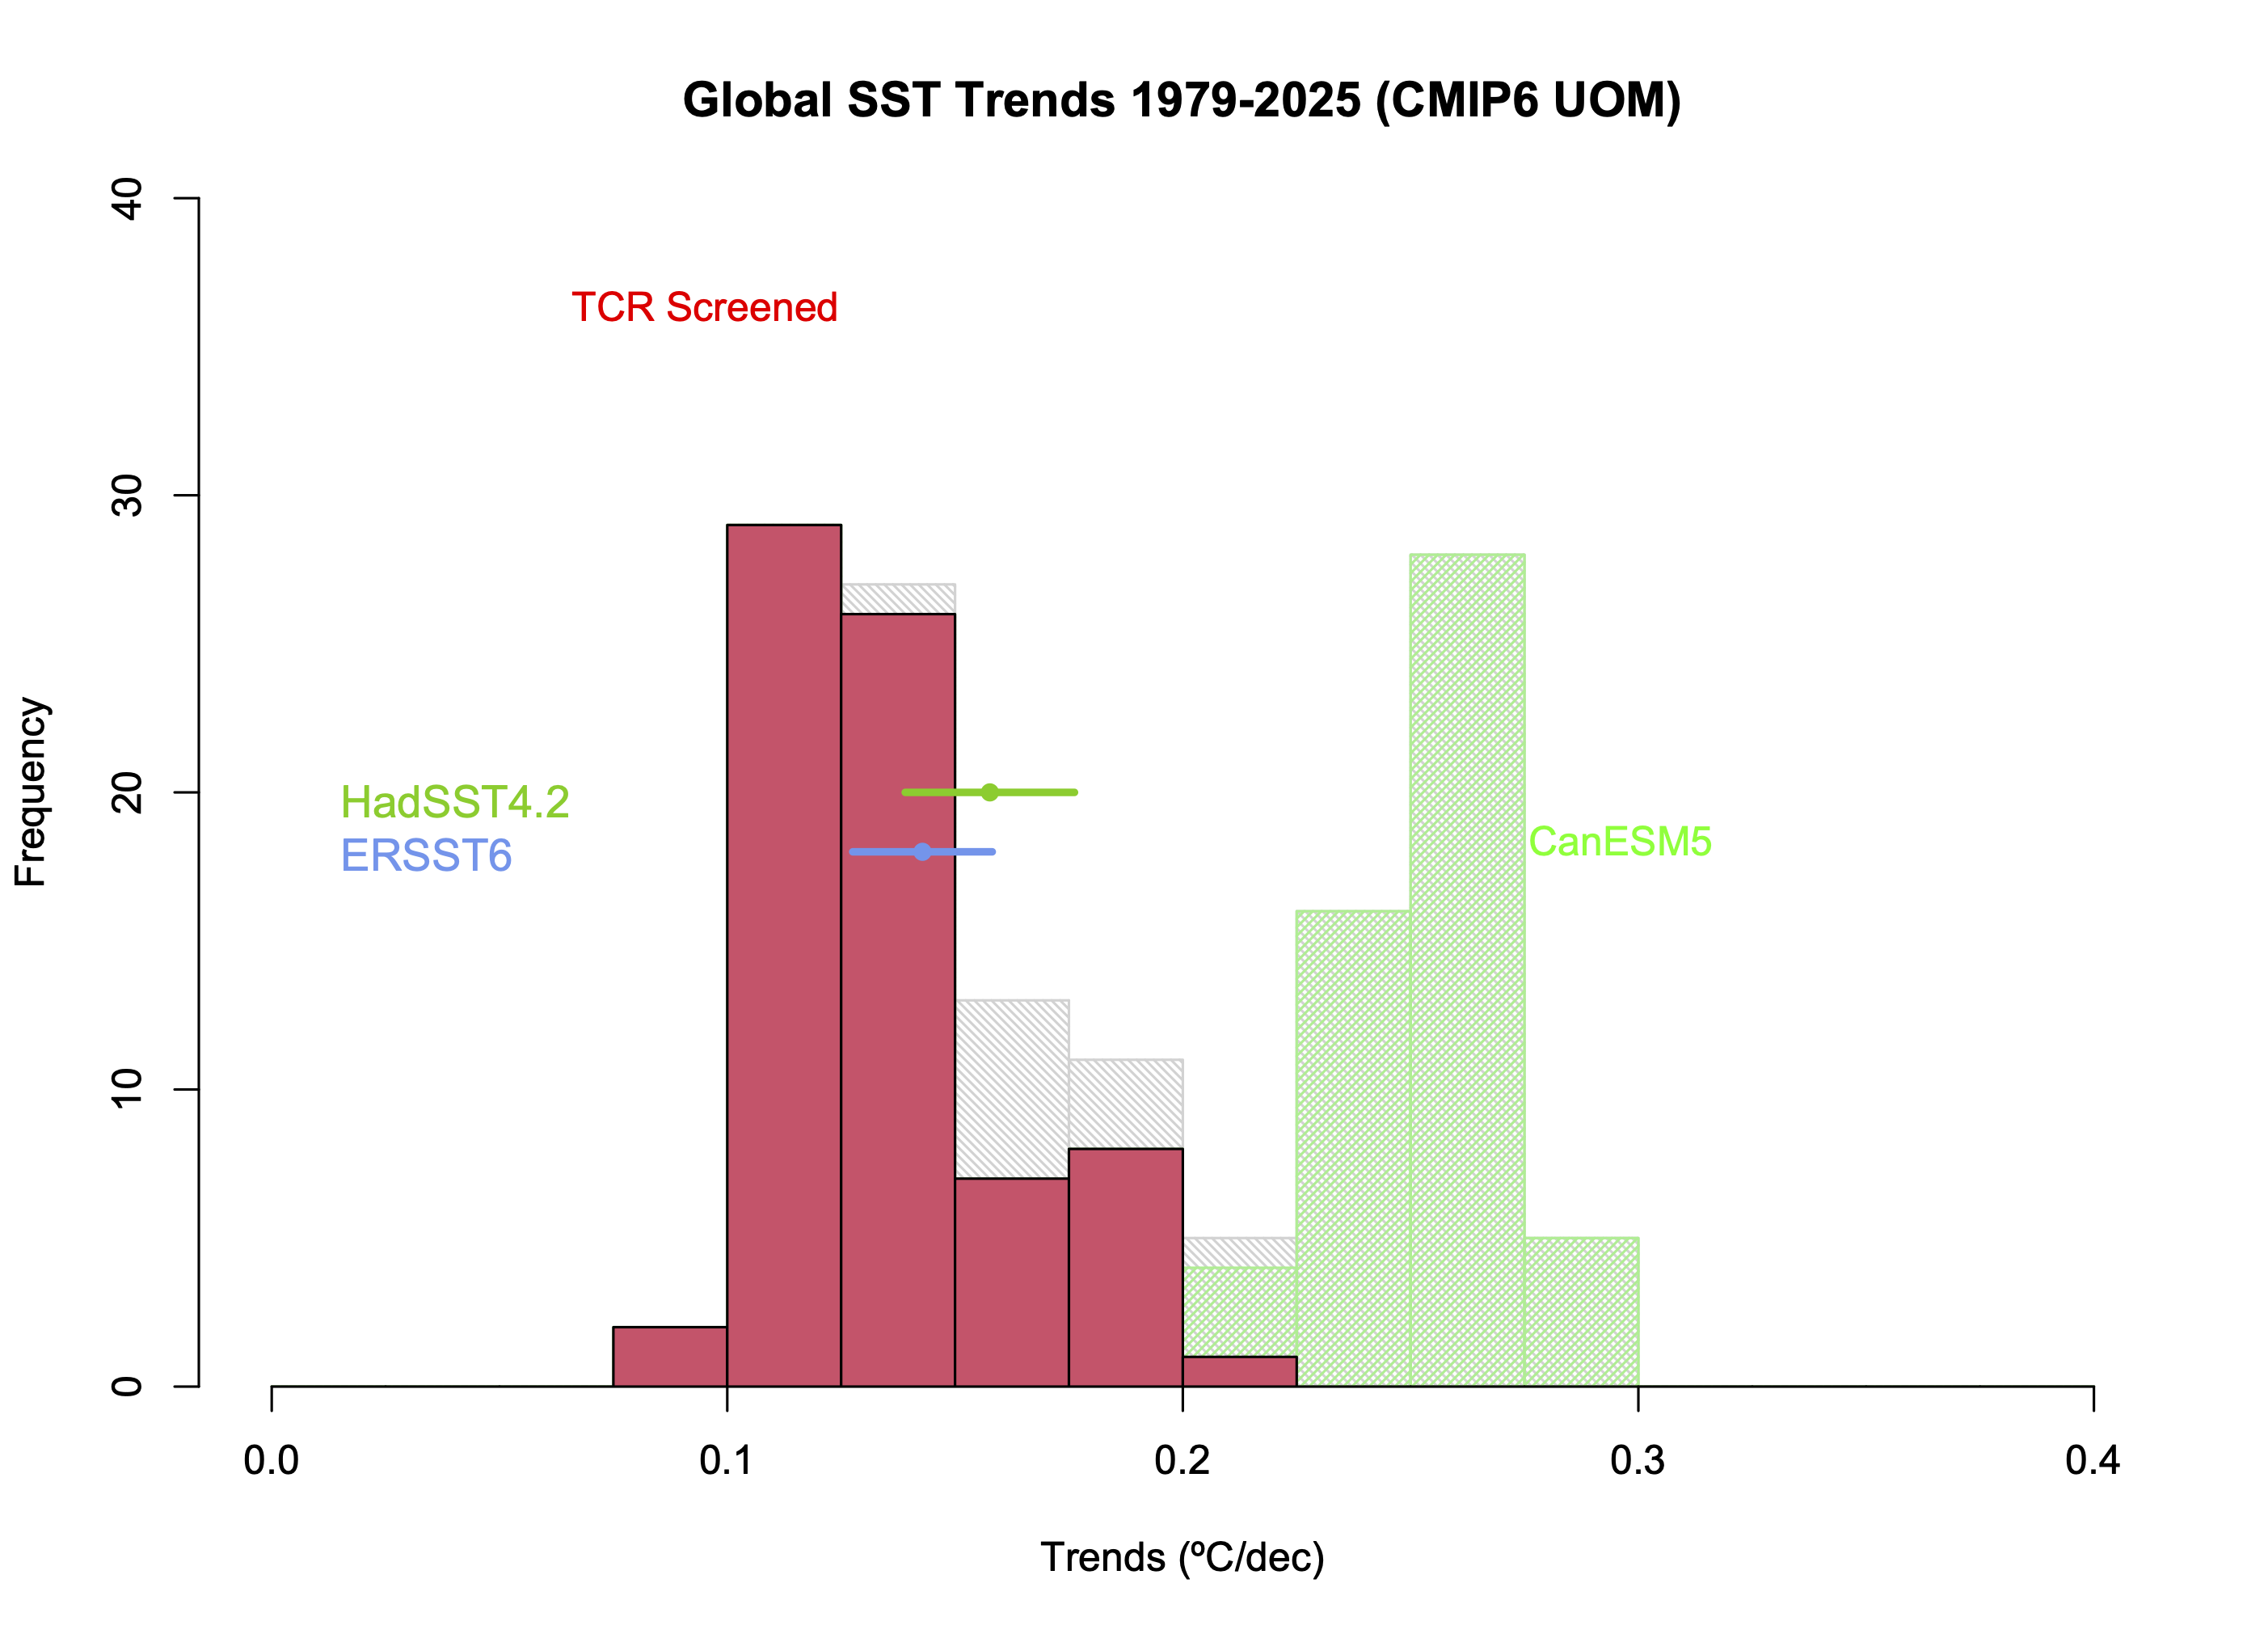
Original discussion 3/19/2023.Global mean SST trends in CMIP6 compared to HadSST4.2 and ERSST6. As above, models are screened using the TCR criterion. The models are a 15-model subset from the U. Melbourne collation. Last updated 27 Jan 2026.
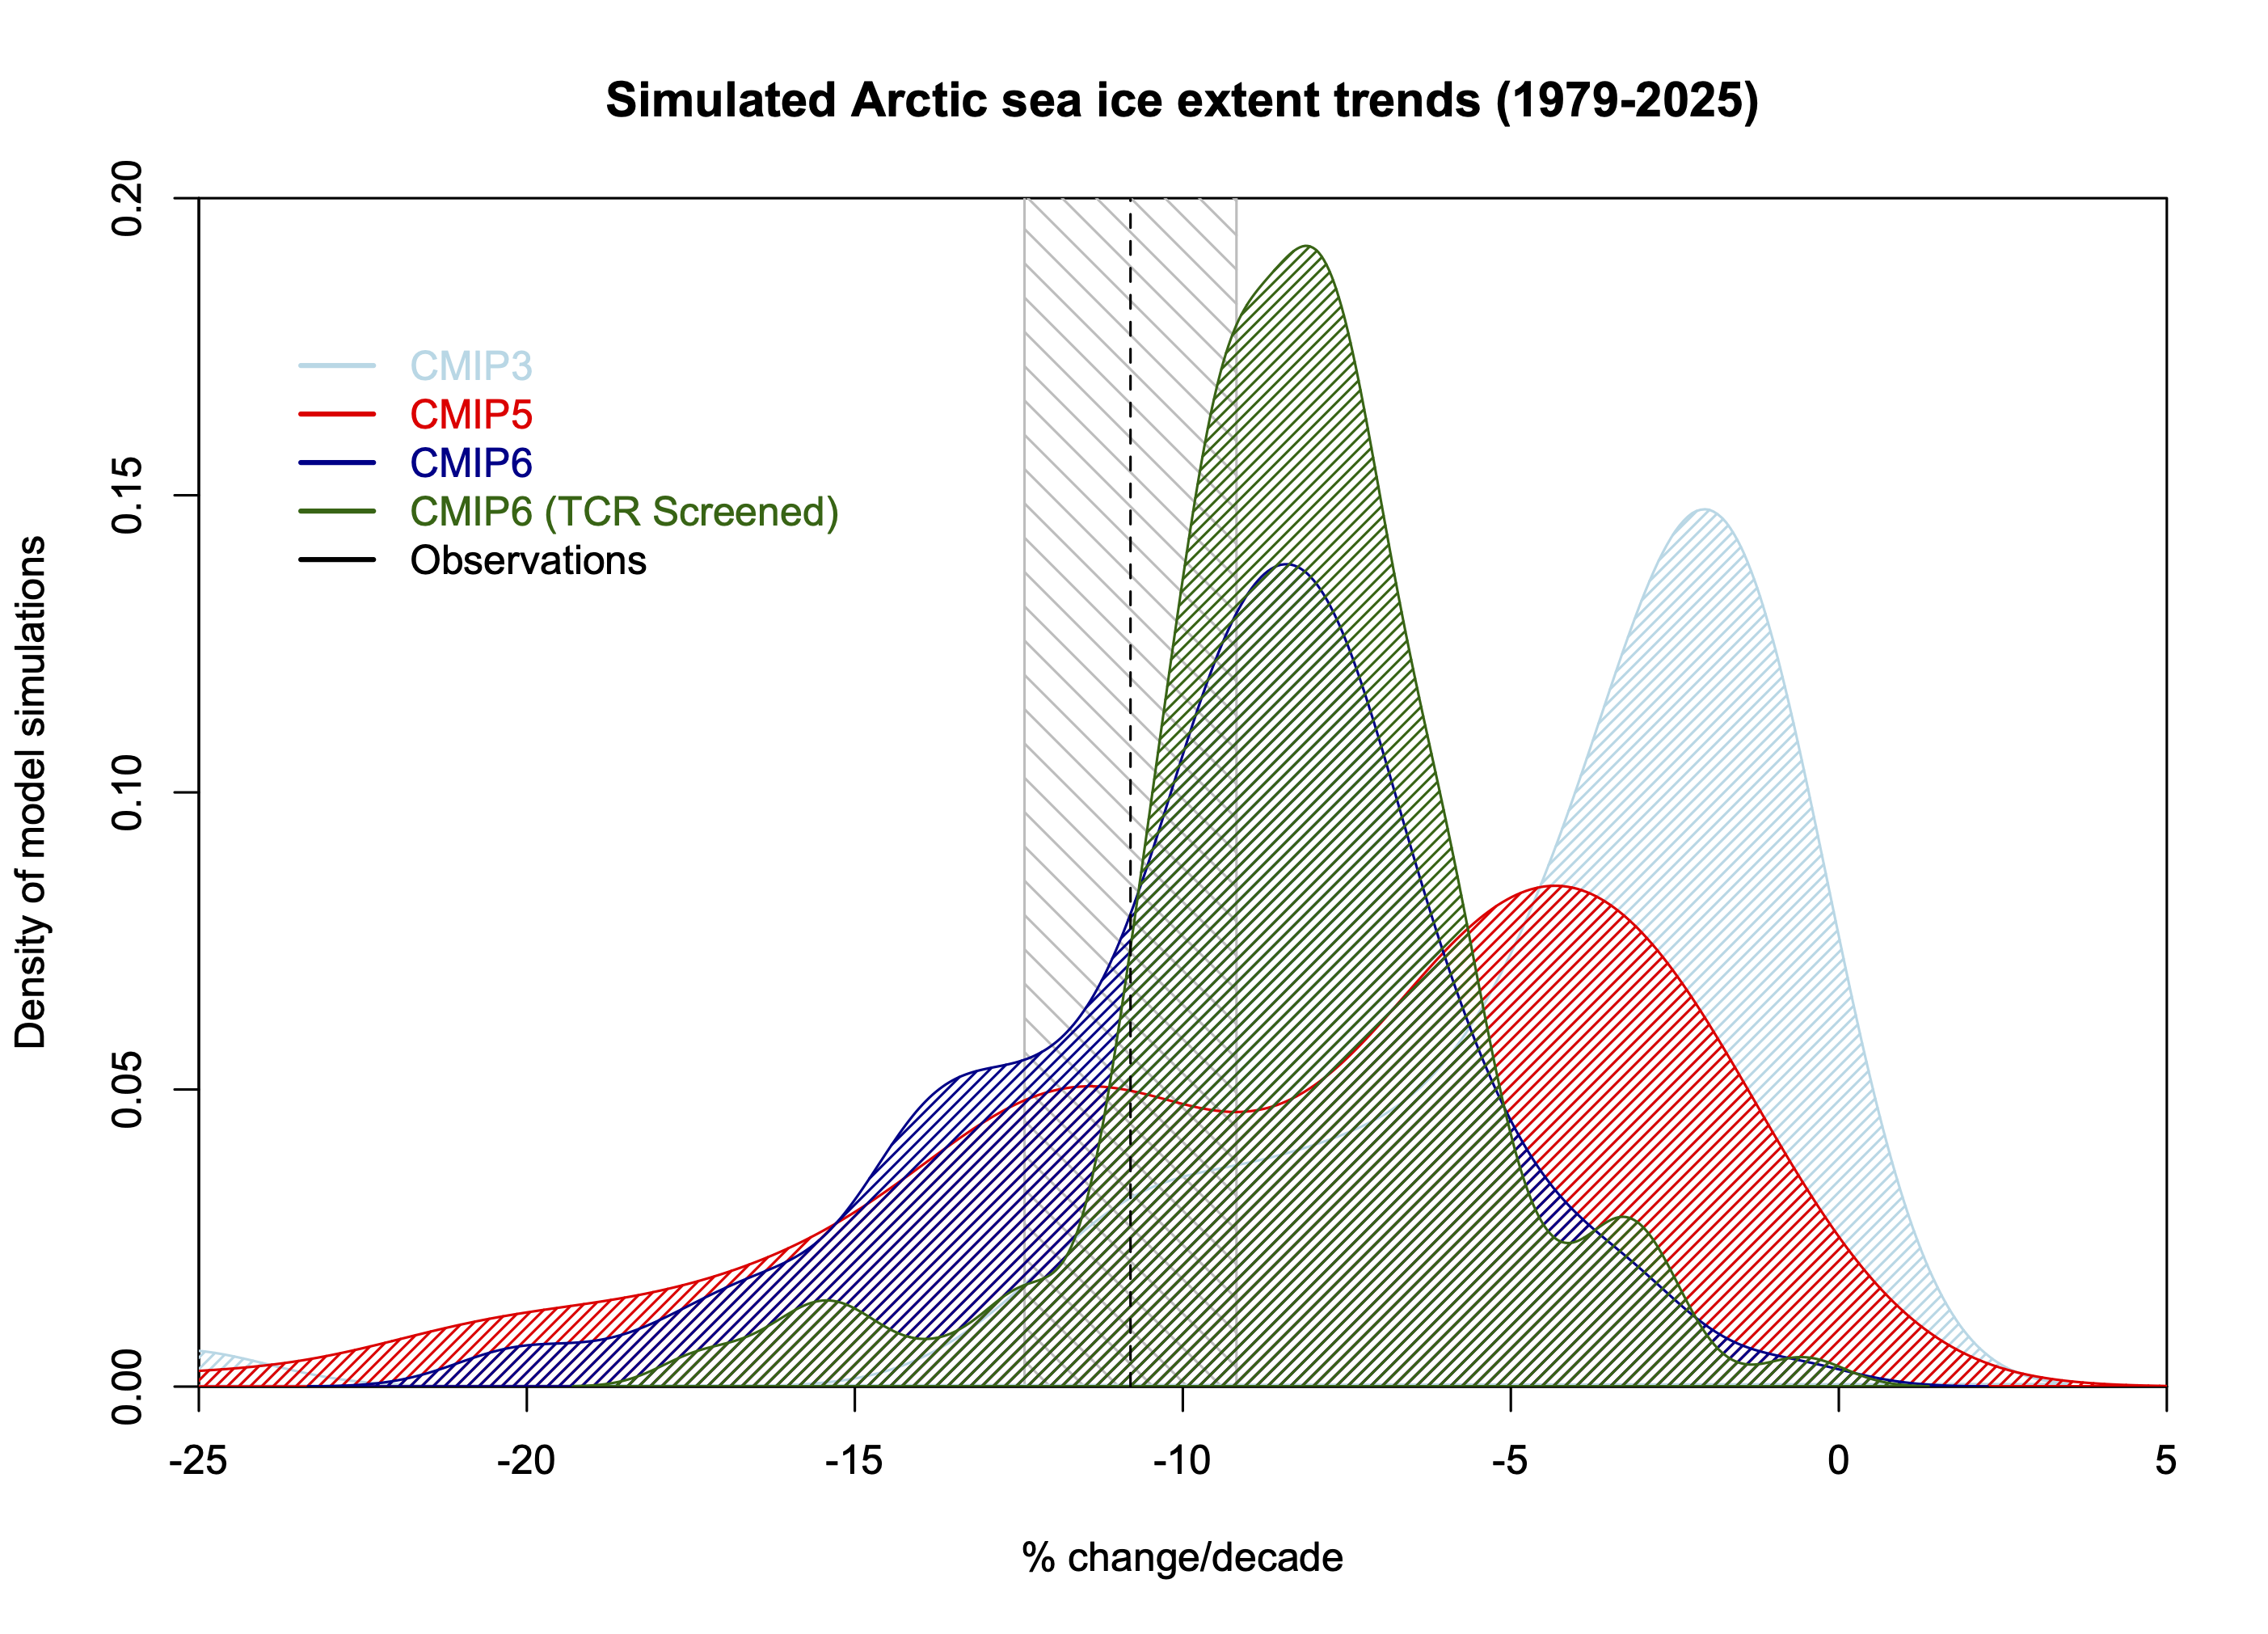
Arctic Sea Ice Extent/Area
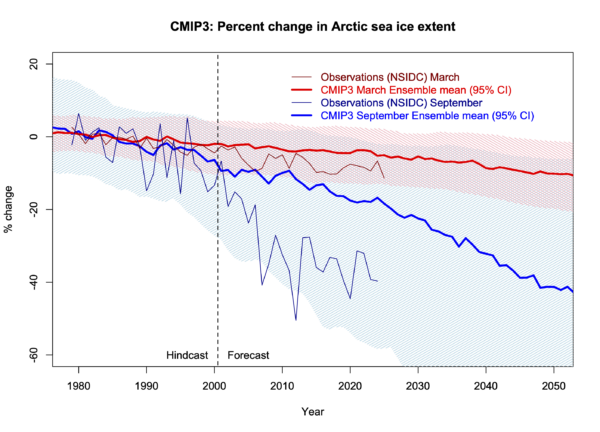
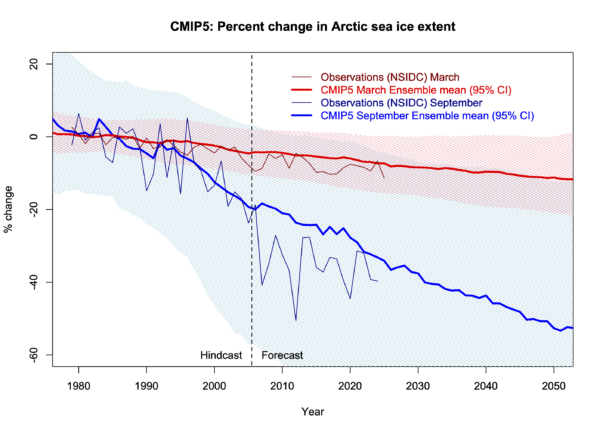
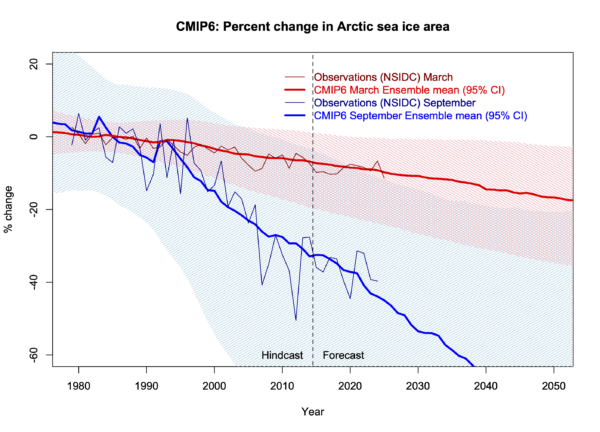
Original discussion 5/31/2025. Arctic sea ice timeseries (percent change from 1979-1988) from CMIP3, CMIP5 (extent) and CMIP6 (area) compared to NSIDC observations (updated to v4). Last updated 22 Jan 2026.
References
- Z. Hausfather, H.F. Drake, T. Abbott, and G.A. Schmidt, "Evaluating the Performance of Past Climate Model Projections", Geophysical Research Letters, vol. 47, 2020. http://dx.doi.org/10.1029/2019GL085378
- J. Hansen, D. Johnson, A. Lacis, S. Lebedeff, P. Lee, D. Rind, and G. Russell, "Climate Impact of Increasing Atmospheric Carbon Dioxide", Science, vol. 213, pp. 957-966, 1981. http://dx.doi.org/10.1126/science.213.4511.957
- J. Hansen, I. Fung, A. Lacis, D. Rind, S. Lebedeff, R. Ruedy, G. Russell, and P. Stone, "Global climate changes as forecast by Goddard Institute for Space Studies three‐dimensional model", Journal of Geophysical Research: Atmospheres, vol. 93, pp. 9341-9364, 1988. http://dx.doi.org/10.1029/JD093iD08p09341
- G.A. Schmidt, D.T. Shindell, and K. Tsigaridis, "Reconciling warming trends", Nature Geoscience, vol. 7, pp. 158-160, 2014. http://dx.doi.org/10.1038/ngeo2105
- K. Cowtan, Z. Hausfather, E. Hawkins, P. Jacobs, M.E. Mann, S.K. Miller, B.A. Steinman, M.B. Stolpe, and R.G. Way, "Robust comparison of climate models with observations using blended land air and ocean sea surface temperatures", Geophysical Research Letters, vol. 42, pp. 6526-6534, 2015. http://dx.doi.org/10.1002/2015GL064888
- Z. Hausfather, K. Marvel, G.A. Schmidt, J.W. Nielsen-Gammon, and M. Zelinka, "Climate simulations: recognize the ‘hot model’ problem", Nature, vol. 605, pp. 26-29, 2022. http://dx.doi.org/10.1038/d41586-022-01192-2
- S. Po-Chedley, J.T. Fasullo, N. Siler, Z.M. Labe, E.A. Barnes, C.J.W. Bonfils, and B.D. Santer, "Internal variability and forcing influence model–satellite differences in the rate of tropical tropospheric warming", Proceedings of the National Academy of Sciences, vol. 119, 2022. http://dx.doi.org/10.1073/pnas.2209431119