As predicted in 1967 by Manabe and Wetherald, the stratosphere has been cooling.
A new paper by Ben Santer and colleagues has appeared in PNAS where they extend their previous work on the detection and attribution of anthropogenic climate change to include the upper stratosphere, using observations from the Stratospheric Sounding Units (SSUs) (and their successors, the AMSU instruments) that have flown since 1979.
So SSU me
Like MSU trends, these records reflected a weighted average of atmospheric temperatures, and the three SSU channels progressively weight higher levels in the stratosphere, roughly centered on 30km, 40km and 45km above the surface but with quite a bit of overlap. Until relatively recently, there were some discrepancies in what the climate trends were from these instruments because of the usual issues with remote sensing – instrument trends, orbital shifts, inter-satellite calibration etc. Thompson et al. (2012) described the issues as ‘mysterious’, but efforts to better correct the record for non-climatic effects soon bore fruit, and the ‘mystery’ became history (Maycock et al., 2018). We are using the NOAA-STAR version 3.0 of these products (Zou et al., 2014).
Since then, these records have been used to assess the solar contributions to stratospheric temperatures and as a standard part of the GISS Model evaluation (most recently in Casas et al., 2023) and also in the “Climate Drivers” animation. The Santer et al contribution is the first time I’ve seen these diagnostics calculated for the CMIP6 models (or at least a subset of them), and so this is a great opportunity to add the SSU trends to our catalogue of model-observation comparisons that can be maintained going forward.
A couple of things to note before we get to that analysis though. First, the internal variability of the global mean values of these records is much smaller than for the tropospheric MSU trends, and that means that the (forced) signal to noise is much higher. The dominant factors are changes in CO2 (a cooling), ozone depletion (a cooling), warming from big volcanoes, and oscillations related to the solar cycle.
But why is the stratosphere increasingly chill?
For some reason, this has been poorly communicated among otherwise knowledgeable folk, and our early efforts to explain this were not very good (this featured in the only RealClimate post we ever basically retracted – though you can find it if you care to look!). Part of the confusion related to the role of the ozone layer in the lower stratosphere, but it turns out that is just a distraction, since the cooling due to increasing CO2 is seen everywhere above the tropopause – not just in regions with lots of ozone.
The basic concept is easy to grasp though. Concentrations of CO2 are increasing throughout the atmosphere and while we might think of greenhouse gases as absorbers of infra-red radiation from the surface, they are also emitters of IR radiation, so whether they warm or cool a region of the atmosphere is due to whether the net change (increased absorption vs increased emission) is positive or negative. The upper atmosphere is different from the troposphere in that pressure is much less, and it’s very dry. That means the greenhouse substances are basically just CO2 and ozone, and they absorb in quite different parts of the spectrum. In the band of radiation where CO2 absorbs a lot (~15 $\mu$m), increasing CO2 levels in the troposphere make it ever harder for those photons to get to the stratosphere or above. The upward IR comes increasingly from the water vapour or cloud bands, which because the upper atmosphere is so dry, does not get absorbed significantly on it’s way out.
Looking down from above, our extra stratospheric CO2 molecules then see less radiation to absorb coming up, but they are totally happy emitting more – half of which goes up into space. So the net effect is less absorption and more emittence, and thus they give a cooling. The effect is larger the further up you go.
How well do the models do?
As in previous comparisons, I’ll plot the envelope of the CMIP6 ensemble, in this case there are 32 individual runs from 9 distinct models. Unlike in the MSU or SST comparisons, there is no significant variation in the trends as a function of climate sensitivity, and so there is no need to plot the screened models separately. [This might be surprising, but remember that the variation in climate sensitivity is dominated by cloud feedbacks which are not very important in the stratosphere].
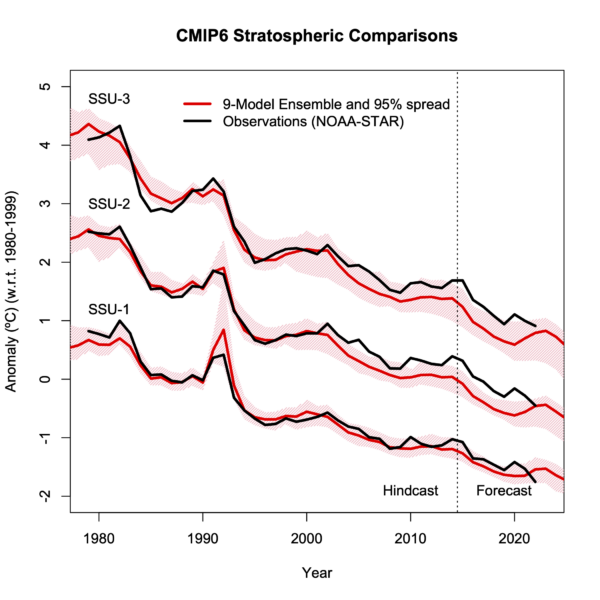
The two big warming events in the earlier part of the record are the impacts of the El Chichon and Mt Pinatubo eruptions (and you’ll note quite a wide spread in magnitude of the latter event) and if you squint, you can see the solar cycle (maxima around 1981, 1991, 2002, 2014). The trends are dominated by the CO2 changes (more so as you move higher), but there is also a component from ozone depletion. As mentioned above, the internal variability and structural uncertainty in the model ensemble is smaller than in the troposphere, and so mismatches between the models and the observations are likely due to small issues in the forcings (particularly ozone, but perhaps also small volcanoes). It’s possible that the quality of the stratospheric circulation and it’s sensitivity to warming may be important. However, the discrepancies in the trends are small.
References
- B.D. Santer, S. Po-Chedley, L. Zhao, C. Zou, Q. Fu, S. Solomon, D.W.J. Thompson, C. Mears, and K.E. Taylor, "Exceptional stratospheric contribution to human fingerprints on atmospheric temperature", Proceedings of the National Academy of Sciences, vol. 120, 2023. http://dx.doi.org/10.1073/pnas.2300758120
- D.W.J. Thompson, D.J. Seidel, W.J. Randel, C. Zou, A.H. Butler, C. Mears, A. Osso, C. Long, and R. Lin, "The mystery of recent stratospheric temperature trends", Nature, vol. 491, pp. 692-697, 2012. http://dx.doi.org/10.1038/nature11579
- A.C. Maycock, W.J. Randel, A.K. Steiner, A.Y. Karpechko, J. Christy, R. Saunders, D.W.J. Thompson, C. Zou, A. Chrysanthou, N. Luke Abraham, H. Akiyoshi, A.T. Archibald, N. Butchart, M. Chipperfield, M. Dameris, M. Deushi, S. Dhomse, G. Di Genova, P. Jöckel, D.E. Kinnison, O. Kirner, F. Ladstädter, M. Michou, O. Morgenstern, F. O'Connor, L. Oman, G. Pitari, D.A. Plummer, L.E. Revell, E. Rozanov, A. Stenke, D. Visioni, Y. Yamashita, and G. Zeng, "Revisiting the Mystery of Recent Stratospheric Temperature Trends", Geophysical Research Letters, vol. 45, pp. 9919-9933, 2018. http://dx.doi.org/10.1029/2018gl078035
- C. Zou, H. Qian, W. Wang, L. Wang, and C. Long, "Recalibration and merging of SSU observations for stratospheric temperature trend studies", Journal of Geophysical Research: Atmospheres, vol. 119, 2014. http://dx.doi.org/10.1002/2014JD021603
- M.C. Casas, G.A. Schmidt, R.L. Miller, C. Orbe, K. Tsigaridis, L.S. Nazarenko, S.E. Bauer, and D.T. Shindell, "Understanding Model‐Observation Discrepancies in Satellite Retrievals of Atmospheric Temperature Using GISS ModelE", Journal of Geophysical Research: Atmospheres, vol. 128, 2022. http://dx.doi.org/10.1029/2022JD037523
My phones google account notified me of this a couple of days ago: “The Upper Atmosphere Is Cooling, Prompting New Climate Concerns. A new study reaffirming that global climate change is human-made also found the upper atmosphere is cooling dramatically because of rising CO2 levels. Scientists are worried about the effect this cooling could have on orbiting satellites, the ozone layer, and Earth’s weather.” (Yale climate connections)
https://e360.yale.edu/features/climate-change-upper-atmosphere-cooling#:~:text=A%20new%20study%20reaffirming%20that,ozone%20layer%2C%20and%20Earth's%20weather.
[Response: I don’t know why this would prompt new climate concerns? As I said this was predicted more than 50 years ago, and has been validated many times before now. The impact on low earth orbit spacecraft is that density is decreasing and so there is less friction and so satellites would be expected to last longer on orbit. – gavin]
Fred Pearce’s article uses an old rhetorical trick by saying things like ‘scientists are worried…’ which many might think implies that ALL scientists are worried. Ben Santer himself is quoted as being ”worried’ by his results but the implication in zhe article is that Santer has new worries from these trsults that he didn’t have before. As Gavin says, these stratospheric effects have been predicted to occur for 50 years
I think the tone of Pearce’s article is at least misleading, verging on alarmist – or at least that is how it will be represented by the denialist faction but, on the other hand, it will be eagerly promulgated by alarmist activists
Sorry about the two typos – fat fingers on a mobile strike again…
Nick Palmer.
I believe we have a serious climate change problem, but I’m not some sort of alarmist activist out on the extreme fringes of the global warming issue.
I posted the article only because it seemed relevant, arrived on my phone just recently, and it raised some issues not mentioned in the article. I’m struggling to see what’s wrong with that.
The article said “Scientists are worried about the effect this cooling could have on orbiting satellites, the ozone layer, and Earth’s weather. and went into some detail on these things” I was hoping for some feedback on whether the three claims were valid.
Should the effects regarding the thinning of the ozone layer in the northernmost parts of the northern hemisphere really be of no concern? Maybe not to people living in the USA, and then it is of course without any relevance here on realclimate… ;-)
Is realclimate silently becoming a site for the people Michael Mann rightly calls *the lukewarmers*, and/or *are we here looking at some kind of strategic planning for survival under the rule of Musk/DeSantis/Putin/Xi&Co. and even more augmented liberalist-totalitarian ignorance and mediocrazy?* Cfr. this https://www.nature.com/articles/s41467-021-24089-6 .
More generally most people also here seems to be rather completely ignoring the main problem with economic growth, discussed here: https://m.youtube.com/watch?v=sI1C9DyIi_8&pp=ygURYWxiZXJ0IGEgYmFydGxldHQ%3D and the problems with what often rather misleadingly is called “our society”, discussed by writers George Orwell, Joseph Conrad (ex. the novel “Typhoon”…), Karel Capek, Victor Serge, August Strindberg and Aldous Huxley, among others.
After all the instigator of the reformed trumpist/fascist coup attempt of january sixth 2021 was never arrested and put before a jury, as he surely and immidiatly would have been in a democratic system. But not so in an oli-/oiligarchy for sure. More fumbling and pre-senile joking-mumuring by mr. Biden and his rich buddies surely won’t make up for that grave historical mistake, and I’m not sure the ukrainians are strong enough to rescue what little is left of democracy by now, even if they are really doing all they can.
Even geophysical science does not exist in a bubble, even if you often get that impression here. This many came to realize during the last big downturn in capitalism ca. 1914-1945. Now the frontal collision between growth and the ecological niche of mankind is at least an order of magnitude greater than it was then. Economic healing by a third global war is not an option now, if you wondered.
Karsten,
I would note that the most significant piece of climate legislation yet to signed into law bears Joe Biden’s signature. Is it enough? Most certainly not. But half the country right now is batshit crazy
Don’t worry, the ensuing global recession that occurs when the US defaults on its debt ought to shave a couple points of of GDP for a few years.
The basic problem remains: Humans are stupid. The good news is that there is a remedy called the scientific method. The bad news? Most people are too stupid to realize they are stupid and so in need of a remedy.
I think the problem is the rhetorically misleading use of ‘scientists’ rather than the more accurate ‘some scientists’. Furthermore, that the article implicitly insinuates that these are new worries, and not 50 year old well known worries, should make people wary of this source
Nick Palmer, I agree the framing of the issue as ‘scientists’ say xyz lacks accuracy. Its a common media trick I find annoying.
However for me the content of the article was quite good, and that is the main point. I haven’t heard anyone say they were wrong. And it was explained in easy to understand language…
For the record, I did not speak to Mr. Pearce. His article relied on comments I had made in a Wood’s Hole press release accompanying our PNAS paper.
The Yale article notes that, while satellites stay up longer, so does space junk, increasing the chances of a collision.
This is in keeping with the journalistic principle that every silver lining has a cloud. Cue The Onion: “Philanthropist gives $100 bill to every man, woman, and child on Earth; scientists worry about deforestation”
Thanks for the update on this. As you say, Gavin, a lot of folks aren’t aware of this effect, and it’s a lovely ‘fingerprint’ (especially with reference to the “sun did it” folks).
Plenty of fingerprints in the stratosphere but IMO not enough detective sleuthing going on. In the upper stratosphere, the equatorial winds do a complete east-west to west-east and back reversal exactly twice a year. If the sun isn’t responsible for this, not sure what is, since the sun crosses the equatorial ecliptic plane twice a year. That one is obvious to amateur sleuths. Directly below this in the stratosphere is an equatorial layer that does a round-trip reversal every 28 months, what’s called the QBO. It so happens that the moon AND sun cross the Earth’s ecliptic plane near simultaneously twice every 28 months. That is what’s called matching a unique fingerprint — the pattern is there, the supporting evidence exists, and an inference with strong statistical significance provides a working model that can be verified in the future.
In contrast, the stratospheric cooling is a single degree-of-freedom model — heads or tails, it will either cool or heat. Not a lot to go on as far as a unique fingerprint is concerned.
The physics of the QBO is quite interesting. The part I have memorized: upward propagating (group velocity*) fluid mechanical waves, carrying eastward and westward momentum, emanating from the troposphere, are absorbed in the stratosphere (and mesosphere). The absorbtion depends on the type of wave and, among other things, the vertical wind profile. The eastward and westard momentum of the different waves are preferrentially deposited at different heights, changing the wind profile, thus changing where the momentum is absorbed, and so on. If I remember correctly, this produces anomalies that shift downward over time, eastward, then westward, etc. The frequency of the QBO is not driven by an external cycle of like frequency of any sort.
(Similar wave-mean interaction is important in other parts of atmospheric circulation – ??eg., the eddy-driven jet of the midlatitude storm-tracks (correct??). The Brewer Dobson circ. is driven by quasi-stationary vorticity waves coming up from below, if I recall correctly.)
Reminder that for QBO, there’s no lab experiment that features gravity, a rotating sphere, and Coriolis, so every model including the current consensus model is just as much conjecture.
You may not have read what I wrote in the previous comment. The less dense layer above the QBO is driven by an cycle of exactly half a year. That’s an external forcing, with 100% certainty. The denser QBO layer is driven by this cycle amplified by the analogous lunar nodal cycle, with just as much certainty based on the predicted value of the period. The way science works is that you have to debunk this model, based on a perfectly valid fingerprint.
Consider an analogy: old man Moon is a suspected murderer since his fingerprints are all over a crime scene, according to forensics (me). You can say that I made a mistake, and if you double-checked and found out the match was off, the moon can go scot-free and my assertion is debunked. I have no problem with that, but given the evidence of a unique fingerprint you have to assume the Moon is guilty.
This is such a strange scientific discipline — qualitative reasoning doesn’t cut it in any other scientific field.
Paul Pukite,
Of course, Old Man Moon could have been innocent with his fingerprints having been transferred “all over the crime scene” by somebody carefully putting them there. So they were Old Man Moon’s fingerprints but there is an intermediate process which nobody assessing his guilt has yet picked up on.
And then there is the delightful form of argumentation that denialists so often present.
How can it be Old Man Moon wot dun it as he has an alibi. The Cat and the Fiddle saw him the other side of town with the Cow. And if you are concerned that this a situation requires that the whole science of dactyloscopy used to uniquely identify people to be wrong, do remember this science uses the still not proven concept that “no two people have identical prints”. So it is not a problem asserting that such use of science is entirely wrong and quite useless, this despite the worldwide evidence of more than a century demonstrating otherwise. I mean, who are you going to believe? A couple of lovable fictional characters or some mad scientist?
MA,
I don’t care if you argue with my analogy, that’s just rhetorical posturing. What you need to debunk is my peer-reviewed published model of QBO :
https://agupubs.onlinelibrary.wiley.com/doi/10.1002/9781119434351.ch11
The originator of early QBO models, Richard Lindzen, tried to find a connection between QBO and lunisolar atmospheric tides. A couple of citations clarify his thoughts:
“For oscillations of tidal periods the nature of the forcing is clear.”
“Planetary waves on beta-planes”, R Lindzen, Monthly Weather Review, 1967
“One rationale for studying tides is that they are motion systems for which we know the periods perfectly, and the forcing almost as well (this is certainly the case for gravitational tides). Thus, it is relatively easy to isolate tidal phenomena in the data, to calculate tidal responses in the atmosphere, and to compare the two. Briefly, conditions for comparing theory and observation are relatively ideal. Moreover, if theory is incapable of explaining observations for such a simple system, we may plausibly be concerned with our ability to explain more complicated systems.
Lunar tides are especially well suited to such studies since it is unlikely that lunar periods could be produced by anything other than the lunar tidal potential.”
Lindzen, Richard S., and Siu-shung Hong. “Effects of mean winds and horizontal temperature gradients on solar and lunar semidiurnal tides in the atmosphere.” Journal of the atmospheric sciences 31.5 (1974): 1421-1446.
Alas, Lindzen could not find the fingerprint of tides in any of the wind data, and perhaps that dissuaded anyone else from looking the past 50 years. Yet there are other ways of discovering these fingerprints, foremost by looking at aliasing of signals with other signals. An aliasing analysis is essentially what I did to discover the pattern. It’s not that hard, Recently I helped a researcher walk through the analysis here:
https://acp.copernicus.org/preprints/acp-2022-792/acp-2022-792-AC1-supplement.pdf
Recommend reading through this because it provides a good example of how one goes about cross-checking a model.
Paul-san,
If you could write up your findings about celestial influences on ENSO (if I have that right) and send it to a journal, you could either make a real contribution to the science, or at least, if it’s rejected, find out where you went wrong.
BPL said:
The ENSO model was already published long form in late 2018, and presented short form at a couple of AGU conferences prior to that.
https://agupubs.onlinelibrary.wiley.com/doi/10.1002/9781119434351.ch12
BTW, I wouldn’t personally refer to it as a “celestial” influence as it downplays the massive gravitational forcing of a direct tidal influence.
Holton, James R. “An Introduction to Dynamic Meteorology” 3rd ed. 1992, Academic Press, New York – see section 12.6 – describes QBO caused by 2 types of vertically propagating equatorial waves: Kelvin and Rossby-gravity. It’s possible the basic understanding has been refined and revised since then (?other waves?), but it doesn’t seem to have been overturned:
https://agupubs.onlinelibrary.wiley.com/doi/abs/10.1029/1999RG000073
https://www.nature.com/articles/s43017-022-00323-7
https://en.wikipedia.org/wiki/Quasi-biennial_oscillation#:~:text=The%20quasi-biennial%20oscillation%20%28%20QBO%20%29%2C%20is%20a,a%20mean%20period%20of%2028%20to%2029%20months.
I may have confused matters a bit by mentioning the mesosphere; the specifics of what I described was for the QBO, but there are waves (I don’t know the latitudinal distribution) that get up there and cause stuff (a pole-to-pole overturning which refrigerates the summer polar mesopause, if I recall correctly).
Meanwhile you haven’t offered any causal mechanism (unless you’re implying the seasonality of solar heating, which for the twice-yearly cycle higher up might be right???). And is the correlation holding up?
“Meanwhile you haven’t offered any causal mechanism (unless you’re implying the seasonality of solar heating, which for the twice-yearly cycle higher up might be right???). And is the correlation holding up?”
Definitely the case that the more rareified the atmosphere, the greater the impact of thermal tides which include diurnal and seasonal heating cycles. At lower altitude, the density starts to increase rapidly, whereby gravitational tides start to take over. Mathematically and based on the group symmetry of QBO being a zero-wavenumber behavior, one specific tidal force can contribute to maintaining angular momentum conservation and that’s the nodal or draconic lunar cycle of 27.2122 days. How this corresponds and correlates to the QBO cycle is not the least bit surprising to those that understand signal processing.
@ P. Pukite (@whut)
I follow your stirring into the Pacific ocean and speculations on the same with interest because I am not unaquainted to similar systems, where I have foundv elementary coherence and cleared it up with success.
Experts, fameous scolars and teachers were not aquainted to the very class of phenomena, and had chosen false model conscepts and inadequate unqualified irrelevant parameters.
I shall try and follow up next month and I have a numeral pythagorean training rather from chemistery, from Kepplers Harmonices Mundi, and from musical acouistics pnevmatic oscillators.
I try and find harmonics, that is whole prime number proportions in it, that rather gives possible coherence and figural patterns / sound figural proportions possible morphology, in Nature.
See also Carl von Linnes ideas of biological and mineral systematics that later showed victorious in molecular biology..
Then CHAOS and CHOSMOS, there may be “rumbles” in it, the sea may go white and there may be “breakers” also in the tones and in the cristals . God also plays with daise as easy as that. But not in everything.
If you try and squeese natural chaos into chosmos, you make chaos rather of yourself.
The Devil also must have a place and a special “niche” and be shown on the wall there, in proper temples. Else he will dissolve and mix into everytyhing and into the very room and make it all a Hell. People will go looking for him everywhere if all is in order.
The QBO given as 28 to 29 months may be a keye to it.
“Mathematically and based on the group symmetry of QBO being a zero-wavenumber behavior, one specific tidal force can contribute to maintaining angular momentum conservation and that’s the nodal or draconic lunar cycle of 27.2122 days. How this corresponds and correlates to the QBO cycle is not the least bit surprising to those that understand signal processing.” – this is interesting (are you refering to the period with which the Moon crosses Earth’s equatorial plane, or the plane of Earth-moon’s barycenter’s orbit around the Sun?), …but it’s not a mechanism.
PS the tides do interest me – the basic explanation would have one think that high tide should be when the Moon is close to overhead or close to opposite, but if the whole Earth deformed equally, we perhaps wouldn’t have noticed tides until we got things like GPS. The Earth’s elasticity keeps if from deforming all-the way (and maybe unevenly) and also, viscosity causes a lag, and combined there remains some tidal acceleration acting on the oceans, the result often? being a Kelvin wave propagating along coasts, … and the semidiurnal and diurnal and … forms, and solar and lunar and what’s up with the luni-solar tide I mean…… etc.
Of course it’s a mechanism. The synodic/tropical Mf lunar tide is the strongest factor in perturbing the Earth’s length of day (LOD) duration, which is a direct result of conservation of angular momentum in the Earth/Moon/Sun system. This is essentially a torque on continents and mountain ranges such as the Himalayas, not a wavenumber=0 mechanism, unlike the nodal/draconic factor which operates on the longitudinally invariant toroidal waveguide of the equatorial stratosphere, conserving momentum as a zero wavenumber.
I think it’s your job to show it’s not a causal mechanism. The conservation of momentum must occur. As with conventional ocean tides, quantifying the level is not easy but the temporal synchronization is straightforward. The correlation has held up since 1950, when measurements were first made.
tides – actually, there will be feedback between the water and solid Earth, etc. responses – I could imagine one part could end up leading the tidal forcing(?), but the total must lag (because viscosity/friction), so some of Earth’s spin kinetic energy is dissipated as tidal heating; some, along with angular momentum, gets transferred to the orbits of the moon around Earth – and Earth around the Sun (not much impact on that orbit, I expect) – thus the Milankovitch cycles change over time so this is still climate-related but a bit far from stratospheric cooling so I’m done.
A few too many red herrings thrown into the mix. Tidal heating slowdowns are very gradual and extend well into the future while Milankovitch well into the past. LOD changes happen on a continual basis and can be measured with significance on a daily and weekly basis, and that’s likely what’s causing the thermocline sloshing and atmospheric angular momentum (i.e. prevailing inertial wind) reversals. So conservation of angular momentum is a realtime dynamic and when positive and negative excursions occur in one of the orbital factors, then complementary excursions in the others so that the sum total always balances out. I have the math to take care of the bookkeeping analogous to what’s done with tidal analysis.
Too bad. Figure out the most important equatorial behaviors, where most of the incoming solar energy is focused, and there may be hope for creating a better global model of climate variation. The QBO has such an obvious fingerprint and has regularly been implicated in sudden stratospheric warming events, so that seems like such a strong starting point for fundamental understanding.
Reminder that for QBO, there’s no lab experiment that features gravity, a rotating sphere, and Coriolis, so every model including the current consensus model is just as much conjecture.
– well it doesn’t have all the features, but:
from https://agupubs.onlinelibrary.wiley.com/doi/abs/10.1029/1999RG000073
(pdf available):
The conceptual model of the QBO, which formed the basis of the Lindzen and Holton [1968] model, was strongly supported by the ingenious laboratory experi- ment of Plumb and McEwan [1978], which used a salt- stratified fluid contained in a large annulus. The bottom boundary of the annulus consisted of a flexible mem- brane that oscillated up and down to produce vertically propagating gravity waves traveling clockwise and coun- terclockwise around the annulus. For waves of sufficient amplitude, a wave-induced mean flow regime was estab- lished that was characterized by downward progressing periodic reversals of the mean flow. This experiment, which remains one of the most dramatic laboratory analogues of a large-scale geophysical flow, showed that the theoretical paradigm for the QBO was consistent with the behavior of a real fluid system.
you:” qualitative reasoning doesn’t cut it in any other scientific field.”
Of course my introductory explanation was qualitative, as many are. (PS for a more detailed explanation, see the box on p. 591 (4/16) in the pdf from
https://www.nature.com/articles/s43017-022-00323-7 – it is available for free, at least at the moment – and it does seem there are a wider variety of waves involved than the 2 types described in the textbook I cited… and the momentum fluxes (relative to velocity anomaly amplitudes, I expect) must overcome upward advection by the Brewer-Dobson circulation; and climate change could change the QBO )
The textbook I cite below has equations. Equations, founded on the well-established Newton’s laws of motion (this isn’t a context where relativistic or quantum effects are important), describe these waves’ behavior.
I haven’t studied this topic as much as atmospheric radiation (or even baroclinic instability); and I haven’t read the entirety of each article above, but I do get the impression that the scientists studying this have observations and measurements of the waves in the real atmosphere…
So it’s more than qualitative conjecture.
I guess I’m curious… is it that you think something additional is necessary, or do you just not buy the wave explanation.
The Plum experiment is not “ingenious” IMO — it would be ingenious if it could emulate gravitational forces as in the real world. Since g-forces can’t be replicated to scale in the lab, a better experiment would likely involve a magnetic plasma confined to a toroidal waveguide, with an external field applied. This is getting into the cross-disciplinary domain of topological insulators, where old-school climate scientists and atmospheric scientists are out of their element. Need to follow scientists such as Marston and Tobias — I referenced Marston et al in the book from 2018 describing the QBO model, and his topological ideas predate that time by a few years.
“In contrast, the stratospheric cooling is a single degree-of-freedom model — heads or tails, it will either cool or heat. Not a lot to go on as far as a unique fingerprint is concerned.”
That seems to treat the stratosphere as if it were a single height at a single latitude at a single longitude (in case that matters?) at a single time of day at a single time of year (at just one phase of ENSO (in case that matters?)… )
(The climate system is 4+ dimensional)
Not that at all. It’s the correlation without causation aspect. A binary finding can be correlated with many factors, casting doubt to an actual causation (see the “# of Pirates” argument). In contrast, consider deciphering a Mach-Zehnder signal — once the decoding key is found, you have a better chance of explaining the behavior since it is so specific. As I said above, climate scientists are not the foremost experts at signal processing, since it is not something they are specifically trained for.
Yet, consider the potential implications of LLM variants of machine learning, which are able to bring in a wider context of knowledge to a signal processing problem with a complicated fingerprint, such as ENSO or QBO The ML model doesn’t care that it’s going outside the scope of accepted tribal knowledge, it will just crank away and present what the fingerprint matches might be.
@ PP
I have another suggestion to the QBO. oscillation
We designed a “flow cuvette”, working like a “WC”. Slowly filled up by a thin input tube and then rushede out and emptied clean, when full. A repeating and pulsating process in a professionally blown glass- tube construction.
Then imagine that the input flow is slighty varied, and the main volume is large, like an ENSO…. and you even have an obscure extra leak out that is ignored. Then it will be Pulsating indeed…. like an ENSO…. but at a somewhat unpredictable rythm…. also like an ENSO.
Hr Schmidt
This is also interesting.
Early in the climate dispute, I had to take to what I knew and have learnt and saw that it is mostly physical geography, meteorology and physical chemistery that has to go together. Who fights that, regardless of argument, is having it wrong.
Then CO2, what can it be?
I knew the eqviparitation law. and the thermal modes of natural gases. And that of absoption and emission of electromagnetic wave radiation. Air is relatively transparent because it has no absorption- emission bands in visible light but fameous lack of transparency in UV and infrared. That is known from astronomy.
And then the Planc curve of black body thermal emission.
Then, if CO2 has got a strong absorption band that relates to thermo- molecular vibration, that vibration will also collide with oxygen and nitrogen that has only translation and rotation thermal modes. It will thus heat up the further air by collision. But that reaction is reversible, can go both ways and hot air will collide and thus cause CO2 to vibrate and emit electromagnetic IR to empty space on that absorption band.
This alltogether makes the lapse- tate with its distinct knick in the tropopause and the unbelieveable but real temperatures there, plausible and explainable.
This was a first criterium for me. The tropopause isoterm layer knick of lapsrate the cool side of the globe to be explained first, else you are not qualified for climate dispute!.
I repeat,…..
This is the compact theory that I was able to design without believing in or having to ask websites and experts, But rather judge expertise that ignores it or denies or fight this directly or indirectly.
That chill of the tropopause and the slightly rising temperatures from there and upwards, was discovered by 2 or 3 men in a balloon in 1905, with barometer thermometer and oxygen masks, and is found ever since by the worlds fleet of weather balloons.
Those men fainted slighty above the tropopause and woke up again alive as the balloon had begun to settle to higher air pressures again.
Higher ballooning and aeronautics, Picard & al had to use pressure suits and chambers with pure oxygen.
Later, further chilling of the lower stratosphere is said to be a “fingerprint” of the CO2 AGW- effect.
Which seems also plausible then.
As for CO2 in the climate and its importance at very low concentrations, I recommend to discuss it as a catalysator in the process. Then we can show to many other similar processes.
The remaining water from hydroxyl radical (OH) reacting with CH4 in the lower stratosphere, how does that fit into the new conclusions?
The thought, with increased CH4, OH reactions and the subsequent water vapor -H2O can radiate more heat – but cooler in the upper layers of the atmosphere.
/feature/langley/studying-earth-s-stratospheric
Perhaps this acts like a natural cooling mechanism?
@ Chris
I have checkede up.
The OH-. radical is but a very short- lived intermediate stage in the UV- irradiated atmospheric chemistery system.
As I can see, it is prouced and follows the fameous UV – production of ozone from Molecdular bi- atomic O2- Oxygen,, by first splitting it into O. + O. 0ne of which re- combines with O2. to give O3
Ozone is a further extreemly potent and corrosive molecular substance.
NO and NO2 discussed as “NOx” is another fameous very reactive-corrosive free- radical system that fameously transforms or catalyzes burnt sulphur SO2 into SO3 that gives H2SO4 sulphuric acide together with oxygen and water vapour and gives acid rain. That reaction is known from the fameous lead- chamber method of sulphuric acid production where nitrous gases serve as a catalyst. As H2O2 also oxidizes SO2 to SO3, I guess that burning of sulphur in air will eat ozone.
Then you have the reactions with turpenes, that are fresh healthy smells of nordic taiga and high mountain spuce forests under especially blus sky ove white snow smelling ozone….,….. and further diesel and coalsmoke. unsarurated carbon bonds react with ozone giving ozonides, that are ugly smelling oils that detonate when touched.
Only traces of nitrous gases on the glasswares in the lab will eat all your ozone , and ozone furter eats laboratory rubber and cork, latex condoms and paints, and car tyres..
So the glasswares must be thorroughly rinsed and mounted only with clean white paraffin wax = pure alifatic hydrocarbons. Methane, an aliphatic hydrocarbon, will remain quite resistant to those agressive gases then.
But methane is also corroded high up there in the stratosphere giving what remains of traces of water, sulphuric and nitric acid, that is found up there, , and I think that rather takes especially sharp and especially much and especially shortwaved UV. And that the special molecule underway, the OH free radicfal, however popular, is not the good way to present, to understand, and to discuss it.
https://www.nasa.gov/feature/langley/studying-earth-s-stratospheric-water-vapor
Chris
There is one more way that you should be aware of.
The occurance of http://www.polar/stratospheric/clouds
and
http://www.noctilucent/clouds
“pearl mother clours are stratospheric clouds from 15 to 25 km high and are shown to conscist of H2O . H2SO4 . HNO3 solid state cristals at very low temperatures. We are to explain how water, sulphuric acid and nitric acid can get up there and dense enough to cristallize out of empty and extreemly thin air.
For noctilucent clouds we must explain the same up at 60 to 90 Km high in the mesosphere.
Water that manages to get through the chill of the tro0popause will have condensed and fallen out at that heighth and be way to diluted to condense further up. But Methane and SO2 and NH3 do not condense and can pass the tropopause and get higher up. Until there is UV and ozone enough to transform it into extreemly hygroscopic strong sulphuric acid and smoking nitric acid.
with freezing point rather up at + 10 celsius.
With cristal zizes in the plain magnitude of wavelength of light. Giving beautifully opaque pearl mother shine.
Noctilucent clouds have much smaller partices than that, in the magnitude of nanoparticles. But it is diffuse reflection of rather shortwave blue direct and visible sunlight.
I was told that noctilucent clouds are not UV or X- ray fluorescens, that it may look like. I tried for myself, it is not polarized light either. ,
It is direct diffuse reflection real clouds in direct sunshine. And showing Fraunhofer lines that you can also see in common white clouds.
It is known that the Space shuttle and the Falcon x have contributed quite a lot to high mesosphaeric clouds
Hardly the volcano water, but rather the sulphur is what can get above the troposphere and give lasting stratospheric clouds.
Just came across this, cooling of the stratosphere was pretty much mainstream, even Exxon used it (see graphic in the video description, or around the 4 minutes mark of the video) https://earthclimate.tv/video/what-exxon-knew/
Dr Schmidt
There is one aspect that is n0t quite clear to me, and that is WHY the lower stratosphere cools down when the mol- proportion of CO2 to air increases.
Benestad has stated that the isoterm-layer, the tropopause, gets hitgher and the troposphere thicker, That can be understood from when the partial CO2 pressure gets low enough so that CO2 IR radiation does not hit any further CO2 molecules but goes right to space.
But, why that should make a lower air temperature in the stratosphere when the isoterm layer comes higher up to a lower air pressure, I cannot quite understand. But it seems to have been elementary to the pioneers who predicted it as you say, thus it must have an elementary explaination also.
A suggestion from my side is that when molar CO2 / air increases, there is more CO2/ air that can conduct and radiate given air heat over to empty space.
Thain is , More traces of CO2 in that thin air, that can cool it further down.
Is that true?
Carbomontanus,
thank you very much for this interesting point, to that I have an additional question:
Are there data showing that molar ratio of CO2 to N2 and O2 increases with altitude?
If so, what is actually a reason therefor? Is it the methane oxidation, irrespective whether through hydroxyl radicals you mentioned above, or through any other mechanism?
Greetings
T
Tyhomas Kalisz
That can be answered, but I have no recent data.
My best teachbook of classical chemistery Ernst H Riesenfeld states that the mixture of gases in the atmosphere is practically constant up to 23 Km. That is as high as they could get with weather balloon, and tells that the atmospheric gases mix well and soon regarloess of molar weight.
Recent data of CO2 shows that it takes a year or two before it mixes fully from Mahuna Loa to Antarktis.
Still further data by satelite shows that it begins to separate up in the thermosphere due to the eqviparitation principle , all gas molecules will adapt to the same chinetic energy so that lighter molecules will moove faster, and at the top of the atmosphere the lightest Hydrogen and helium enters satelite speed in the given gravitational field and temperature so that some hydrogen split from water by sharp sunshine will “evaporate” from earth all the time. And the heaviest, Krypton and Xenon will remain and “settle” rather low.
But no practical separation of that kind in the gravitational field up to what is measured by weather balloons. Whereas heavier particles, dust rain and snow fall down., not kept mooving and afloat by thermomolecular moovement.
A surrealist suggested that CO2 is a heavier molecule that will fall and settle down to earth among the lighter atmosphere gases.
But, that is as ignorant as thinking that the very heavy Particle system of Caesium iodide or lead iodide will fall down and settle on the bottom when dissolved in water. But osmotic pressure is very much higher than gravitational force and follows Boyles law of gas behaviour, PV=nRT.
As the partial pressure of CO2 has gone from 3 to 4, we can guarantee by Riesenfeld from 1946 that it rules as high as the weather balloons.
Conclusion:
The molar ratio of CO2 to O2 ans N2 does not increase by altitude but it increases steadily over the years in all the atmosphere by human burning of fossile fuels.
Dear carbomontanus,
I apologize for my misunderstanding.
Anyway, thank you very much for your explanation, it is quite instructive.
Best regards
T
P.S.
Many thanks also to Piotr and Barton Paul Levenson who grasped your point correctly and corrected my confusion as well.
TK,
I don’t think CO2 incidence increases with altitude. It is “well mixed” within the troposphere and stratosphere, which between them account for about 99% of the mass of the atmosphere.
Tomáš Kalisz: “Are there data showing that molar ratio of CO2 to N2 and O2 increases with altitude?
I think you may have misread Carbo’s text – his “ the lower stratosphere cools down when
the mol- proportion of CO2 to air increases.” refers to the increase in CO2:air ratio with
time ^* NOT with altitude .
—
^* in time: todays’ lower stratosphere having more CO2 than the same lower stratosphere had in preindustrial times,
Thanks for this nice article, Gavin!
As for the explanation why/how CO2 cools the stratosphere and mesosphere, Sebastian Bathiany and I made an attempt at disentangling the two basic mechanisms contributing to the cooling, and their varying contributions at different heights. We used a complex model (AGCM) as well as a simple model (1D grey-atmosphere) to get that straight.
We also provided an analogy for one of the mechanisms, the “blocking effect”, describing how the skin temperature of a house with windows changes when insulation is added to the walls (keeping the inner heating rate and windows unchanged); spoiler, and not surprisingly, the equilibrium skin temperature of the walls goes down. The analogy takes the phenomenon from spectral to geometric space, but I still consider it a useful analogy.
The other mechanism, the “indirect solar effect”, is active where in particular ozone absorbs solar radiation and increases the equilibrium temperature beyond what would otherwise be the longwave(CO2)-only equilibrium. This latter mechanism is the one which is more often mentioned in explanations of stratospheric cooling (such as in David Neelin’s book “Climate Change and Climate Modeling”). However, both effects are comparably strong, and it depends on height which of them dominates.
If someone’s interested, here’s the paper: https://doi.org/10.5194/esd-7-697-2016 . It’s also cited in the Santer et al. paper discussed here. Any feedback is very welcome.
Cheers,
Helge
Hi Helge
Need to read your paper. But I’m having trouble with the analog. As the interior temperature rises, the skin temperature ultimately also increases. I don’t think the stratosphere warming is a feature of the current imbalance? I have to admit I always had trouble with the various explanations. Gavin’s explanation above implies that in the stratosphere there is no local thermodynamic equilibrium. I guess that works. I always figured that vertical temperature gradients had something to do with also….
No, LTE still holds. The greenhouse gas molecules effectively glow according to their temperature and absorb, both according to their spectrally-varying absorption cross sections. Adding CO2 produces an instantaneous radiative forcing that increases goin down from TOA until it peaks at some level and then declines towards the surface (then sharply to 0 going into the surface). This variation produces (at least instantaneously) cooling and warming at different heights…
(One thing I think might confuse people is that the net flux can be toward higher temperature locally, because if a layer is optically thin, much of what you can see is eg. the cold black of space through the ‘gaps’ between the upper stratospheric cross sections.)
Hi Axel, the overall (TOA) imbalance indeed has only a small role to play (called the “transient component of the blocking effect” in our paper). When you say “As the interior temperature rises, the skin temperature ultimately also increases”, this is indeed true, BUT: in the new equilibrium, it will still be cooler than before you add the insulation. This is because there will be a warmer skin temperature over the windows, and thus a larger fraction of the heat lost through the windows. Recall that the windows are unchanged and there the increased interior temperature must lead to an increased outer skin temperature and heat loss. This is similar in the atmosphere after adding CO2: At the TOA, in the new equilibrium, you will see lower long-wave-emissions in the CO2 bands, which is compensated by higher long-wave-emissions in other bands (assuming the net-TOA-short-wave to be unchanged).
Hr Gössling
I think you make it too complicated.
Radio waves and IR through a gas mixture of N2,O2, and Argon hardly interferes with that gas at all. It cannot heat it up. Neither can visible light.
H2O condenses and freezes out before it enters the stratosphere.
What can only heat up the gas in that stratosphere is gas- molecular collision between exited CO2 CH4 N2O NH3 SO2…. oligo atomic gases with IR absorption bands, but they will absorb less of the whole radiated IR on those narrow bands.
(Ozon is an exeption, heated by solar UV)
But the bulk atmosphere will moove random and collide and heat up those fameous oligo atomic climate gases, so they are the the HEAT RADIATORS of the lower stratosphere.
And when it gets more of them compared to the bi and mono- atomic gases, they will drain more heat from the common air that gets less and less also upwards, and radiate out more.
Thus cool down the lower stratosphere if it becomes more of it in the air..
Try rather and discuss a radiator that receives heat by molecular collision and conduction, and is able to radiate it out to empty space as electromagnetic waves.
It is also how they cool satelites that are beeing overheated in empty space, they use intelligent radiators on it and enough of them.
… of course where there is sufficient opaqueness (strongest parts of CO2 band), parts of the stratosphere can have a net downward radiant flux.
removed from TOA, When the central part of the band is saturated, there is 0 net flux, and doubling tends to effectively widen CO2’s effect over the spectrum, closing the spectral windows to either side, and the forcing is approx. the net flux absent CO2 in those parts of the spectrum, times band widenning. That net flux which is being cut is mainly among the surface, H2O vapor, clouds, and space, with cooling and sometimes warming (base of cloud layer) of those things; and so CO2 reduces that. This is approximate – log(CO2 absorption cross section) is not a perfect triangle centered at 667 cm-1, the Planck function’s temperature sensitivity and H2O optical thicknesses vary over the spectrum, and the CO2 absorption spectrum’s shape depends on T and p (line strength redistribution and line broadenning) so eg. I’m guessing there is less widenning in the lower stratosphere vs. lower troposphere, typically.
At TOA, the net radiant flux won’t go to 0 at saturation (if it could be called that) so long as the air is warmer than the Cosmic Microwave Background, which is actually ~2-3 K but we can just say approx. 0K. So the forcing is less; ?less still when the temperature increases toward TOA? (unless this is compared to just a very warm isothermal layer at TOA?)
Clarification: When the central portion of the CO2 667 cm-1 (~15 microns) band is saturated (generally meaning zero net spectral flux), consider where the effective margins (where the CO2 goes from nearly transparent to ‘pea-soup’) and their spectral locations in the shift between initial and final CO2 amounts. Remove all CO2 holding everything else fixed; the net spectral flux at those band-margin locations can be multiplied by the margin-shifts to approx. get the forcing.
(spectral x = x per unit of spectrum; spectral x * bandwidth = an amount of x)
Caveats:
where there is a temperature discontinuity (as is generally the case at TOA), the saturated net spectral flux is not 0, and the forcing… (if saturation is attained – which is not the case on Earth because the temperature continues to go up and down and up again (almost fractal-like relative to mass path) … is then the difference between the no-CO2 and saturated net spectral fluxes * band margin shifts.
when there is an inversion involved, true saturation is the final approach to the final net spectral radiance; the net spectral flux can go past zero and flip direction before coming back for it’s final approach
CO2 is generally saturated in the central part of the band up to at least the tropopause, at least approximately. But other things being =, It takes more CO2 to reach saturation when the temperature changes faster over distance. In particular, if line-broadenning and line strength were constant with height, it takes more CO2 (molar ppm ie. ppmv) to approach saturation when the temperature, in terms of the Planck function, changes more per unit mass path.
“CO2 is generally saturated in the central part of the band up to at least the tropopause, at least approximately. ”
based on the graphs from Modtran; I’ve looked at clear sky values
Also
“Adding CO2 produces an instantaneous radiative forcing that increases goin down from TOA until it peaks at some level and then declines towards the surface (then sharply to 0 going into the surface). ” – no clouds case; clouds will introduce jumps
@ O`twentyseven
I shall look closer at this. It is a bit aside of my meteorological and chemical learnings.
But be aware that our practical background heat radiation is hardly 3K, because that signal has to be rinsed and filtered out from milky way dirt, as you can see on the oval maps of it also. The milky way has obviously been “retouched” on those maps. The galactic backround in which we live is more close to 20 or 50K or something, or the temperature on Pluto and further in the Kuyper belt and Oorts cloud.
There is a lot of large “coal sacks” and black soot all around in the milky way that is seen on astrophotos, together with the stars, and that is our background environment.
It hardly matters for our climate and can be set roughly to zero because what matters is T^4, but may become important in other arguments. Thus worthy of knowing about..
Thank you; I will look into this more.
Patrick o twentyseven
I have it from a lecture on recent discoveries in radio- astronomy. In those “coal- sacks” in the milky way they find microwave emission spectra, actually fluorescence from more shortwave starshine, of really very exotic , complex carbon and hydrocarbon molecules.
“If one had suggested theese molecules 40 years ago, you would have been dismissed in chemistery!” he said. But the molecules could be reproduced for control at extreemly low temperatures giving the same radio resonance signals.
“What is the temperature there? ” I asked
“Rather about 20-50 K” he replied.
And that is what I know.
And then we have the comets from the oorts- cloud coming near to the sun, where we find further exotic oligo atomic organic molecules that have not evaporated in the oorts cloud, together with what does not evaporate from those comets.
It lands at about the mean galactic background temperature. in vacuum.
… and theres a little overlap between CO2 and a weak O3 band and N2O (also a weak CO2 pair of bands overlaps the main O3 band…)
PS equilibrium temperature response won’t generally match instantaneous forcing exactly (even without H2O, cloud, snow ice, etc. feedbacks) – of course convective fluxes can respond (eg. convective adjustment in troposphere in a 1-D model, hence tendency for surface and troposphere to warm up together, aside from lapse rate feedback’s effect), but also because when a layer warms, it’s abs. cross sections brighten, which will have a warming effect on any layer which would absorb some of that radiance; likewise a cooling layer can have a cooling effect on other layers.
A really strong example: imagine if cloud layers were forcings, and we just insert another cloud layer between two overcast layers. There is no immediate TOA or surface forcing, but if this is above the troposphere (obviously this is hypothetical), the equilibrium effect would be warming below the new cloud layer. There would initially be cooling of the upper cloud layer, which would create a TOA imbalance, which would allow a net accumulation of heat into the total column; that upper cooling would dissappear at equilibrium, unless there’s something going on I haven’t mentioned…right?
Okay. I’m going to look at that paper now, too (I would say more but I figure they’ve probably already said it.)
… hypothetical clouds in this scenario are transparent to solar radiation
(PS for complete accuracy, many (all?) greenhouse gases also absorb some solar radiation. (famously O3, but esp. H2O; CO2 and CH4 do as well; clouds both scatter and absorb solar rad. and absorb and emit LW rad.). And the surface is not a perfect blackbody, of course).
and assuming any solar heating below the lower cloud, the preexisting equilibrium temperature profile is cooling with height from the lower to higher cloud layer (because it’s a greybody case); the new middle cloud layer is assumed to initially have an intermediate temperature.
Well, that seems plausible, thank you. thicker isolation and the same heating inside gives lower temperatures outside and hotter inside.
Hi,
Maybe the indirect solar effect explains what I was wondering about. The stratosphere is cold so the tendency for carbon dioxide to thermally emit there would be minuscule compared to the much warmer troposphere. It almost sounds like you are saying the ozone absorption couples with the carbon dioxide to provide the energy to get the carbon dioxide molecule into an excited state from which it can emit photons. Am I even in the right neighborhood with this interpretation?
What do textbooks say on this issue?
Another way to look at it:
aboven, I focussed on thinking on the net flux; per unit horizontal area, it’s divergence being net radiant cooling per unit layer of air:
https://www.realclimate.org/index.php/archives/2023/05/cmip6-not-so-sudden-stratospheric-cooling/#comment-811771
But you can also take a short cut.
Imagine you’re a greenhouse gas molecule – technically, a blackbody object facing each direction with the same blackbody area (absorption cross section), representing the average effect per a given type of molecule – you are isotropic (same area facing each direction) and so emit the same (spectral) intensity (=spectral radiance * abs. cross section) in each direction; the radiance you glow with = Planck function of you’re temperature = Bν(T).
You recieve a spectral radiance Lν from each direction. Because you are isotropic, you’re net radiant cooling per unit of your abs. cross section =
4π sr * [ Bν – Lν(4π sr av) ]; where Lν(4π sr av) is Lν averaged over all directions (over a sphere of solid angle, which is 4π sr.
For both understanding the net flux and net radiant cooling, it helps to graph Bν and Lν(4π sr av) over optical depth, which I take to be optical thickness along a vertical path…
optical thickness = fractional coverage of all cross sectional area accumulated along a line of sight (ie. cross section size * number density * volume / area facing the line of sight)
Assuming all cross sections are absorbing:
net radiant cooling per unit cross sectional area = net radiant cooling per unit horizontal area, per unit optical depth
and
net vertical flux at a location is proportional the the slope of a trendline fitted to Bν(optical depth), where the trendline is locally weighted (closer Bν values matter more, because you can see them more; farther cross sections are hidden by closer cross sections)
and …
The idas of immagining atoms and molecules as common industrial solid state dry material LEGO- toy mechanical educative particles for you in order to understand it,………..
….. is some of the least appliciable and most stupidi- fying http.www//model/conscepts of elementary material nature- reality.
You better try and see Herz antenna or a coil with a condenser and a spark in a wave- situation and field and resign on the idea of photons as electromagnetic waves are not particular quantum mechanical bullets or standard industrial bricks dry particular dust flying in space.
Photons are not particular and material. Light has no mass and weight
The material end- conditions of light and radio waves to which it interferes and reacts,….. is particular and quantum mechanical. Not heat and light and radiowaves itself.
Photons are not tiny dry material quantum LEGO dust sandstorm particles flying in space. colliding with this and that. They are invisible, electromagnetic waves in the room travelling at lightspeed. ., just like radiowaves.
Light is no material sandstorm in the very room.
Weighty material resonance and reaction to litghtwaves and their frequencies is particular and quantum mechanical.
Re Carbomontanus – of course, you are correct about the nature of matter; it’s quantum waves; fields…
But there is a mathematical equivalence: ie.
“ technically, a blackbody object facing each direction with the same blackbody area (absorption cross section), representing the average effect per a given type of molecule
The rate at which a statistically-sufficient local population of molecules of a given type, assuming LTE (by which, I mean that their non-latent internal energy has attained an equilibrium distribution), (net) absorb (ie. direct absorption – stimulated emission) and emit a spectral radiance in a particular direction (eg./ie. absorb what comes from behind and emit toward you) is the same as what would be absorbed and emitted by the same number (population) of blackbody areas facing that direction; those areas are called absorption cross sections. Given the random orientation of gas molecules, we can think of those areas as the orthographic/orthogonal projections of a sphere of corresponding size, which emits and absorbs the corresponding spectral fluxes from its area.
Both the absorption cross section and scattering cross section concepts are meant to be taken as an effective opaque area that would have the same effect as an actual unit of material (averaged when necessary) using geometric (ie. ray-tracing) optics – so you needn’t worry about diffraction, etc.
(PS over sufficient distance the scattering cross sec. of any opaque, non-absorbing sphere actually tends toward 2x the actual cross section as its size/wavelength -> infinity, even though that is in the range where geometric optics should apply (key: go far along the line of sight to observe the very slight deflection of rays.)
So what I described is not literally true but it has the same effect, provided you average radiance over a statistically-sufficient area. I like the idea of visualizing actual cross sections because it can convey (IMO) an intuitive and visceral sense of why you see what you see – ie. how far you are seeing and the mix of different brightnesses (radiances) being emitted toward you from different locations with different temperatures. This is more literally true and mathematically precise than the concept of an effective emitting level.
…”the scattering cross sec. of any opaque, non-absorbing sphere actually tends toward 2x the actual cross section as its size/wavelength ->“…
Offhand I don’t remember if this was specifically for a sphere or if it specifically applied to a flat circular disc or… I remember it applies to something.
… Actually, this may have been for a transparent sphere?, just with a different index of refraction from its surroundings… (but this is besides the point)…
PS just updated my blog post to better ‘reflect’ (pun not intended) points on the reality vs. mathematically-equivalent visualization
@ Patrick o`twentyseven
“of course, you are correct about the nature of matter. Its quantum waves; fields”
No, I am being more radical than that, and find it better.
Vacuum is not material and electromagnetic waves are not material. Thus light heat and radiowaves and gamma is not material either, it has neither mass nor charge. But it is energetic, mooves at lightspeed, and can inetract with atomic and molecular matter.
The field is not particular and material, but the field end-conditions may be electromatgnetic massive and quantum mechanical and particular.
Thus what is reflected or emitted from matter of that kind carries with it signals of the forms of its endconditions. This rules for any kind of waves.
Light is invisible. Has anyone seen the light? No, that is old supersticion. What you see is its end- conditions and the reality and nature of those endconditions. , Light over it, then you can see it.
And that is so practical with the light.
It is as simple as that.
You can look trough a glass window because ligtht hardly interacts with it. Glass is rather invisible.
In artistery, they are told to draw a glass, wich is impossible until you grasp such an elementary thing, that it simply is not seen.
Thus look closer and draw what you actually can see, bendings refractions and reflection of everything else around and behind that glass. . Draw that.
So, maybe they learn something new and better about material reality.
I have that discussion also from Niels Bohr about the existance of the electron. Respect and interprete rather the reality of those laboratory devices by which it is “assumed”. Draw, tell, and explain rather of that.
Then you will also know better how electricity can be used. As of how also light can be used. Or radios can be used. And even heat or chill can be arranged, used, and dealt with.
…
because you can see some distance,
graphed over optical depth, Lν(4π sr av) is a smoothed version of Bν. Over large optical depths, Lν(4π sr av) follows Bν closely, but over optically-thin structures…
eg: (and the examples given qualify or not depending on the part of the spectrum and amounts of absorbers and the temperature profile, of course): (sharp bends (tropopause, surfaces, edges of clouds), large curvature (H2O dropoff with height), thin fluctuations (stratopause, etc.), sharp drop-offs (TOA, surface without conduction/diffusion+convection etc.)
… Lν(4π sr av) will diverge from Bν, rounding the sharp bends, being less strongly curved, cutting through thin fluctuations, sloping across a drop-off. And you will have stronger net (spectral) heating or cooling at such locations.
Adding more of ‘you’ (the greenhouse gas molecules – or cloud droplets, whatever) at a particular height will increase the net radiant heating or cooling there, up until it looks like a blackbody surface… because the ambient radiance recieved at that location is not affected (it is affected in the space immediately surrounding it). However, adding greenhouse gas molecules over a layer stretches out the graph of Bν over that layer, changing the way Lν(4π sr av) varies relative to it. Optically-thin layers get thicker, etc. A net flux based on the larger Bν will decrease, but originally-finer details may come to dominate the net flux. And while a given layer may emit and absorb more strongly, the radiance it recieves will ultimately come to look more similar to the radiance emitted (because you can’t see as far)…
I’ve worked out that for a sinusoidal Bν = a cos (m*optical depth) there is a wavenumber m for which net fluxes are maximum (for a single direction, net radiance is max for m=1. Max net flux / area is max at a higher m because at angles from vertical optical thickness increases relative to optical depth, assuming isotropic cross sections.
net radiant cooling and heating per unit optical depth is max. for m -> infinity, but if this is because there is no optical depth, the net cooling/etc. per unit mass of atmosphere, would be zero at that point – Doubling optical depth uniformly (halving m) doubles net radiant heating and cooling if starting from infinitesimal optical depth/mass path. A peak value is reached, beyond which net radiant cooling/etc. drops because you can’t see as much of the Bν variation from where you are. Eventually each doubling halves the net cooling/etc. (it also halves the net flux)…
Correction: However, adding greenhouse gas molecules over a layer stretches out the graph of Bν over that layer, changing the way Lν(4π sr av) varies relative to it. Optically-thin layers get thicker, etc. A net flux based on the larger-scale (thicker) Bν structures will decrease, but originally-finer details may come to dominate the net flux. ,/i>
see also my series of comments here (Sept 2020)
– and my blog post Update/Progress on How to See the Greenhouse Effect; Diagram ideas, diagrams done so far (including Seeing Cross Sections – Screen & pinhole camera views); all of part 12?; portions of parts 2 and 13. (please enjoy the diagrams) – what I just posted is a partial summary of part 15 (net yet posted)…
(PS I’ve been working on diagram sets 5 d,e,f)
PS what I just wrote assumes plane-parallel conditions (ignore Earth’s curvature, assuming temperature and composition, etc. are horizontally constant), with isotropic absorbtion (no scattering) – PPIA (pronounced “Papaya”)
PS so when you increasing net ?LW radiant cooling per unit atmosphere and solar heating per unit atm. is unchanged, the temperature locally drops (unless ambient radiance from other layers increases) until the net LW radiant cooling balances solar heating
PS for greybody broadband values, replace Bν with SBconstant*T^4 / pi sr (that’s pi steradians) and Lν with L for all LW
PS when Bν is a straight line over optical depth, Bν – Lν(θ) = a*cos(θ) , where θ is the zenith angle for a direction and Lν(θ) is the radiance coming from that direction, and a is the slope of Bν over optical depth (if optical depth is measured positive downward). The net spectral flux per unit horizontal area is 4/3 * a * pi sr, if I did the math correctly; this implies effective emitting levels for fluxes are 2/3 optical depth units up and down from you, corresponding to an effective zenith angle of acos(2/3) ~=…
… about 48.1897 deg. (effective emitting level for radiance is 1 unit optical thickness from you)
But the effective emitting level for Lν(4π sr av) is 1/2 unit on both sides (above and below); ie., if the Planck function were a straight line over optical depth above and below (it could bend at your location), then taking Bν at 1/2 unit below and 1/2 unit above and averaging them would give you Lν(4π sr av) .
and so there’s a bit of a mismatch at a location like TOA; ie. absent direct solar heating within a sufficient optical depth from TOA, a constant net upward flux in the greybody, pure rad. equilibrium case, which would exist in equilibrium, would, based on the 2/3 relationship, correspond to T^4 being a straight line reaching Teq^4 at 2/3 optical depth from TOA and half that at TOA; this would intersect 0 at the nonexistent but mathematically helpful 2/3 unit above TOA. But based on the 1/2 relationship (corresponding to zenith angle 60 deg), starting with that, I get a skin temp^4 of 5/12 Teq^4 (because 1/2 above TOA is still 0^4 (in principle) but T^4 at 1/2 unit below is 5/6 Teq^4. Of course, then T at 2/3 depth below TOA has to be warmer to get the same OLR. The problem is the radiance – planck func. can no longer be = -a*cos(zenith angle) when Space comes into view (which looks like a blackbody at 0 K, and a blackbody surface can be treated as an isothermal infinite optical depth). Basically, as you approach TOA from below, it starts to look too … oh, I had this figured out qualitatively but now I need to go through it again. But it helps to note that the spectral radiances and fluxes at any location are linearly proportional to the Planck function at any other location, so you can linearly superimpose Bν features: in this case, Space above TOA has a negative anomaly within some depth above and a positive anomaly above that, relative to a straight line coming up from below…
ie. skin temp depends not just on OLR and solar heating per unit optical depth at TOA but the way temperature approaches the TOA value coming up from below (because radiative equilbrium depends on directionally-averaged radiance). But this may not be a large error?
by Teq, I meant Teff,eq, in the notation of https://doi.org/10.5194/esd-7-697-2016
MB,
You are very close. In the stratosphere, solar shortwave radiation is absorbed by ozone, which heats the entire stratosphere through collisions with other molecules. The carbon dioxide radiates infrared, which escapes to space easily at that altitude. Thus the energy balance is between heating from ozone and cooling from carbon dioxide.
It is what I have tried to say all the time. When the radiator gets more pronouncede, it gets colder there.
One additional issue–CO2 an be excited or de-excited by either radiation or collision. If there is more energy in the ozone because it is being excited by UV, it can transfer the excess energy to the CO2 via collision. The process always moves in the direction of keeping all components at roughly the same temperature.
re Marlana Blackburn – apologies for the placement of my recent comments between your question and the answers to it; I felt like what I was saying was related but I originally intended to have them here (where this comment is) and in hindsight I should have just started a new thread.
Great article; thank you!
(I think the last sentence of the 1st paragraph on p.709 might say the opposite of what you meant?)
(I think it might be interesting to see graphs of T^4 over optical depth as well as T over approx. z.)
The lack of transient stratospheric cooling in the complex model was an interesting result.
(that was re: Helge Goessling , https://doi.org/10.5194/esd-7-697-2016 , https://www.realclimate.org/index.php/archives/2023/05/cmip6-not-so-sudden-stratospheric-cooling/#comment-811696 )
I would have expected O3 to contribute to the transient response because of it’s prime spectral real estate, absorption band in the middle of the atm. window, and concentrated in the stratosphere, so that it would see the brightening warming troposphere+surface and warm from that. It’s hard to see but is there a tiny bit of that in the graphs????
Also I would imagine the changes in CO2 band over height (line strengths redistributed toward the band center where T is lower, and reduced line broadening with height up to ~30 km) may add to stratospheric cooling and lack of transient response (?).
Sabine Hossenfelder’s take on how the Greenhouse effect actually works also explains stratospheric cooling pretty well: https://www.youtube.com/watch?v=oqu5DjzOBF8
2018 talk by Susan Solomon on ozone depletion with the focus on the stratosphere. Interestingly the ozone depletion is most pronounced at the outer most layer when it is the coldest, and small temperature changes can make a difference.
Ozone warms the stratosphere, the ozone depletion cools the stratosphere up to around 10 C degrees in Antarctica.
The ozone hole affects the climate through wind cirrculation changes – the cooling in the upper Antarctic atmosphere makes the polar vortex there less wavey, more compact.
Another consequence of this polar vortex contraction it sort of held back global warming in the southern hemisphere.
This means that as the ozone hole heals temperatures will become even worse in regions like Australia or Southern America.
The question is then how the AMOC slowdown will affect the Arctic ozone hole the Gulf stream slows (it will cool the region), and how this will impact civilization. Additional, how will Greenland deglaciation add to it, when large amounts of ice drift in the ocean.
Via https://earthclimate.tv/video/ozone-depletion-from-pole-to-pole-and-its-linkages-to-climate-change/
The researchers’ model also indicates the fires had an effect in the polar regions, eating away at the edges of the ozone hole over Antarctica. By late 2020, smoke particles from the Australian wildfires widened the Antarctic ozone hole by 2.5 million square kilometers — 10 percent of its area compared to the previous year. https://news.mit.edu/2023/study-smoke-particles-wildfires-erode-ozone-0308
Signature of the stratosphere-troposphere coupling on recent record-breaking Antarctic sea ice anomalies https://climatestate.com/2023/06/09/signs-of-change-antarctic-sea-ice-hits-lowest-for-this-time-of-the-year/
Increased wildfires, the boreal forest tipping element – how will it affect sea ice?
PS Very Helpful links:
http://climatemodels.uchicago.edu/modtran/ (for a given height, if you take either looking up or looking down first, set it to background, and then take the other, the diff. between the two curves is the net spectral flux/area (the axis is labelled intensity but the units suggest spectral flux/area). I wish you could put more curves on at a time, though. Around 20 km for tropical clear sky, for large enough CO2, you can see the two curves cross – because the inversion causes a downward net spectral flux when it is sufficiently opaque.
https://geosci.uchicago.edu/~rtp1/papers/PhysTodayRT2011.pdf – great explanation
http://eodg.atm.ox.ac.uk/ATLAS/zenith-absorption – note the roughly triangular shape of the log(CO2 optical depth) graph centered near 667 cm-1 (15 microns). I believe this is for US Standard Atmosphere – not sure how much CO2 (ppm) it’s based on.
http://eodg.atm.ox.ac.uk/ATLAS/ – yes, it is based on US Standard Atm. Should I assume CO2 level for 1976?
http://eodg.atm.ox.ac.uk/ATLAS/zenith-absorption – default has log(optical depth) as vertical axis; note most of Earth’s surface and atmospheric emission is in wavenumbers < 2500 cm-1 (4 microns); an approximate cutoff between solar-dominated and terrestrial-dominated bands is somewhere between 2000 and 2500 cm-1 (5 to 4 microns). This is looking vertically through the whole atm. Relative to air in total, H2O is concentrated in the lower troposphere; O3 is more concentrated in the stratosphere. Line strengths and line broadenning vary with height.
cont. from https://www.realclimate.org/index.php/archives/2023/05/cmip6-not-so-sudden-stratospheric-cooling/#comment-811965 and https://www.realclimate.org/index.php/archives/2023/05/cmip6-not-so-sudden-stratospheric-cooling/#comment-811815 , and neighboring comments:
In the approximation that log(σa) (σa ≡ absorption cross section) of CO2 is an ‘upward pointing’ triangle over spectroscopic wavenumber, peak near 667 cm¯¹ ( http://eodg.atm.ox.ac.uk/ATLAS/zenith-absorption ), with no variation in line broadening or line strength over height, ignoring other (weaker or less relevant) bands, solar CO2 absorption, etc.,
and in the approximation that Bν (Planck function) has constant sensitivity to T over that part of the spectrum, or at least separately on each side of the CO2 band,
and in the approximation that other gases, etc., likewise have constant τ (τ ≡ optical thickness or optical depth) (in each layer) over those part of the spectrum, then:
Taking the spectrum of net spectral flux (per unit horizontal area) at the saturated limit (final approach to final value, typically to 0 except at TOA or…) and with no CO2 (0-effect baseline), the difference between these limits is the ‘height’ (on a graph of spectral flux/area) of the ‘valley’ or ‘hill’ (which may be bounded by a levee or moat if there is an inversion involved, etc.) caused by CO2; multiplying this spectral flux difference by the band widening per doubling of CO2 …
[proportional to 1/(slope of log(σa) over wavenumber)]
… gives forcing per doubling, if the center of the band is already saturated.
Also, as the effective band margin passes a wavenumber, adding CO2 will at first increase net radiant cooling (or heating) if there is ‘room’ (sufficient remaining transparency) to do so, then eventually decrease net radiant cooling/etc. toward 0 (approach to saturation). (In between, depending on the complexity of the temperature profile, etc., I imagine it is possible for net cooling to flip to net heating, etc.)
Once the center of the band is saturated, given the simple band shape, the bandwidth of net radiant cooling or heating by CO2 is fixed and just slides outward from the center with increasing CO2; remaining changes are reductions in the spectral windows for net radiant cooling/heating by other materials (in particular: surface, H2O, and clouds), which of course is associated with the reduction of the net fluxes in those windows.
But different relative concentrations of CO2 are necessary to approach saturation in different conditions, eg./ie. different heights, with saturation closer to TOA being delayed longer; each doubling can thus add a temperature-dependent (hence the indirect solar effect) net radiant cooling by CO2 within some optical depth of TOA; a subsequent doubling’s effect will (?)be more concentrated(?) and more limited in optical depth from TOA (won’t penetrate as far down), though otherwise smaller given cooling by the previous doubling.
Even without saturation, each doubling of CO2 is like adding an additional bandwidth of absorption, but it is twice as strong as the previous bandwidth addition (so like an inverse-inverse blocking effect?)
and now, take away all the simplifying approximations…
the difference between these limits is the ‘height’ (on a graph of spectral flux/area) of the ‘valley’ or ‘hill’ (which may be bounded by a levee or moat if there is an inversion involved, etc.) caused by CO2; multiplying this spectral flux difference by the band widening per doubling of CO2 …
when the center is saturated; note that moats/levees can cross the saturated limit, but the ‘height’ at saturation (saturated limit – 0-effect baseling) is the ‘height’ to use to multiply band-widening.