For the first time, the Federal Judicial Center (FJC) commissioned a chapter on climate science for the manual they put out (with the NASEM) for judges, the Reference on Scientific Evidence (4th Edition). This week, a month after it was published, they pulled the chapter out after being pressured by 27 Republican Attorneys General. You can nonetheless read it here.
[Read more…] about The Climate Science reference they don’t want Judges to readInstrumental Record
Koonin’s Continuing Calumnies
At a public event debating the DOE CWG report, Steve Koonin embarrasses himself further.
[Read more…] about Koonin’s Continuing Calumnies2025 Updates
Our various graphics and model-observation comparisons have been updated with 2025 data. There are a few version updates that make some difference (particularly in sea ice extent), but the basic story is similar to last year. Feel free to comment and/or suggest changes for the future, including potential new comparisons.
Unforced variations: Jan 2026
This month’s open thread. We’re not great ones for New Year’s resolutions, but let’s try. How about we resolve to stay substantive, refrain from abusing one another, and maintaining a generosity of spirit when interacting with others?
Lots of things get updated in January and we’ll try and keep up, though possibly with less fanfare than in previous years. In other news, we await the (supposedly imminent) release of a new “National Climate Assessment”, and the (supposedly imminent) engagement of the authors of the DOE ‘climate report’ with the extensive critiques they received. Meanwhile CMIP7 has started, and we expect results to trickle into the databases throughout the year – dig into some of the literature to get a sense of what will change (better models, improved forcings, etc.).
Eppure si riscaldi.
1.5ºC and all that
The Paris Agreement temperature limits are a little ambiguous and knowing where we are is tricky.
[Read more…] about 1.5ºC and all that“But you said the ice was going to disappear in 10 years!”
Almost two decades ago, some scientists predicted that Arctic summer sea ice would ‘soon’ disappear. These predictions were mentioned by Al Gore and got a lot of press. However, they did not gain wide acceptance in the scientific community, and were swiftly disproven. Unsurprisingly, this still comes up a lot. Time for a deeper dive into what happened and why…
[Read more…] about “But you said the ice was going to disappear in 10 years!”Time and Tide Gauges wait for no Voortman
Here we go again. An obscure, methodologically poor, paper published with little to no review makes a convenient point and gets elevated into supposedly ‘blockbusting’ science by the merchants of bullshit, sorry, doubt. Actual scientists drop everything to respond, but not before the (convenient) nonsense has spread widely. Rebuttals are written and submitted, but by the time they are published everyone has moved on.
Lil’ NAS Express
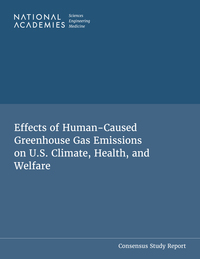
The fast-tracked update of the 2009 EPA Endangerment finding from the National Academies for Science, Engineering and Medicine (NASEM), has now been released.
[Read more…] about Lil’ NAS ExpressDOE CWG Report “Moot”?
Somewhat breaking news. A court filing (from 9/4) from DOE has noted that the Climate Working Group has been disbanded (as of 9/3). This was done to make the EDF/UCS lawsuit moot, but it also means that DOE is withdrawing the report, no-one will respond appropriately to the comments submitted, and (possibly) it becomes irrelevant for the EPA reconsideration of the Endangerment Finding.
What a farce.
Update: Via Andy Revkin, the EDF/UCS’s blistering response to the DOE filing. Pass the popcorn.
Climate Scientists response to DOE report
As we’ve mentioned, Andrew Dessler and Robert Kopp have been coordinating a scientific peer review of the DOW ‘CWG’ Critique of Climate Science. It is now out.
[Read more…] about Climate Scientists response to DOE report