The mystery of why the last million or so years of glacial variability are so different to what came before just got more mysterious…
[Read more…] about The Puzzling PleistocenePaleoclimate
Phantastic Job!
A truly impressive paper was published this week with a new reconstruction of global temperatures over the last ~500 million years.
[Read more…] about Phantastic Job!Oh My, Oh Miocene!
A recent paper suggested that ‘climate sensitivity’ derived from a new paleo-CO2 record is around 7.2ºC (for equilibrium climate sensitivity ECS) and ~13.9ºC (Earth System Sensitivity – ESS) for a doubling of CO2. Some press has suggested that this means that “Earth’s Temperature Could Increase by 25 Degrees” (F). Huge if true! Fortunately these numbers should not be taken at face value, but we need to dig into the subtleties to see why.
[Read more…] about Oh My, Oh Miocene!More solar shenanigans*
Going back a few months, I spent a bit of time pointing out the strategy and nonsense in the various Willie Soon and company’s efforts to blame current warming on solar activity. I specifically pointed out their cultish devotion to a single solar activity reconstruction (Hoyt and Schatten, 1993) (HS93); with an update from Scaffeta (2023), and their increasingly elaborate efforts to create temperature series that correlate to it.
Well, Theodosios Chatzistergos has just published a deep dive into the HS93 reconstruction (Chatzistergos, 2024) (C24) and… let’s say the results will not be surprising to regular readers.
[Read more…] about More solar shenanigans*References
- D.V. Hoyt, and K.H. Schatten, "A discussion of plausible solar irradiance variations, 1700‐1992", Journal of Geophysical Research: Space Physics, vol. 98, pp. 18895-18906, 1993. http://dx.doi.org/10.1029/93JA01944
- N. Scafetta, "Empirical assessment of the role of the Sun in climate change using balanced multi-proxy solar records", Geoscience Frontiers, vol. 14, pp. 101650, 2023. http://dx.doi.org/10.1016/j.gsf.2023.101650
- T. Chatzistergos, "A Discussion of Implausible Total Solar-Irradiance Variations Since 1700", Solar Physics, vol. 299, 2024. http://dx.doi.org/10.1007/s11207-024-02262-6
#NotAllModels
The biggest contribution scientists can make to #scicomm related to the newly released IPCC Sixth Assessment report, is to stop talking about the multi-model mean.
[Read more…] about #NotAllModelsA Tale of Two Hockey Sticks
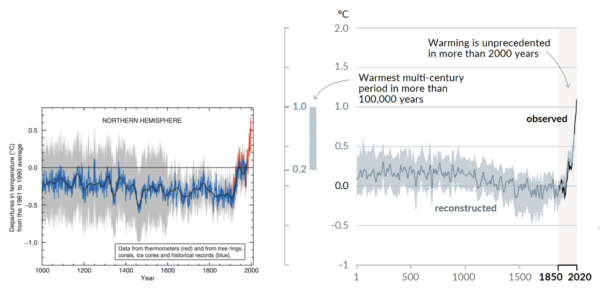
Two decades ago, the so-called “Hockey Stick” curve, published in 1999 by me and my co-authors (Mann, Bradley and Hughes, 1999), was featured in the all-important “Summary for Policy Makers” (SPM) of the 2001 IPCC Third Assessment report. The curve, which depicted temperature variations over the past 1000 years estimated from “proxy data such as tree rings, corals, ice cores, and lake sediments”, showed the upward spiking of modern temperatures (the “blade”) as it dramatically ascends, during the industrial era, upward from the “handle” that describes the modest, slightly downward steady trend that preceded it.
The Hockey Stick became an icon in the case for human-caused climate change, and I found myself at the center of the contentious climate debate (I’ve described my experiences in “The Hockey Stick and the Climate Wars”).
Featured two decades later now in the AR6 SPM is a longer Hockey Stick with an even sharper blade. And no longer just for the Northern Hemisphere, it now covers the whole globe. The recent warming is seen not only to be unprecedented over the past millennium, but tentatively, the past hundred millennia.
The relevant statements in the SPM and Technical Summary are:
A.2.2 Global surface temperature has increased faster since 1970 than in any other 50-year period over at least the last 2000 years (high confidence). Temperatures during the most recent decade (2011–2020) exceed those of the most recent multi-century warm period, around 6500 years ago13 [0.2°C to 1°C relative to 1850– 1900] (medium confidence). Prior to that, the next most recent warm period was about 125,000 years ago when the multi-century temperature [0.5°C to 1.5°C relative to 1850–1900] overlaps the observations of the most recent decade (medium confidence). {Cross-Chapter Box 2.1, 2.3, Cross-Section Box TS.1}
SPM AR6
Global surface temperature has increased by 1.09 [0.95 to 1.20] °C from 1850–1900 to 2011–2020, and the last decade was more likely than not warmer than any multi-centennial period after the Last Interglacial, roughly 125,000 years ago.
Cross Section Box TS.1
As the new IPCC report lays bare (you can find my full commentary about the new report at Time Magazine), we are engaged in a truly unprecedented and fundamentally dangerous experiment with our planet.
References
- M.E. Mann, R.S. Bradley, and M.K. Hughes, "Northern hemisphere temperatures during the past millennium: Inferences, uncertainties, and limitations", Geophysical Research Letters, vol. 26, pp. 759-762, 1999. http://dx.doi.org/10.1029/1999GL900070
The IPCC Sixth Assessment Report
Climate scientists are inordinately excited by the release of a new IPCC report (truth be told, that’s a bit odd – It’s a bit like bringing your end-of-(seven)-year project home and waiting anxiously to see how well it will be received). So, in an uncharacteristically enthusiastic burst of effort, we have a whole suite of posts on the report for you to read.
- AR6 of the Best. Half a dozen takeaways from the report from Gavin
- New (8/13): Sea Level Rise in AR6 from Stefan
- A Tale of Two Hockey Sticks by Mike
- #NotAllModels discusses the use (and mis-use) of the CMIP6 ensemble by Gavin
- We are not reaching 1.5ºC earlier than previously thought from guest authors Malte Meinshausen, Zebedee Nicholls and Piers Forster
- New (8/12): Deciphering the SPM AR6 WG1 Code by Rasmus
- New (8/12): A deep dive into the IPCC’s updated carbon budget numbers from guest author Joeri Rogelj
If/when we add some more commentary as we digest the details and we see how the report is being discussed, we’ll link it from here. Feel free to discuss general issues with the report in the comments here, and feel free to suggest further deep dives we might pursue.
Laschamps-ing at the bit
A placeholder to provide some space to discuss the paper last week (Cooper et al, 2021) on the putative climate consequences of the Laschamps Geomagnetic Excursion, some 42,000 yrs ago.
There was some rather breathless reporting on this paper, but there were also a lot of sceptical voices – not of the main new result (a beautiful new 14C dataset from a remarkable kauri tree log found in New Zealand), but of the more speculative implications – both climatically and anthropologically.
On twitter there were some good threads covering multiple aspects of the paper (and the lead author):
The paper presents some modeling of the impact of the geomagnetic change – mainly affecting solar energetic particles in the stratsophere which leads to some ozone depletion (but not much). They also model what might have happened if on top of the geomagnetic change, there was…
— Gavin Schmidt (@ClimateOfGavin) February 19, 2021
So, do you all know who the lead author is of that 42,000-yr climate event Science paper? It's this guy. https://t.co/2K50tzovAy
— Jessica Tierney (@leafwax) February 21, 2021
https://twitter.com/tinyicybubbles/status/1362743531438227457?s=20
So, I've started tracking down the citations in this Magnetodeth paper. It will be a surprise to no one that the papers on genetic bottlenecks do not support the 42,000-year-ago event that the new paper says they do.
— John Hawks (@johnhawks) February 19, 2021
But let me make a couple of different points. We have occasionally discussed the Laschamps event here as a counter-example to the notion that changes in galactic cosmic rays have a major impact on climate. A reversal or near-reversal of the geomagnetic field would be expected to greatly increase the GCR getting to the lower atmosphere – in far greater amounts than over a solar cycle, or grand solar minimum (like the Maunder Minimum). So if people want to postulate a big role for GCR there, they needed to explain why there wasn’t a much bigger signal at 42kya too. These authors are thus not the only people to have looked for significant climate impacts at this time. They are perhaps the first to claim to have found them…
To be clear, the modeling that was done in this paper was good (if extreme) and suggested that the geomagnetic event combined with a severe grand solar minimum (much bigger than the Maunder minimum) would cause significant depletion of the ozone layer and some shifts in the annular modes. But the ozone depletion is less than we’ve seen due to anthropogenic ozone depletion since the 1980s, and the surface climate changes don’t seem very significant at all – especially compared to the massive variability exhibited in the ice cores throughout the last ice age (particularly in Marine Isotope Stage 3 – the Dansgaard-Oeschgar events). At best these are nuanced and subtle climate effects, and certainly not anything apocalyptic (despite Stephen Fry’s dulcet tones).
Finally, it should be called the Laschamps event (with a final, and etymologically correct, ‘s’) after the village in the Auvergne where it was first identified. There is unfortunately 50 years of legacy references to the “Laschamp” excursion, but hopefully it isn’t too late to fix!
References
- A. Cooper, C.S.M. Turney, J. Palmer, A. Hogg, M. McGlone, J. Wilmshurst, A.M. Lorrey, T.J. Heaton, J.M. Russell, K. McCracken, J.G. Anet, E. Rozanov, M. Friedel, I. Suter, T. Peter, R. Muscheler, F. Adolphi, A. Dosseto, J.T. Faith, P. Fenwick, C.J. Fogwill, K. Hughen, M. Lipson, J. Liu, N. Nowaczyk, E. Rainsley, C. Bronk Ramsey, P. Sebastianelli, Y. Souilmi, J. Stevenson, Z. Thomas, R. Tobler, and R. Zech, "A global environmental crisis 42,000 years ago", Science, vol. 371, pp. 811-818, 2021. http://dx.doi.org/10.1126/science.abb8677
Climate Sensitivity: A new assessment
Not small enough to ignore, nor big enough to despair.
There is a new review paper on climate sensitivity published today (Sherwood et al., 2020 (preprint) that is the most thorough and coherent picture of what we can infer about the sensitivity of climate to increasing CO2. The paper is exhaustive (and exhausting – coming in at 166 preprint pages!) and concludes that equilibrium climate sensitivity is likely between 2.3 and 4.5 K, and very likely to be between 2.0 and 5.7 K.
[Read more…] about Climate Sensitivity: A new assessmentReferences
- S.C. Sherwood, M.J. Webb, J.D. Annan, K.C. Armour, P.M. Forster, J.C. Hargreaves, G. Hegerl, S.A. Klein, K.D. Marvel, E.J. Rohling, M. Watanabe, T. Andrews, P. Braconnot, C.S. Bretherton, G.L. Foster, Z. Hausfather, A.S. von der Heydt, R. Knutti, T. Mauritsen, J.R. Norris, C. Proistosescu, M. Rugenstein, G.A. Schmidt, K.B. Tokarska, and M.D. Zelinka, "An Assessment of Earth's Climate Sensitivity Using Multiple Lines of Evidence", Reviews of Geophysics, vol. 58, 2020. http://dx.doi.org/10.1029/2019RG000678
10 years on
I woke up on Tuesday, 17 Nov 2009 completely unaware of what was about to unfold. I tried to log in to RealClimate, but for some reason my login did not work. Neither did the admin login. I logged in to the back-end via ssh, only to be inexplicably logged out again. I did it again. No dice. I then called the hosting company and told them to take us offline until I could see what was going on. When I did get control back from the hacker (and hacker it was), there was a large uploaded file on our server, and a draft post ready to go announcing the theft of the CRU emails. And so it began.
From “One year later”, 2010.
Many people are weighing in on the 10 year anniversary of ‘Climategate’ – the Observer, a documentary on BBC4 (where I was interviewed), Mike at Newsweek – but I’ve struggled to think of something actually interesting to say.
It’s hard because even in ten years almost everything and yet nothing has changed. The social media landscape has changed beyond recognition but yet the fever swamps of dueling blogs and comment threads has just been replaced by troll farms and noise-generating disinformation machines on Facebook and Twitter. The nominally serious ‘issues’ touched on by the email theft – how robust are estimates of global temperature over the instrumental period, what does the proxy record show etc. – have all been settled in favor of the mainstream by scientists plodding along in normal science mode, incrementally improving the analyses, and yet they are still the most repeated denier talking points.
[Read more…] about 10 years on