• Skip to primary navigation
  • Skip to main content
  • Skip to primary sidebar
  • Skip to footer

RealClimate

Climate science from climate scientists...

  • Start here
  • Model-Observation Comparisons
  • Miscellaneous Climate Graphics
  • Surface temperature graphics
You are here: Home / Extras / Supplemental data / PCA details

PCA details

22 Nov 2004 by mike

PCA of the 70 North American ITRDB Tree-ring Proxy Series used by Mann et al (1998)

a. Eigenvalue spectrum for Mann et al (1998) PCA analysis (1902-1980 zero reference period, data normalized by detrended 1902-1980 standard deviation):

                Rank          Explained Variance       Cumulative Variance
                 1                 0.3818 	  	 0.3818
                 2                 0.0976 		 0.4795
                 _______________________________________________
                 3                 0.0491 		 0.5286
                 4                 0.0354  		 0.5640

First 2 PCs were retained based on application of the standard selection rules (see Figure 1) used by Mann et al (1998).

b. Eigenvalue spectrum for PCA analysis Based on Convention of MM (1400-1971 zero reference period, data un-normalized)

                Rank          Explained Variance       Cumulative Variance
                 1                 0.1946	  	 0.1946
                 2                 0.0905		 0.2851
                 3                 0.0783		 0.3634
                 4                 0.0663 		 0.4297
                 5                 0.0549  		 0.4846
                 _______________________________________________
                 6                 0.0373  		 0.5219

First 5 PCs should be retained in this case employing the standard selection rules (see Figure 1) used by Mann et al (1998).
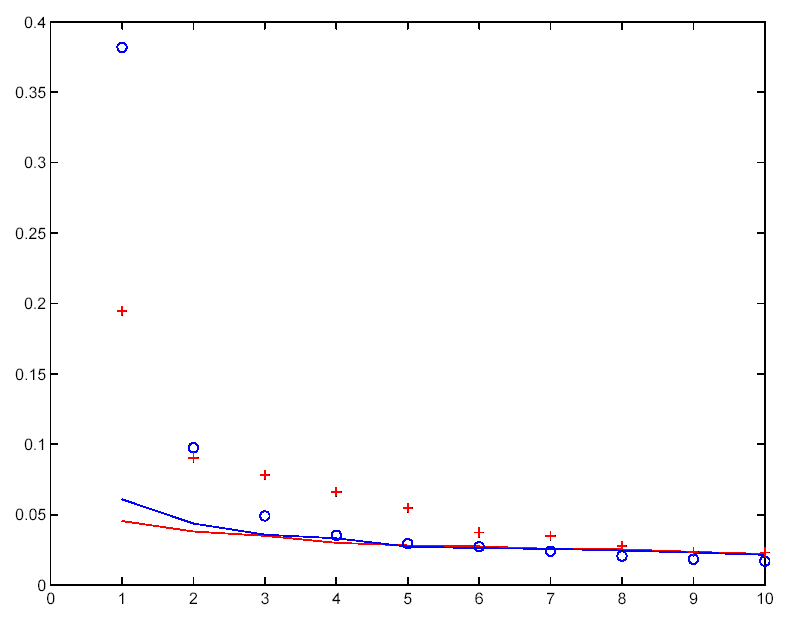
FIGURE 1.
Comparison of eigenvalue spectrum resulting from a Principal Components Analysis (PCA) of the 70 North American ITRDB data used by Mann et al (1998) back to AD 1400 based on Mann et al (1998) centering/normalization convention (blue circles) and MM centering/normalization convention (red crosses). Shown also is the null distribution based on Monte Carlo simulations with 70 independent red noise series of the same length and same lag-one autocorrelation structure as the actual ITRDB data using the respective centering and normalization conventions (blue curve for MBH98 convention, red curve for MM convention). In the former case, 2 (or perhaps 3) eigenvalues are distinct from the noise eigenvalue continuum. In the latter case, 5 (or perhaps 6) eigenvalues are distinct from the noise eigenvalue continuum.

Filed Under: Supplemental data

Primary Sidebar

Search

Search for:

Email Notification

get new posts sent to you automatically (free)
Loading

Recent Posts

  • Unforced Variations: Dec 2025
  • Who should pay?
  • Site updates etc.
  • Raising Climate Literacy
  • Unforced variations: Nov 2025
  • High-resolution ‘fingerprint’ images reveal a weakening Atlantic Ocean circulation (AMOC)

Our Books

Book covers
This list of books since 2005 (in reverse chronological order) that we have been involved in, accompanied by the publisher’s official description, and some comments of independent reviewers of the work.
All Books >>

Recent Comments

  • Yebo Kandu on Raising Climate Literacy
  • Atomsk’s Sanakan on Unforced variations: Nov 2025
  • Kevin McKinney on Who should pay?
  • Kevin McKinney on Who should pay?
  • Barry E Finch on Unforced Variations: Dec 2025
  • Barry E Finch on Unforced Variations: Dec 2025
  • Barry E Finch on Unforced variations: Nov 2025
  • Barry E Finch on Unforced variations: Nov 2025
  • Barton Paul Levenson on Who should pay?
  • MA Rodger on Unforced Variations: Dec 2025
  • Paul Pukite (@whut) on Unforced Variations: Dec 2025
  • Mr. Know It All on Who should pay?
  • patrick o twentyseven on Who should pay?
  • Eddy on Raising Climate Literacy
  • patrick o twentyseven on Who should pay?
  • patrick o twentyseven on Who should pay?
  • Piotr on Who should pay?
  • Tomáš Kalisz on Unforced variations: Nov 2025
  • Nigelj on Who should pay?
  • Nigelj on Who should pay?
  • patrick o twentyseven on Who should pay?
  • Radge Havers on Who should pay?
  • Ray Ladbury on Who should pay?
  • Ron R. on Who should pay?
  • Barry E Finch on Unforced variations: Nov 2025
  • Ron R. on Who should pay?
  • Barton Paul Levenson on Who should pay?
  • E. Schaffer on Unforced Variations: Dec 2025
  • MA Rodger on Unforced Variations: Dec 2025
  • Atomsk’s Sanakan on Raising Climate Literacy

Footer

ABOUT

  • About
  • Translations
  • Privacy Policy
  • Contact Page
  • Login

DATA AND GRAPHICS

  • Data Sources
  • Model-Observation Comparisons
  • Surface temperature graphics
  • Miscellaneous Climate Graphics

INDEX

  • Acronym index
  • Index
  • Archives
  • Contributors

Realclimate Stats

1,389 posts

15 pages

248,729 comments

Copyright © 2025 · RealClimate is a commentary site on climate science by working climate scientists for the interested public and journalists.