Guest Commentary by Mauri Pelto
The net loss in volume and hence sea level contribution of the Greenland Ice Sheet (GIS) has doubled in recent years from 90 to 220 cubic kilometers/year has been noted recently (Rignot and Kanagaratnam, 2007). The main cause of this increase is the acceleration of several large outlet glaciers. There has also been an alarming increase in the number of photographs of meltwater draining into a moulin somewhere on the GIS, often near Swiss Camp (35 km inland from the calving front). The story goes—warmer temperatures, more surface melting, more meltwater draining through moulins to glacier base, lubricating glacier bed, reducing friction, increasing velocity, and finally raising sea level. Examining this issue two years RealClimate suggested this was likely the correct story. A number of recent results suggest that we need to take another look at this story.
The Acceleration:
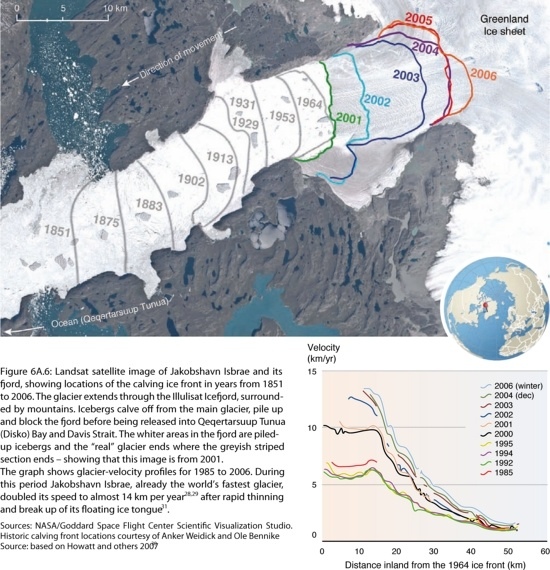
Jakobshavn Glacier, West Greenland, retreated 30 km from 1850-1964, followed by a stationary front for 35 years. Jakobshavn has the highest mass flux of any glacier draining an estimated 6% of the GIS. The glacier terminus region also had a consistent velocity of 19 meters/day (maximum of 26 m in glacier center), from season to season and year to year, the glacier seemed to be in balance, as I noted in a 1989paper. This is the fastest glacier in the world, no steroids needed. After 1997 it began to accelerate and thin rapidly, reaching an average velocity of 34 m/day in the terminus region. The glacier thinned at a rate of up to 15 m/year and retreated 5 km in six years. Jakobshavn has since slowed to near its pre-1997 speed, the terminus retreat is still occurring, but likewise is.
Helheim Glacier, East Greenland had a stable terminus from the 1970’s-2000. In 2001-2005 the glacier retreated 7 km and accelerated from 20 m/day to 33 m/day, while thinning up to 130 meters in the terminus region. Kangerdlugssuaq Glacier, East Greenland had a stable terminus history from 1960-2002. The glacier velocity was 13 m/day in the 1990’s. In 2004-2005 it accelerated to 36 m/day and thinned by up to 100 m in the lower reach of the glacier. Helheim and Kangerdlugssuaq combined drain 8 % of GIS. Hence, they are more than canaries in the coal mine. In 2006, the velocity of Helheim and Kangerdlugssuaq decreased to near the 2000 level, the terminus of Helheim advanced a bit (Howat et al., 2007).
The first mechanism for explaining the change in velocity is the “Zwally effect”, which relies on meltwater reaching the glacier base and reducing the friction through a higher basal water pressure. A moulin is the conduit for the additional meltwater to reach the glacier base. This idea, proposed by Jay Zwally, was observed to be the cause of a brief seasonal acceleration of up to 20 % on the Jakobshavns Glacier in 1998 and 1999 at Swiss Camp (Zwally et al., 2002). The acceleration lasted two-three months and was less than 10% in 1996 and 1997 for example. They offered a conclusion that the “coupling between surface melting and ice-sheet flow provides a mechanism for rapid, large-scale, dynamic responses of ice sheets to climate warming”. The acceleration of the three glaciers had not occurred at the time of this study and they were not concluding or implying that the meltwater increase was the cause of the aforementioned acceleration. However, many others have made this assertion and are investigating (Stearns and Hamilton, 2007). Examination of recent rapid supra-glacial lake drainage documented short term velocity changes due to such events, but they had little significance to the annual flow of the large glaciers outlet glaciers (Das et.al, 2008).
The second mechanism is a “Jakobshavn effect”, coined by Terry Hughes, (1986), where a force small imbalance of forces caused by some perturbation can cause a substantial non-linear response. In this case an imbalance of forces at the calving front propagates up-glacier. Thinning causes the glacier to be more buoyant, even becoming afloat at the calving front, and is responsive to tidal changes. The reduced friction due to greater buoyancy allows for an increase in velocity. This is akin to letting off the emergency brake a bit. The reduced resistive force at the calving front is then propagated up glacier via longitudinal extension in what R. Thomas calls a backforce reduction (Thomas, 2003 and 2004). For ice streaming sections of large outlet glaciers (in Antarctica as well) there is always water at the base of the glacier that helps lubricate the flow. This water is, however, generally from basal processes, not surface melting.
If the Zwally effect is the key than since meltwater is a seasonal input, velocity would have a seasonal signal. If the Jakobshavn effect is the key the velocity will propagate up-glacier, the terminus velocity will be impacted by tides, and there will be no seasonal cycle.
On Jakobshavn the acceleration began at the calving front and spread up-glacier 20 km in 1997 and up to 55 km inland by 2003 (Joughin et al., 2004). On Helheim the thinning and velocity propagated up-glacier from the calving front. Each of the glaciers fronts did respond to tidal variations indicating they had become afloat, detached from their bed (Hamilton et al, 2006). This had been the case at Jakobshavn for the last 50 years, but not for Helheim or Kangerdlussuaq. In each case the major outlet glaciers accelerated by at least 50%, much larger than the impact noted due to summer meltwater increase. On Jakobshavn the acceleration was not restricted to the summer, persisting through the winter when surface meltwater is absent.
As a result of the above Luckman et al. ( 2006) concluded:
“The most plausible sequence of events is that the thinning eventually reached a threshold, ungrounded the glacier tongues and subsequently allowed acceleration, retreat and further thinning. It is reasonable to believe that the 1998 Jakobshavn speed-up, also following a long period of stability, was triggered by the same processes of thinning but occurred earlier and after a shorter period of thinning because the tongue was already afloat.”
Examination of the acceleration of other glaciers such as the Petermann Glacier indicate a much smaller acceleration than that observed on three glaciers we have focused, and indeed it is in the summer and of a magnitude that the Zwally effect could explain (Rignot, 2005). Other large outlet glaciers such as the Rinks and Daugaard-Jensen have been stable since 1960 (Stearns et al, 2005). Many other lesser outlet glaciers have accelerated substantially.
That each of the three glaciers has a reduced velocity in 2006 and 2007 despite some exceptional melt conditions in 2007 further suggests that meltwater is not the dominant driver of the acceleration of the main outlet glaciers. Temporarily, there appears to be a force imbalance at the glacier fronts. This will reduce the annual contribution to rising sea level from glacier dynamic changes. The bad news is that the degree of acceleration that can occur via the Jakobshavn effect is greater in these cases than that from the Zwally effect. The Zwally effect is nonetheless real and also implies a direct sea level impact of greater melt.
The Jakobshavn is of particular importance as it has a bed below sea level for at least 80 km inland from the terminus. In this reach there are no significant pinning points, or abrupt changes in slope or width (Clarke and Echelmeyer, 1996) that would help stabilize the glacier during retreat. It is the only outlet glacier of GIS to lack these, and can then (via backforce reductions) tap into the heart of GIS. We know that surface melting is a slow process for raising sea level. but as Greenland’s major outlet glaciers have recently shown, rapid acceleration can quickly deliver large volume of ice to the ocean. The pace of change is not glacial.
Clarke, T.S. & Echelmeyer, K. 1996: Seismic-reflection evidence for a deep subglacial trough beneath Jakobshavns Isbræ, West Greenland. Journal of Glaciology 42(141), 219–232.
Hughes, T. (1986), The Jakobshavn effect. Geophysical Research Letters, 13, 46-48.
Pelto, M.S., Hughes, T.J. & Brecher, H.H. 1989: Equilibrium state of
Jakobshavns Isbræ, West Greenland. Annals of Glaciology 12, 127–131.,
Thomas, R. H. Abdalati W, Frederick E, Krabill WB, Manizade S, Steffen K, (2003) Investigation of surface melting and dynamic thinning on Jakobshavn Isbrae, Greenland. Journal of Glaciology 49, 231-239.
Thomas RH (2004), Force-perturbation analysis of recent thinning and acceleration of Jakobshavn Isbrae, Greenland, Journal of Glaciology 50 (168): 57-66.
Thanks for the report, I have one question:
you say “The Jakobshavn is of particular importance as it has a bed below sea level for at least 80 km inland from the terminus. In this reach there are no significant pinning points, or abrupt changes in slope or width (Clarke and Echelmeyer, 1996) that would help stabilize the glacier during retreat.”
yet your photo appears to show a widening at the 2006 position. Would you like to comment?
not a criticism per se … but this motion of glaciers is complex: at once moving in one direction, retreating in the other and thinning – it therefore seems like a constructive idea to make these motions clear at the outset, people can then form a type of cognitive map, and this will (of course) contribute to understanding, retention and so forth
Ice loss in Greenland seems to be constrained by outlet glacier calving rates. Is there a point where the mountains ringing Greenland open up such that as the calving fronts continue to retreat, they will begin to greatly widen? Essentially uncorking the plugs to the Greenland Ice Sheet? At that point, the Zwally Effect may become more important than the Jacobshavn Effect. I seem to recall that large parts of Greenland are a ring of mountains with a mushy center that is near or below sea level, like an atoll.
Another relevant analysis is recent work presented at the AGU fall meeting which assessed how much Greenland’s outlet glaciers would need to speed up to get a sea-level contribution on the high side by 2100 or so. Basically all the outlet glaciers would have to get into a highly implausible state of utter overdrive and stay there with no slowdowns for the entire century to have Greenland contribute a meter or two (pretty sure I have that basic sketch right).
As I wrote on Dot Earth in January:
Some scientists assessing the recent acceleration of ice flows propose that the rates of increase can’t be sustained long enough to get a truly disastrous rise in seas by 2100 from a warming Greenland. Tad Pfeffer, of the University of Colorado, and Joel T. Harper of the University of Montana laid out their argument for caution at the American Geophysical Union meeting in San Francisco in December, and quite a few glaciologists seem to agree with them.
I’d love to see Pfeffer or Harper weigh in here. Pfeffer has a nice pdf with his main findings.
90 to 220 cubic kilometers/year translates into what in terms of increase in sea level?
Is this a net figure for Greenland as a whole or a gross figure for the glaciers under consideration?
[Response: That’s net Greenland I think, and translates to about 0.3 to 0.6 mm/yr (out of a total of ~3-4 mm/yr currently). – gavin]
Does anyone know how long it took to empty Glacial Lake Agassiz into the Atlantic?
Glacial Lake “Agassiz”, link to article follows.
http://www.und.nodak.edu/instruct/eng/fkarner/pages/agassiz.htm
@Bernie. Earth surface = 511 million square km. Sea = 71% = 360 million square km. 90 cubic km = 1/4 of a millionth km = 0.25 mm. 220 cubic km = 0.6 mm. Both per year.
Our (me, Joel Harper, and Shad O’Neel) work on estimating the outlet glacier velocities required for Greenland to deliver a really big sea level rise (we looked at 2 m or more) has been submitted for review, so I don’t want to go into a lot of details now. However, the idea is simple, and I’ve talked about this much in many presentations this winter: Take the amount of ice you need to get rid of from Greenland to raise sea level 2 m in the next century, reduce it by your best estimate of the amount that would be removed by surface mass balance losses, and try to push the rest out of the aggregate cross-sectional area of Greenland’s marine-based outlet glaciers. You learn 2 things: 1) the outlet flow speed has to be *really* high, and 2) the volume required is so large that even generously inflated surface mass balance losses can’t touch it.
This is a pretty simple calculation, conceptually anyway. The reason it’s valuable is that for all the recent discussion of fast dynamic contributions to sea level rise, no one has looked at the glacier dynamics that would be required to accomplish it. Rough analogies with past conditions (e.g. sea level rise was big 125,000 years ago, and fast 15,000 years ago, so therefore it makes sense that sea level rise should be big and fast now) don’t take into account any constraints imposed by glacier dynamics, and they neglect the fact that we live in a vastly different world glaciogical world than we did 15,000 years ago. In particular, we don’t have the Laurentide Ice Sheet hanging over us any more. The Jakobshavn Glacier is a monster on a human scale, but in terms of getting rid of the Greenland Ice Sheet fast it’s one of a small number of pretty tiny slots. There are no Hudson Straits in Greenland. There is a fairly large fraction of the interior that lies below sea level, but it’s very poorly connected to the ocean via marine based channels.
The bottom line for me is that glacier dynamics is a very important and unresolved issue (and let’s not forget surface mass balance – it hasn’t gone way and it’s not small). I think there’s been a chicken-little effect at work, however, which tends to make us want to embrace potentially impressive processes rather uncritically. As several other posters have mentioned, we still have a lot of work to do. Let’s get the physics right (or as right as we can), and let’s consider all the sources.
One other point: it’s *not* all Greenland and Antarctica. We neglect the other glaciers and ice caps at our peril. Glaciers and ice caps contributed 28% of total sea level rise compared to 14% combined for Greenland and Antarctica for 1993-2003, using IPCC 4th assessment numbers, or GIC 33%/Greenland and Antarctica 20% for 2006 using Meier et al (Science 2007) numbers. The total sea level rise potential from the glaciers and ice caps is tiny, of course, compared to the ice sheets (50, 60, 70 cm – the number is shifting around. Take your pick). But on the century time scale, 50-70 cm of sea level rise is not tiny. One comment I get a lot is that the glaciers and ice caps will run out of ice soon, so why bother to count them? True enough, they might run out of ice – but under what sea level rise conditions do we regard 50-70 cm as loose change, down in the noise level? The other comment I get is that the glaciers and ice caps aren’t subject to the same dynamic effects as Greenland and Antarctica. They’re not? What about the marine-grounded outlet glaciers draining the Russian and Canadian Arctic, Alaska, Patagonia, etc? How vulnerable are they? The fact is we don’t know – we don’t even have a decent inventory assembled of the marine-grounded glaciers in those areas. We need that information, and until we have it and can answer these questions I’m not ready to write off the glaciers and ice caps.
I interpret the picture as meaning that the Jakobshavn Glacier has become a liquid water river. Is this correct? If so, there would be no more solid ice Jakobshavn effect and the GIS is free to flow as liquid water down Jakobshavn Glacier’s riverbed. But the bulk GIS ice experiences Jakobshavn effect “shoulders” at the ends of the 2006 line so that the bulk ice can’t flow over a broader front? So the GIS is a “caged iceberg” unable to slide whole into the sea because of 50 or so kilometers of mountains holding it in place? I get the imaginary image that GIS is a dangerous monster trying to escape. Is the bottom of the GIS above or below sea level? If below, could a warm ocean current some day flow through Greenland, adding heat? Can you make for us a 3D picture of Greenland?
You have this net loss, and people tend to talk almost always about the loss side of it: melting, moulins, calving, lubrication, etc.
How about Greenland’s precipitation? Is there any change in the rate of elevation increase in the interior? Also, as the perimeter of the GIS recedes, when, if ever, does rebound become a factor?
[Response: Net loss includes the accumulation in the interior (that’s what makes it ‘net’). Rebound is already a little bit of an issue – but from deglaciation at the LGM, not today. – gavin]
Re #9 Tad Pfeffer you say:
“The bottom line for me is that glacier dynamics is a very important and unresolved issue (and let’s not forget surface mass balance – it hasn’t gone way and it’s not small). I think there’s been a chicken-little effect at work, however, which tends to make us want to embrace potentially impressive processes rather uncritically.”
As I see it there has been an inverse chicken-little effect at work. To avoid being called “Chicken Little” the scientists have refused to suggest stories if they are scary and they have emphasised any doubts they may have had.
The IPCC AR4 left out ice melt from sea level rise completely, and scientists have been loath to accept that AGW is causing glaciers to melt. Obviously we are not going to have a rapid rise caused by a pro-glacial lake disgorging into the oceans. We have no pro-glacial lake to do that. However, we should consider the scenarios where a disastrous Greenland ice sheet collapse occurs in case that can happen.
There are two positive feedbacks which have not been mentioned. First, as glaciers melt sea level rises and grounding lines retreat speeding the remaining glaciers’ advance into the sea. Second, as the glaciers melt their height reduces bringing a greater proportion of the glacier below the snow line. Sea level rise has a similar but lesser effect. Both of these cause more melting. Both could end with a runaway melt.
But the biggest danger is the one which is obvious and urgent. When the Arctic sea ice goes the increase in water vapour in the Arctic region will accelerate the Greenland melt. Glacier ice melts by contact with water vapour not warm air. The latent heat in moist air is much greater than the sensible heat. Without the Arctic sea ice insulating the air from the water beneath, the increase in water vapour will be dramatic. This is an obvious and real danger. Why is it not being raised?
Cheers, Alastair.
Speaking of Ice Caps – this just in.
“Only five large ice shelves remain in Arctic Canada, covering less than a tenth of the area than they did a century ago.”
Trent U. report, 4/16/08
http://www.sciencedaily.com/releases/2008/04/080415205350.htm
I hope it is net since the meltwater amounts to an average rainfall for Greenland of about 2 to 3″ per year. I suspect, but don’t know, that this is a not excessive proportion of the annual precipitation.
Mauri Pelto said:
What does the last sentence mean? Especially the part after “pre-1997 speed”?
Pfeffer’s “back-of-the-envelope” calculations are quite compelling (as presented at the Midwest Glaciological Meeting in Burlington, VT last month). Hopefully these calculations will be more widely available soon.
His observation, “One other point: it’s *not* all Greenland and Antarctica. We neglect the other glaciers and ice caps at our peril.” is important. For example, the south dome of Barnes Ice Cap, Baffin Island (the last remnant of the vast Laurentide Ice Sheet) has experienced a rapid lowering in the last two decades. This is an ice cap, the size of Rhode Island, whose melt water flows into Baffin Bay & the Foxe Basin. (http://climatechange.umaine.edu/glaciology/PDFs/2008Geology24013A1.pdf)
The small glaciers (less than 100 sq. km) of Svalbard do seem to be rapidly shrinking yet some of the larger ones are in near steady-state (unpublished thesis data). JCH asks, (#11) “How’s about Greenland precipitation?” Bamber,et al. (GRL V.31, 2004) found that the largest ice cap on Svalbard (Austfonna) was increasing in elevation and correlated the increase to the decline in sea ice which, in turn, provided more open water and, hence, more local precipitation. They do, however, caution that “large perturbations in the mass-balance of other Arctic ice masses may be expected.”
It seems likely that the “small” ice masses of the Arctic archipelagos will, over the next 90 years, contribute more to sea level rise than Greenland. Yet, there is much (as Pfeffer points out) that we do not know about the state of the smaller, non-Greenland, Arctic ice masses.
Rather than flow speeds (presumably at or near the terminus) I’d rather see the total flux of ice presented. That way corrections for the cross sectional area where the velocity has been measured (averaged?) are corrected for. Of course this isn’t directly observed.
If I assume surface melting of 1M/year over the interior, say 500e3 KM**2 due to warmer climate & darker ice surface (old wet ice versus clean dry snow) that would contribute 1.4mm/year to sea levels. Significant, but several times smaller than the catastrophic rates in the popular (nonscientific) literature.
Looking at your chart of the Jakobshavn, my concern would be that further retreat would lead to a much longer terminus as the confining topography is bypassed. Or is only a small part of the upstream terrain immediately inland of the current terminus is below sea level. A longer terminus could potentially lead to a large net calving rate. Is this a possibility, or does convergent flow mean that the present terminus should be very stable against further retreat?
10. Edward, here are some 3D pictures for you
http://membrane.com/sidd/greenland.html
I wanted to ask a question very similar to one already asked by Alastair in #12: Is anyone looking at what the affect on GIS might be of a warm Arctic sea due to albedo effects once the sea ice is gone in the summer?
Of the last great meltwater effects between 10,000 and 20,000 years ago there was massive sea level rises (5 meters per century) because there was massive ice sheets that stretched out to its continental shelf, before breaking off and scarring the edge of the shelf itself. Today the only place we have massive ice sheets is in the East Antarctic and to a lesser extent the West Antarctic, but now the world is twice as hot. The geography of Greenland is now preventing a rapid collapse of its glaciers ( something i call the Cascade Effect ) even though the Zwally Effect and the Jakobshavn Effect are at work now as they were 10 to 20 thousand years ago. My concerns are with the West and East Antarctic, especially the openings at the Ronnie and the Ross ice shelf’s in the West and the Amery ice shelf in the East Antarctic. Are my concerns founded.
Cheers Simon.
Tenney, that is THE question at hand, and I’ll bet no one will even touch it.
AFP and AP and New Scienist news story here:
Lakes on the surface of Greenland’s ice sheet are draining through the kilometre-thick ice and roaring to the bedrock with a flow rate exceeding that of Niagara Falls.
http://environment.newscientist.com/article/dn13729-greenland-ice-lakes-drain-at-speed-of-niagara-falls.html?DCMP=ILC-hmts&nsref=news5_head_dn13729
in reply to Thomas: “Rather than flow speeds (presumably at or near the terminus) I’d rather see the total flux of ice presented. That way corrections for the cross sectional area where the velocity has been measured (averaged?) are corrected for”
You’ll have to wait for the paper to come out, but this is how we did the analysis I described above.
I wonder once the front has retreated from salt water and sea mist that ultracold deep ice could refreeze fresh water and slow the breakup. Notice if you tip dry looking frozen peas into a pot of water that they knit into a frozen block, albeit temporary.
Re: #12
Although increasing latent heat has been raised before *,
the rapid opening of the Arctic Sea and latent heat effects on Greenland ice warrants immediate attention.
* comment #135 at:
https://www.realclimate.org/index.php/archives/2006/03/greenland-ice-and-other-glaciers/
As so much of the GIS is grounded below sea-level, it seems to me that the key to any possible catastrophic mass loss is the Jacobshavn effect: the ungrounding of the marine front as the ice thins and becomes buoyant. It seems to me that this has potential for really dramatic sudden mass loss (“sudden” as in hours/days, not decades), because there’s no guarantee of monotonicity in the (hmm, search for a term) hypothetical net areal buoyancy of the grounded ice.
That is, when a marine front becomes buoyant enough to unground, the section of ice behind the marine front becomes the new front. Until that moment, the buoyancy of that section (i.e. whether or not it has enough ice mass above sea level to remain grounded if exposed to the sea) has been irrelevant. There may be areas which already would float if they could, and which therefore will float very rapidly when the grounding line reaches them.
I’m glad this effect has a name, by the way. I’ve been trying to describe it in blog comments for months now, rather ineffectively.
So what we need is detailed topo maps of the bed and thickness of the GIS, and to work out a map of the “net buoyancy”, or some such (i.e. total ice area density subtracted from the area density of a hypothetical column of water resting on the bed and extending up to sea level). This will show the potential for catastrophic loss of this sort.
Oh, and the same thing for WAIS. I gather there is NSIDC data which makes producing such maps a SMOP.
I’m very much looking forward to seeing the paper to which Tad Pfeffer refers.
I would like to echo Mr. Edmonds inquiry as to the stability of the Pine Island and Thwaites glaciers which seem to connect directly to the Byrd Subpolar Basin, where the ice sheets are grounded far below sea level. I understand that acceleration of the Pine Island glacier has been observed, and there seem to be no natural pinning points. Coupled with the observations of surface melt from
Antarctica, would someone care to comment on the mechanics of glaciers in these sectors ? I seem also to remember a comment by Bindschadler stating that while GIS glaciers could retreat inland from warming oceans, there could be no similar escape for Antatctica.
Unable to find a publisher for it, I put my saturation article on the web:
Saturation
Readers will see my debt to RealClimate articles which touched on this.
I’m not a scientist, just a very interested citizen, but may I suggest another “chicken little scenario”:
With the outlets currently limited in size and location effectively damning the flow, might there be a subsequent built-up of melt with accompanying positive feedbacks further inland – supporting a much greater rate of melt than what we see flowing out? Could this be a building gigantic reservoir? Could such a reservoir break-through at some point of “non-linearity” such as when the Mediterranean flowed back into the Black Sea, raising sea levels dramatically practically overnight?
Possible?
Re: #19 and #21
Dear d.beck,
Have you noticed that water vapour is pouring out of the cracks in the Arctic sea ice in stupendous quantities?
Could the rapid melting of the ice also trigger mega-tsunamis? Ice can act as cement, stabilizing soil. After the ice is gone, you could perhaps have mountains that can break up and fall into the sea.
Thank you Mauri Pelto and also Tad Pfeffer for your insightful explanations and comments. It is always good to get some good news even if it is slight.
Those interested in some more information about this topic might be interested in the article in this week’s Nature (available at least at this time without a subscription):
http://www.nature.com/news/2008/080416/full/452798a.html
Count Iblis: There may be links between tsunamis and deglaciation (Storegga slide is touted) and there is a well-know paraglacial response of rock slopes to deglaciation. But any likely tsunami will probably be rather localised.
Tad Pfeffer (9) — I doubt that there are any (significant) marine grounded glaciers in Alaska or as part of the Southern Patagonian ice cap. Even Hubbard Glacier
http://pubs.usgs.gov/fs/fs-001-03/
appears to terminate in quite shallow water.
Barton Paul Levenson (#28) wrote:
Thank you!
It’s a good essay — and I have bookmarked it for future reference…
Tad Pfeffer:#9: “…Greenland to deliver a really big sea level rise (we looked at 2 m or more)…”
Why choose this particular (unquestionably catastrophic) situation? IMHO this would relate to an overall sea level rise of about 5 meters within 100 years, West Antarctic and higher latitude glaciers included. I never see such a potential rise discussed seriously.
This approach is of course interesting as it might provide an upper boundary for the risk – something that is badly missing. So why not re-compute the situation based on a 0.7 meter contribution from the GIS? That is bad enough for most practical purposes.
Re No. 34, There are a number of tidewater-calving glaciers on the west coast of the South Patagonian Icefield. The only similar glacier on the Northern Icefield, is the San Rafael (which used to have a high calving flux and velocity until it started receding into shallow water).
san quintin (37) — Thank you for the information. The issue, as I take it, is whether or not the glacier has dug a fairly deep submarine canyon, one which the terminus still occupies.
Thanks for a great post. From my perspective the interesting item you raise with both the Zwally and Jakobshavn effects is the persistent increase in the volume of water moving under, over and through these glaciers.
Obviously in the short term the ZnJ effects will give rise to variations in the rate of movement of the glacier, but it is the longer term effects relating to energy transfer that worry me.
Alastair notes that increased water vapour will carry more energy to the surface of the glaciers, likewise these increased water flows over, through and under the glaciers is also transferring vast amounts of energy into the ice. And turbulent flow is WORK being done on the water which generates more heat which is likewise dissipated into the ice.
Do you know of any investigations of current deep ice temperatures of the glaciers and ice caps? I understand that global surface temperatures are not responding as rapidly as they should be when the atmospheric models are considered. Is this ice the sink that is absorbing the currently ‘missing’ global temperature rise?
Among the ice sheet dynamics to fret about I see this change in the temperature of the ice from say -30C to ice-at-0C and the subsequent uptake of the heat to go from ice-at-0C to water-at-0C as the ‘dark matter’ of the cryosphere.
For me this raises the potential of items like the Jakobshaven changing from a ‘cork in the bottle’ of the GIS to being a warm run of open water sloshing about 80km into the GIS, and rather than the cross section available for movement of ice/water being confined to the cross section of the glacier it will increase to the side face area – which is much greater and exposes that new face to the same ZnJ effects..
So if as Arc says the ocean is 360 million sq km, then 2m rise is 720,000 cubic kilometres in a hundred years.
Roughly Greenland has a perimeter of 6600km
Say 10% of this is open to the present-day ocean, gives a ‘gap’ 660km wide for GIS to empty though.
720,000 cukm per hundred years = 19.7 cukm per day = 228,300 cubic metres per second.
228,300 cubic metres per second thru a 660km wide gap = about 350 litres per second per metre of gap.
(Check the numbers, please!)
A sheet flow 350mm deep moving at a leisurely one metre per second. Hydraulically that is VERY possible.
Interestingly the Amazon River – which gets up to 45km wide during the rainy season – discharges at an average rate of 218,000 cubic metres per second. That flow (if not balanced by the water cycle) gives (wait for it!) 1.9m sea rise over 100 years.
http://en.wikipedia.org/wiki/Amazon_River
So 2m in a century from GIS plus other glaciers plus Antarctic is trivial – hydraulically at least.
And of course as soon as the melt starts the ‘gap’ runs up the Jakobshavn and its cousins and for every km back it runs the gap increases by 2km.
And of course the existing wet surface area of the Greenland ice is in fact evidenced by the wetted perimeter others have spoken about – the water on top of, beside, inside, through beneath and abutting the glaciers and ice sheet. It is huge – far more than a mere 660sq km. And its warmer than the ice.
And theres no need to confine this consideration to Greenland:-
Ditto all the above with Antarctica, of course, with bells on…
http://www.abc.net.au/news/stories/2008/04/18/2221062.htm
Oh dear..!
Replying to David Benson #34: in Alaska, Columbia Glacier has retreated ~16 km up a marine-grounded fjord since ca. 1982, and has ~14 km left to retreat before its bed rises out of sea level. The glacier’s calving flux has *averaged* 4 cubic kilometers/year since the onset of retreat with a maximum of 7 kilometers/year in the early 2000s. Hubbard does indeed terminate in shallow water at present (as is presently advancing), but the terminus is on a moraine; upstream from the terminus there is a long marine-grounded reach, although details are lacking… there has been some airborne radio-echo sounding done there recently with more planned. We should know more about Hubbard before long.
Replying to Pekka Kostamo #36: Your questions are good ones, and we address these in the paper. I need to wait for the paper to pass through the review process, though, and not leak out its contents in little bits!
Re 18. Thanks mg for the link to the 3D pictures.
It looks like the Jacobshavn will be getting much wider soon. Is that correct? How much could that affect the need for extreme glacial acceleration to raise sea levels by a meter?
Is there a good breakdown of how much ice is where on the globe and then projections on how much melting might be expected for a given area of ice?
In complete jest:
Why don’t we create a giant damn across the outlet of the Jakobshavn Glacier. It would only be 1 1/2 times bigger than the Three Gorges Damn. This will not only hold back some of the water but could also be used to generate electricity. The electricity could be used to create hydrogen that would be shipped to the US to power all those hydrogen cars that we don’t have the hydrogen for.
No worries mate. Pat Michaels has the floor. http://online.wsj.com/article/SB120847988943824973.html?mod=opinion_main_commentaries
Disko Bay, Greenland: Temperatures on the island are no warmer than they were in the mid-20th century.
As long as this is what makes it into the press, the truth won’t matter. Write a response. Anyone?
Eric (#42). I’d surely prefer a giant dam over a giant damn.
To what extent might long term response to changes hundreds of years ago during the Little Ice Age (LIA) result in glacier surging on the Greenland Ice Sheet and the West Antarctic Ice sheet streams surging into the Ross Sea? More specifically, can one define the response time of a particular ice sheet? Are we seeing the results of AGW in the last 100 years or a change over the last 200 or 500 years?
In addition, this same question could be asked about the valley glaciers in Alaska and elsewhere. How much early 20th century surging and flow could be attributed to LIA addition of mass? And is the current large scale ablation seen on these glaciers due to these glaciers coming to some equilibrium with a warmer world due to coming out of the LIA and response times associated with the large masses involved?
Re 12: The reduced ice mass over the Arctic Sea and increased water vapor as an agent for melting makes sense. But also keep in mind that Lambeck et al (2002) have suggested that loss of permanent ice over the Arctic Sea at the end of the last interglacial allowed for increased accumulation of snow and ice at high latitudes because of the increased amount of moisture available. This seems like a lucid argument for another possible complex feedback in the climate system. See: Lambeck et al (2002). “Links between climate and sea levels for the past three million years.” Nature 419: 199-206
As I have reacted to the speed increase of the Ilulisat/Jakobshavn glacier in the past, herewith some more comments:
– There is a discrepancy between the above map showing the retreat of the ice breakup points and the NASA map over 150 years (7 MB .tiff file, smaller .jpg file here).
According to the NASA map, the retreat of the calving front in the period 1929-1953 (24 years) was as large as the retreat in the period 1953-2003 (50 years). According to the map at the top of this article, the recent retreat was much faster.
I suppose that may have to do with in-between advancing of the glacier’s calving front?
– The previous speedup in the period 1930-1950 might have been caused by (summer) temperatures which were as high or even higher than in the current period. See the around Greenland (coastal) temperatures up to 2005 here
– Greenland (summer) temperatures seems to be more influenced by AMO/NAO than by the general global warming trend.
– Interesting that the retreat speed in the past few years is decreasing. This is quite unexpected, as the resistance of the downstream ice is reducing, thus one should see an increase in retreat speed…
42 Eric, data on the volume of ice and potential sea level rise (pslr) associated with the various components are given in a table on this page:
http://pubs.usgs.gov/fs/fs2-00/
East Antarctic ice sheet vol=26,039,200 km3 pslr=64.80m
West Antarctic ice sheet vol=3,262,000 km3 pslr=8.06m
Antarctic Peninsula vol=227,100 km3 pslr=0.46m
Greenland vol=2,620,000 km3 pslr=6.55m
All other ice caps, ice fields and valley glaciers vol=180,000 pslr=0.45
Total vol=32,328,300 km3 pslr=80.32m
Re #42,
Eric,
You can forget to build a dam at the end of the Ilulisat/Jacobshavn glacier. The water there is about 7 km wide and 700 m deep (therefore the icebergs have a height of about 100 m above the water line!). The fjord ends with an underwater morene, where the (about 800 m thick) icebergs are pushed over by tides, wind and the presuure of the icebergs behind them.
As the glacier/icefjord icebergs advance with a speed of over 30 m/day, any dam (how heavy it may be made) will be pushed away by the forces behind the ice front… Not to be forgotten the harsh winter freezing there…
Figure 4 on this page
http://nsidc.org/news/press/2007_seaiceminimum/20070810_index.html
gives some very interesting sea ice visualisations from the 1982 to 2007. Around 2002 the sea ice dynamics shows some interesting changes, with what appear to be orthogonal shock waves across the ice pumping cycles. It is interesting to note that it was around this time the Larsen ice shelf broke off. Does the oceanic system with its circulatory reconfigurations strongly couple ice dynamics at the two poles? Do these involve other interesting features (eg formation of large oceanic scale mills) around the antarctic circulatory system (can’t find the link I had, but will post when found)? Thus, could ice discharge at Greenland destabilise ice in Antarctica? [Apologies for the amateur questions].
OFF TOPIC:
http://www.sepp.org/publications/NIPCC-Feb%2020.pdf
This article was from another article posted by the Daily Telegraph today about the NIPCC (Non IPCC). The names make familiar reading and so does the rhetoric really.
http://www.telegraph.co.uk/opinion/main.jhtml?xml=/opinion/2008/04/20/do2002.xml
Maybe someone would like to reply to them but I guess scientifically the debate ended some time ago but getting political and economic action on climate change still requires a response from those who continue to befuddle the public.