Guest post by Anders Levermann [via The Conversation]
![]()
Small numbers can imply big things. Global sea level rose by a little less than 0.2 metres during the 20th century – mainly in response to the 0.8 °C of warming humans have caused through greenhouse gas emissions. That might not look like something to worry about. But there is no doubt that for the next century, sea level will continue to rise substantially. The multi-billion-dollar question is: by how much?
The upper limit of two metres that is currently available in the scientific literature would be extremely difficult and costly to adapt to for many coastal regions. But the sea level will not stop rising at the end of the 21st century. Historical climate records show that sea levels have been higher whenever Earth’s climate was warmer – and not by a couple of centimetres, but by several metres. This inevitability is due to the inertia in the ocean and ice masses on the planet. There are two major reasons for the perpetual response of sea level to human perturbations.
One is due to the long lifetime and warming effect of carbon dioxide in the atmosphere. Once emitted carbon dioxide causes warming in the atmosphere over many centuries which can only be reduced significantly by actively taking the greenhouse gas out again. This is because both the amount of heat and carbon dioxide the ocean can absorb is reduced, and so the temperature stays up for centuries or even millennia. Of course, not cutting emissions would exacerbate the problem even further.
The other reason is that both the ocean and the ice masses are very big and a warming of the surrounding atmosphere will only penetrate slowly, but inevitably, into them. As a consequence their sea level contribution continues even if the warming does not increase. Sea level rise over the last century has been dominated by ocean warming and loss of glaciers. Our recent study indicates that the future sea level rise will be dominated by ice loss from the two major ice sheets on Greenland and Antarctica – slumbering giants that we’re about to wake.
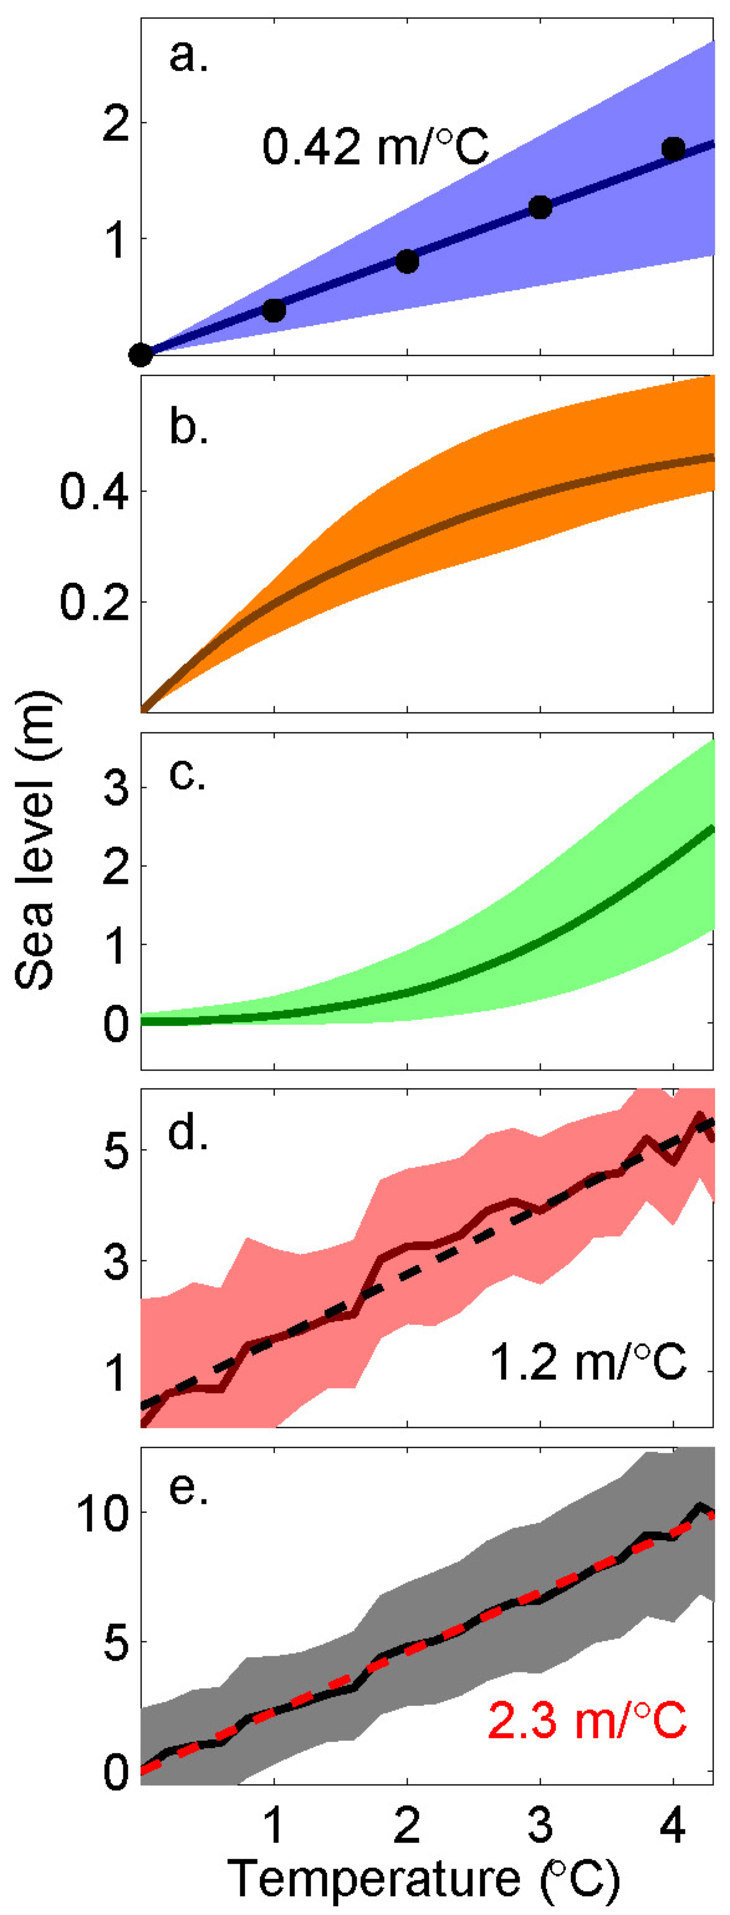
Graph: Sea level rise contributions over 2000 years from: ocean warming (a), mountain glaciers (b), Greenland (c) and Antarctic (d) ice sheets. The total sea level commitment (e) is about 2.3m per degree of warming above pre-industrial.
It is easier to understand a future world that has adjusted to a new equilibrium of higher temperatures than it is to understand the dynamic (perhaps rapid) transition from today’s world to a warmer one. That is why we used physical models for the ocean, the mountain glaciers and the big ice sheets to compute how the systems would be different if the world was warmer.
What we found was that for each degree of global warming above pre-industrial levels the ocean warming will contribute about 0.4 metres to global mean sea-level rise while Antarctica will contribute about 1.2 metres. The mountain glaciers have a limited amount of water stored and thus their contribution levels off with higher temperatures. This is over-compensated for by the ice loss from Greenland, so that in total sea level rises quasi-linearly by about 2.3 metres for each degree of global warming (see figure).
How fast this will come about, we do not know. All we can say is that it will take no longer than 2,000 years. Thus the 2.3 metres per degree of warming are not for this century. They need to be considered as our sea level commitment – the sea level rise that cannot be avoided after we have elevated global temperatures to a certain level.
Ben Strauss of Climate Central has considered the different possible future pathways that society might take and computed which US cities are at risk in the long-term. He poses the question as to what year, if we continue with greenhouse emissions at current rates, we will have caused an inevitable sea level rise that puts certain cities at risk.
According to his analysis, within the next few years Miami in Florida will be committed to eventually lie below sea level, while our future actions can still decide on whether we want to one day give up cities such as Virginia Beach, Sacramento, Boston, Jacksonville or New York City.
This is a decision society has to take for future generations. We will need to adapt to climate change in any case, but some things we will not be able to adapt to. Society needs to decide whether we want to give up, for example, the Tower of London, or to put the breaks on climate change so that we don’t have to.
Weblink: The New York Times has a good current article on this issue.
Anders Levermann is department head at the Potsdam Institute for Climate Impact Research, Germany
Lichanos, Just how do you propose to keep water from flowing downhill…especially when the power may be out due to a storm?
Mr. Roberts asks:
“I wonder if the canyon’s got a deep opening into the Arctic Ocean.”
From Bamber(2013)
“For ~200 km, it provides an uninterrupted hydraulic pathway (Fig. 3 and fig.S3A) that ends at the terminus of Petermann Gletscher.”
if that helps any.
I probably could dig out more detail on Peterman grounding line, but you might wanna look at neven’s web sites where they probly have chapter and verse.
NEGIS still worries me more than Peterman, I dunno why.
sidd
Aha!
http://crawfish22.wordpress.com/ — from about a month ago:
“After a year in dry-dock, the CCGS Amundsen is once again steaming north to the Canadian Arctic for its annual Scientific Research Cruise….
“… to bring on board two specialized ROV (remotely operated vehicle) drivers. They are going to deploy a massive cube of a robot through the ‘moon pool’ in the center of the ship and look for deep sea, cold water corals in the middle of Baffin Bay. … THEN we will get more serious about choosing the ice island that we will target as our field site. There are many between 5-10 sq km along the Baffin Island coast, some from the 2010 break of the Petermann Glacier, which we visited back in 2011 (see way earlier posts). There are also pieces from the 2012 Petermann Glacier break-off event, and at least one ice island produced by the Ryder Glacier – the neighbor of the Petermann Glacier in Northwestern Greenland…”
Re my comments at #71 and 133 – and subsequent replies.
Based upon the initiatives that have been madethus far, and those you expect to be achieved in the coming years (not what you hope or wish for), what do you expect CO2 ppm to change to by, say, 2063? As a result of your estimate, where do you expect global temperatures to be relative to today – and what do you expect to have happened to sea levels by then?
Once we have those views, we can model what coastal areas are threatened and what we expect to happen to our ability to grow food in 50 years time in different areas of the globe. We can project those views further into the future (another 50 years, 100 years, etc. ). We can then see our best guesses of the practical realities that we face – and determine the adaptation we will require.
Dave, if you are planning to “model” coastal & agricultural threats based on my guesstimate of the state of play in 2063, I’d respectfully suggest that that’s unlikely to be a productive use of your time.
However, for what it’s worth, I’d venture a WAG (“wild-ass guess”) that atmospheric concentrations may be in the range of 500-550 ppm. Some thought went into that, but I still doubt it’s worth much as an estimate.
(Captcha seems to believe in the future of carbon removal and sequestration, offering up “385”.)
And meanwhile the tide gauges are still telling us that SLR is about 1.8 mm per year.2/3 is from thermal and 1/3 from ice melt.It is not reasonable to believe that ice melt can accelerate over the next couple of centuries to to a rate which can even remotely suggest a problem from SLR.If we have had any acceleration at all it is still way too little to make much difference to SLR.The sat data says about 3mm per year,but again the numbers don’t show cause for concern.The models for SLR are not reliable
timwells @156.
You will likely find the reason tidal gauges still give SLR at 1.8mm/y is because “The values do not indicate the trend in each year, but the trend of the entire data period up to that year.” Further the period needs to be long due to the variations involved within tidal gauge measurements (as graphed down the link shows).
Indeed, if SLR measured by tidal gauge were, as your allege, different to satellite measurements, why is it that graphs combining both sorts of data (eg here) fail to reflect such a situation? Why do they show gauge & satellite data are in accord? It is your assessment that looks to be “not reliable,” not the SLR modelling.
Because some guy named Tim Wells on the internet forum says so. Got it.
You understand people here read up on the scientific literature, no?
#158–Ah!
But for the caution to be useful, a clear (and reasonably correct) understanding of the term “scientific literature” would be necessary.
The use of unsupported assertion as the sole criterion for ‘reasonable’ strongly suggests otherwise, in the present case…
Calafat and Chambers. GRL, July 2013, doi:10.1002/grl.50731
Not only is sea level rise accelerating, the acceleration is increasing, i.e. the rate of increase of sea level is not only supralinear, it is at least supra-quadratic.
” … since 1973, SL accelerations have been increasing at a significant rate of 0.002 mm/yr^3 until reaching its present value of 0.022 ± 0.015 mm/yr^2 for the 60 year record centered around 1982.”
sidd
The average rate of sea level rise between 2005 and 2011, according to NOAA, was about 1.3 mm per year, well in line with long-term historic trends. Certain methods of measurement even showed no sea level rise in these seven years.
http://ibis.grdl.noaa.gov/SAT/SeaLevelRise/document/NOAA_NESDIS_Sea_Level_Rise_Budget_Report_2012.pdf
Now seven years is a blink of an eye, and this slow rate could well be due to background variation, but if we’re going to have a 2000 mm rise over the next century then Mother Earth better get a move on.
Rabbit, you might want to take a look at what happened in 2012 and 2013. We’re right back on the 3+ mm a year:
http://sealevel.colorado.edu/
As Boening et al noted: “the 2011 La Nina: so strong the oceans fell”
http://onlinelibrary.wiley.com/doi/10.1029/2012GL053055/abstract
In reply to rabbit, #161.
From the University of Colorado
Year
2005.0132 36.141mm
2011.0130 43.690mm
For this period sea level rose 1.2mm a year.
The most recent reading I can find is 2013.5377 with sea level at 61.386mm, that is now 3.0mm a year. Part of the reason for this is that there was a momentary dip in sea level during 2011 due to flooding in Australia and other parts of the world. Since 1993 the average rate has been 3.2mm a year.
The average rate of sea level rise between 2005 and 2011, according to NOAA, was about 1.3 mm per year, well in line with long-term historic trends. Certain methods of measurement even showed no sea level rise in these seven years.
Your link doesn’t work but I don’t need it to recognize that you are regurgitating a false claim. Why don’t you start at the beginning so that I don’t have to make the obvious conclusions about your motivation.
Thomas lee Elfritz:
My, we are political here aren’t we? Any evidence that is not consistent with certain views is met immediately with attacks on motivation. Not exactly a scientific attitude, is it?
Here’s the correct link. Sorry for the problems with the original. You’ll note that there is no apparent slowdown in rise in 2010-2011. And the average rise is 1.1 mm, not 1.3 mm as I originally claimed.
http://ibis.grdl.noaa.gov/SAT/SeaLevelRise/documents/NOAA_NESDIS_Sea_Level_Rise_Budget_Report_2012.pdf
“rabbit” picked cherries; that misstatement about that paper has been promoted a lot at denier sites, and nowhere else.
The paper’s not about detecting the longterm trend; it’s about correlating three different sources of data that overlap for that short period of time.
The longterm trend has short-term variations, and “rabbit” fell for people promoting short-term variation as a trend.
‘rabbit’ should read the science — and take Statistics 101.
Or find sources that are trustworthy.
My, we are political here aren’t we?
No, I am reality and evidence based and have worked with a tide guage in the past and I am familiar with the technical literature on sea level rise.
I’m sure you find Mr. Leuliette’s condensed analysis fine for casual reading, but look at the error bars. I then actually checked Mr. Leuliette’s historical reading list to find out a little more about this gentleman.
Gosh, Mr. Leuliette seems a bit over-enthusiastic to reconcile a wide variety of course disparate results from a bunch of different instruments. Certainly you must consider his opinion to be the final word on this, no?
As an example, take King County (handy because it’s an image found in search but not one of the majority that are posted by the denier sites to mislead).
An uneducated eyeball can claim to “see” a change after 2005 by just looking at this picture; so can the deniers.
A person competent in statistics, or knowing one to trust, sees the longterm trend and the variation year to year — and knows that the more variation, the longer the data set you need to do the arithmetic, to conclude a trend is observable.
http://www.kingcounty.gov/~/media/environment/climate/images/Impacts-mean-sea-level-trend.ashx?w=625&h=606&as=1
If ‘rabbit’ wants to learn statistics, help is available.
rabbit is trolling. If the initial post wasn’t enough evidence, accusing those who look at the full span of evidence of being political is enough evidence.
Re short term variations:
Repost from #82 (page 2)
Link
The paper from #165 above states
and the new findings (link from #170) reveal
List of floods in Australia and on the other side of the Indian Ocean you have countries like Pakistan, India or Bangladesh, which all had exceptional floods in the past 10 years, because of changes in the natural variability, namely Monsoon and/or storm tracks and from increased evaporation rates.
So in other words the Australian continent is a SL buffer, at least for now.
rabbit wrote: “Any evidence that is not consistent with certain views is met immediately with attacks on motivation.”
Your motivation was questioned, not attacked, which is an appropriate response to rote regurgitation of long-debunked denialist talking points that are not “consistent with” the actual evidence.
And the fact that you immediately characterize that response as “political” gives further evidence of your motivation.
“It’s not the trolling, it’s the biting.”
— Marion Delgado
But, hey, there’s always the possibility someone will listen long enough to go ask a librarian, or other trustworthy source, for help checking what s/he believes.
We all have our heads full of stuff that ain’t so. One way or another. It holds the rest of the filling together. And it’s mostly stuff we remember from fifth grade, and “it’s a poor memory that only works backward.”
If ‘rabbit’ weren’t trolling, he/she could go find a librarian and ask for help finding facts.
If ‘rabbit’ doesn’t have a library, that’d be too bad, tho’.
And if ‘rabbit’ is here looking for an argument ….
@132 MA Rodger says:
“…How she’d cope with deniers like Lichanos @128/129 …”
Not clear on just what it is that I am accused of denying in my comments!
There seems to be a tone here that to disagree is to be a member of the Yahoo-Denier crowd. Shouldn’t we keep to specifics?
> Lichanos … what am I accused of denying ….?
In your own words:
Public Health
Late Lessons from Early Warnings: Toward Realism …
Yes, yes, the U.S. House of Representatives is evidence that some behave as you claim everyone behaves. But they’re not the world.
@176 Hank Roberts
Alas! Irony and humour are to no avail…
“You speak in the tone of Jor-El before the catastrophe, or Hari Seldon of the Foundation Series…”
I was comparing the tone of the poster to two fictional creations, and suggesting that they were not good role models.
And also for Lichanos:
http://image.slidesharecdn.com/latelessonsfromearlywarningsaboutenvironmenthealthhazards-davidgee-121114044402-phpapp01/95/slide-42-638.jpg?1352890216
from
http://www.slideshare.net/cccep/late-lessons-from-early-warnings-about-environment-health-hazards-what-can-we-learn
Re- Comment by Lichanos — 12 Sep 2013 @ 12:24 PM
“I was comparing the tone of the poster…”
Because you did not identify who you were talking to (28 Aug 2013 @ 10:08 AM) you pasted everyone with your “fictional creations” label and several folks took offense. I suggest that you take your own advice (12 Sep 2013 @ 10:25 AM) – “Shouldn’t we keep to specifics?”
Steve
@178 Hank Roberts
Thanks you for the slide highlighting the centrality of ethics to this discussion. I agree with the slide completely. That was basically the point of my comment – I didn’t criticize the science (although I could) but raised philosophical-ethical-social concerns. I would love to have that debate.
The problem as I see it, is that many try to use science to quash that debate. The anti-AGW people will often simply argue against the science, but ignore the precautionary principle. Or claim that it is silly. I don’t agree: it has its uses. The AGW faction tries to demonstrate categorically that we are in for some disastrous changes and claims that to ignore the evidence for that is foolish or shortsighted. The evidence is always presented as totally conclusive.
We need to discuss how much risk we are willing to live with, and who pays? Such discussion, however, is often ruled out as denialist-babble because it entails the possibility of rejecting strong anti-carbon action (or even just some of it). Thus, the apocalypse is often invoked to structure the debate in a way that to take that position is to call down upon society certain destruction, obviously an upalatable choice.
Not realistic, not true…
Lichanos @175.
Your comments made such light of the impacts of SLR and storm surge that I took the liberty of looking down the link you provide for yourself. If you are not the author of the comment I found there – “There is no more reason to accept the conclusions of the IPCC regarding the future of the climate than there is to accept the pronouncements of the Brookings Institution (liberal) or the Cato Institute (conservative) on questions of social or economic policy.” – then my apologies. But then, you would I assume agree the quote I found is denying AGW.
As for keeping to “specifics” – you may have an opinion on Miami or the Tower of London but I get the impressions these are locations not specific to you, even though you are here fully dismissive of their continued existence.
> The evidence is always presented as totally conclusive
What evidence do you have for that claim, and why do you consider your source reliable?
That sounds like misinformation you’d have picked up from reading chatroom/blogscience sites — not here.
> raised philosophical-ethical-social concerns.
> I would love to have that debate.
Look at the right sidebar on each page. There are sites where that debate you want to have is actively going on. Those are some of them that have some respect for the science.
Avoid the chatroom/blog-science discussions.
Look for evidence weighed not dismissed, probabilities discussed with knowledge of how they’re figured, and confidence assessed rather than asserted. That’s how it’s done.
145 Hank R, yes, that 120ish maximum has held so far. But today’s newborns will be dealing with 2100 tech. And even if it’s just getting everyone close to 120, that’s a lot of added population.
146 Steve Fish, I’m not sure. I did see a Ted talk where the speaker was planning on living many hundreds of years. In any case, It’s all a bunch of wild-ass speculation.
180 Lichanos said, ” The evidence is always presented as totally conclusive.”
When 97% of experts in a field tell you it’s totally conclusive, how dim would one have to be to take the stance that there’s ever so much to be debated…..
ps, remembering the topic here is the inevitability of sea level rise — if you have doubts about that, citing sources you consider trustworthy, and saying why, would be the way to go.
If your complaint is with the IPCC, this isn’t likely the place to win an argument about that.
As they say there, “Climate change is clearly a broad, complex problem requiring consideration from scientists, politicians, communities and individuals. But the language employed by the IPCC tells us that human-caused temperature increases is a well-understood theory, comparable to our understanding of gravity.”
The climatologists have already shown themselves a whole lot better at predicting the near future than the economists have ever been able to do, and the longer term work looks even stronger as the variations average out and the trend emerges.
Lichanos,
The entire risk debate is often associated with that type of babble, because it opens the possibility that we are willing to take that risk. Everything we do involves some risk. To deny that, denies reality. Every action we take should be anayzed for not just the risk involved in such action, but the risk of not acting. Those people living in earthquake, hurricane, tornado, and flood areas measure these risks constanly (at least should). All this relies on data that has a varying degrees of conclusivity.
Dan H., Most assuredly, everything we do involves risk. However, we must remember the definition of risk–probability of event multiplied by its cost should it occur. However, there are some costs that would be unacceptable even at very low probabilities–that is why Russian roul–ette has never caught on as a popular game of chance. It is also why the first step in any risk calculus is to bound the risk from above.
The bounds on sea level rise to date do not take into account potential tipping points precisely because we don’t know how likely such tipping points are–that is we can’t bound the risk. The result is that threat avoidance is the only viable risk mitigation.
So — look at the entire program, from which Lichianos liked one slide I linked earlier. It’s retrospective. It begins:
“If one looks at history, there has often been sufficient science to justify precautionary actions to reduce or eliminate harm from hazardous agents, decades before effective regulatory actions ….”
Lessons learned. Or not.
Just a question. If the sea level rose by .2 meters in the 20th century due to CO2, what cause it to rise by .2 meters in the 19th century?
[Response: Your question doesn’t make much sense. Sea level rise is currently around 3mm/yr, up from ~1mm/yr one hundred years ago. Some of the rise is related to very long hangovers from the last ice age, but most of what is happening now is related to ice melt and ocean warming associated with human activities. Human activities are increasing and will have larger effects in the future. A change of only 20cm in the next century is highly optimistic. – gavin]
Lichanos (my bold):
The ethical problem in a nutshell is that the “we” who are creating the risk mostly aren’t the “we” who will pay. Anyone who says “I’m willing to live with the risk” is willing to sacrifice millions of the world’s poor, if even a moderate scenario comes to pass.
If “science to justify precaution” is the problem, well, look at human history in its dismal repetition for the say twenty thousand years or so before writing and science began.
There have been smart innovators forever, but rarely one in any particular village during the average person’s lifetime, most just slogged on without learning much or retaining it long enough. Cultural transmission sucked before writing.
Once those few really innovative thinkers could get the benefit of others’ work by reading it and writing more — we got science.
Boom, industrialization, and this developmental path we’ve been on for just a few hundred years, on this planet.
Now you can say, well, blame science — and fall back to the experience of millenia without science: oligarchy/kleptocracy.
Or you can say, well, science — and do better.
Inevitable consequences — as warned of hereabouts — aren’t PR, they aren’t rhetoric — they’re physics.
180 Gavin. You said 3 mm per year now and 1 mm per year in 1913. Did you make that up? All the old data that NOAA has on seal level rise, which goes back to the 1850’s, shows a linear and non-accelerating rise of 2 mm per year. That’s 2 mm and year now, and 2mm a year in the 1850’s. We weren’t even burning coal yet. http://www.hyzercreek.com/SFsealevel.jpg
[Response: Silly me. I thought we were talking about global sea level. I have no information on seals in San Francisco beyond what I read on the internet. Sorry. – gavin]
Hank Roberts: “Cultural transmission sucked before writing.”
Not really. Consider the Pali Canon. In written form it is thousands of pages long. Yet it was transmitted orally for several centuries before it was ever written down, by thousands of monks who memorized and recited every single word of it. That is a skill that few, if any, modern people have.
193 Secular, I’ve got to back up Hank on this one. Thousands of monks (who tend to be very dedicated workers) spending their lives preserving – and I’m guessing not divulging to the common man – one work. I’d say that defines sucking. Heck, I’d say cultural transmission sucked before computers.
192 Gavin: If you need data on a location without seals, which goes back 158 years, you can try this one.
http://tidesandcurrents.noaa.gov/sltrends/sltrends_station.shtml?stnid=8518750
It’s a linear rise of 2.77 mm per year, with no acceleration from 1855 to 2013. I wonder why the sea level rise is not accelerating, in San Francisco, New York, or any of the other locations that NOAA has listed there. Can you please explain it to me? I’d like to know. Cheers. Sorry about the seals typo.
One more thing. Please don’t mix data sets. Don’t graft satellite altimetry data onto tidal gauge data and call it acceleration. Thanks.
During the last several decades, the upward historical trends, quantified from a small set of California tide gages, have been approximately 20 cm/century, quite similar to that estimated for global mean sea level.
http://www.werc.usgs.gov/ProjectSubWebPage.aspx?SubWebPageID=2&ProjectID=238
Morgan Wright @195.
Wouldn’t it be just great if we could stick a tidal gauge in New York harbour and use it to monitor global sea level rise. But for reasons of a scientific nature, they don’t do that. Instead they faff about with hundreds of gauges all round the world. And they aren’t even happy with that and so they send instruments all the way up into space to measure the level of the oceans away from the coastlines.
That’s a big job they’ve set themselves. So don’t be mean. Don’t start asking “why?” Don’t wave the results from a single tidal gauge with a straight line drawn through it as proof of an absence of accelerating SLR. Coz if you do, somebody will have to explain why your talking nonsense.
If you wish to see the result of all the tidal gauge work all round the globe, see here. (It may take two clicks to ‘download your attachment’). The acceleration is present and is obediently following the top IPCC estimate.
I note you say @192 of the 1850’s (sic) – “We weren’t even burning coal yet.” I’m not who you take to be “we” but some folks were, and so sneaked a bit of a head start on the rest who haven’t caught up (in per capita terms, that is). And some likely never will. These third world countries – they just haven’t got the hang of this CO2 emissions thing, have they?
Church and White (2011) Surv Geophys (2011) 32:585–602 DOI 10.1007/s10712-011-9119-1
freely available from
http://link.springer.com/article/10.1007%2Fs10712-011-9119-1
“Sea-Level Rise from the Late 19th to the Early 21st Century”
has a good synthesis.
sidd
Morgan Wright:
What’s your argument against it?