Guest commentary from Michelle L’Heureux, NOAA Climate Prediction Center
Much media attention has been directed at the possibility of an El Niño brewing this year. Many outlets have drawn comparison with the 1997-98 super El Niño. So, what are the odds that El Niño will occur? And if it does, how strong will it be?
To track El Niño, meteorologists at the NOAA/NWS Climate Prediction Center (CPC) release weekly and monthly updates on the status of the El Niño-Southern Oscillation (ENSO). The International Research Institute (IRI) for Climate and Society partner with us on the monthly ENSO release and are also collaborators on a brand new “ENSO blog” which is part of www.climate.gov (co-sponsored by the NOAA Climate Programs Office).
Blogging ENSO is a first for operational ENSO forecasters, and we hope that it gives us another way to both inform and interact with our users on ENSO predictions and impacts. In addition, we will collaborate with other scientists to profile interesting ENSO research and delve into the societal dimensions of ENSO.
As far back as November 2013, the CPC and the IRI have predicted an elevated chance of El Niño (relative to historical chance or climatology) based on a combination of model predictions and general trends over the tropical Pacific Ocean. Once the chance of El Niño reached 50% in March 2014, an El Niño Watch was issued to alert the public that conditions are more favorable for the development of El Niño.
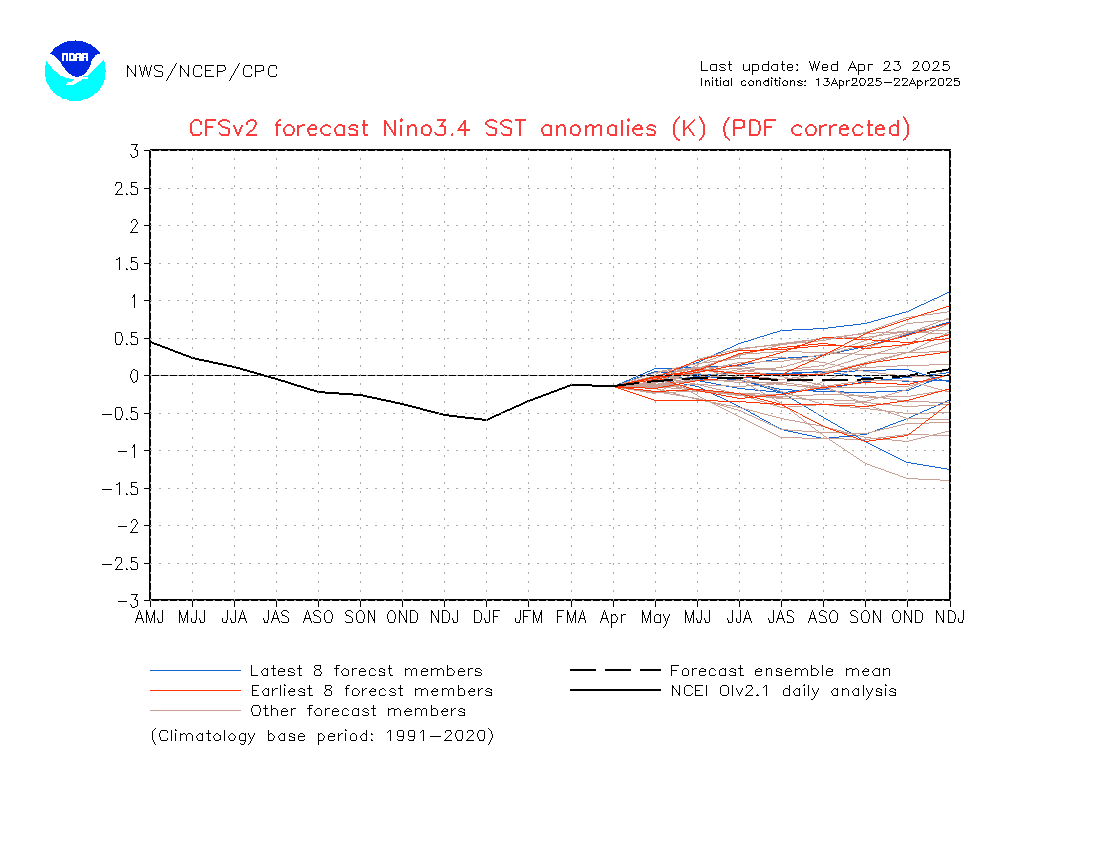
Current forecasts for the Nino-3.4 SST index (as of 5 May 2014) from the NCEP Climate Forecast System version 2 model
More recently, on May 8th, the CPC/IRI ENSO team increased the chance that El Niño will develop, with a peak probability of ~80% during the late fall/early winter of this year. El Nino onset is currently favored sometime in the early summer (May-June-July). At this point, the team remains non-committal on the possible strength of El Niño preferring to watch the system for at least another month or more before trying to infer the intensity. But, could we get a super strong event? The range of possibilities implied by some models allude to such an outcome, but at this point the uncertainty is just too high. While subsurface heat content levels are well above average (March was the highest for that month since 1979 and April was the second highest), ENSO prediction relies on many other variables and factors. We also remain in the spring prediction barrier, which is a more uncertain time to be making ENSO predictions.
Could El Niño predictions fizzle? Yes, there is roughly a 2 in 10 chance at this point that this could happen. It happened in 2012 when an El Nino Watch was issued, chances became as high as 75% and El Niño never formed. Such is the nature of seasonal climate forecasting when there is enough forecast uncertainty that “busts” can and do occur. In fact, more strictly, if the forecast probabilities are “reliable,” an event with an 80% chance of occurring should only occur 80% of the time over a long historical record. Therefore, 20% of the time the event must NOT occur (click here for a description of verification techniques).
While folks might prefer total certainty in our forecasts, we live in an uncertain world. El Niño is most likely to occur this year, so please stay attentive to the various updates linked above and please visit our brand new ENSO blog.
“Could El Niño predictions fizzle?”
I follow SST anomalies in the Nino 3.4 region closely and the record speaks of a long period of cool temps, from April2010 to April 2014. Meanwhile the oceans and particularly the Warm Pacific Pool gather more heat.
My question, if the El Nino does not deliver the punch anticipated or does not actually arrive this fall or winter, where does the accumulating ocean heat go? Deeper, I suppose.
Thanks, as usual I am glad to see statements like:
“While folks might prefer total certainty in our forecasts,we live in an uncertain world.”
Minor nit: ‘ a brand new “ENSO blog” which will soon be part of http://www.climate.gov‘ and ‘please visit our brand new ENSO blog.’
were a little confusing. At some point,maybe this post can be updated with a direct link?
I have often heard of the word “sloshing” used to describe ENSO. And the appearance of a standing wave pattern in pressure between the locations of Tahiti and Darwin in the Pacific leads to the suggestion that modeling the sloshing dynamics would be useful.
This of course is on a large scale, but why not simply scale the well-known physical principles behind sloshing that are known to exist on a small scale?
Frandsen, Jannette B. <a href="http://www.researchgate.net/publication/236155361_Sloshing_motions_in_excited_tanks/file/3deec5167c79c7e329.pdf
“>”Sloshing motions in excited tanks.” Journal of Computational Physics 196.1 (2004): 53-87.
A combination of vertical and horizontal excitation in forcing could certainly lead to the quasiperiodicity seen in the ENSO indices such as SOI. See more of my thoughts here:
http://contextearth.com/2014/05/02/the-soim-substantiating-the-chandler-wobble-and-tidal-connection-to-enso/
I would suggest that the vertical excitation arises from tidal forces, and the the horizontal perhaps related to wind patterns such as the QBO.
One thing that is for certain is that these oscillations revert to the mean over the long term, and can not be used to explain a natural secular warming trend, which is what the climate sceptics seem to be running on about recently.
I have often heard of the word “sloshing” used to describe ENSO. And the appearance of a standing wave pattern in pressure between the locations of Tahiti and Darwin in the Pacific leads to the suggestion that modeling the sloshing dynamics would be useful.
This of course is on a large scale, but why not simply scale the well-known physical principles behind sloshing that are known to exist on a small scale?
Frandsen, Jannette B. <a href="http://www.researchgate.net/publication/236155361_Sloshing_motions_in_excited_tanks/file/3deec5167c79c7e329.pdf
“>”Sloshing motions in excited tanks.” Journal of Computational Physics 196.1 (2004): 53-87.
A combination of vertical and horizontal excitation in forcing could certainly lead to the quasiperiodicity seen in the ENSO indices such as SOI. See more of my thoughts here:
http://contextearth.com/2014/05/02/the-soim-substantiating-the-chandler-wobble-and-tidal-connection-to-enso/
I would suggest that the vertical excitation arises from tidal forces, and the horizontal perhaps related to wind patterns such as the QBO.
One thing that is for certain is that these oscillations revert to the mean over the long term, and can not be used to explain a natural secular warming trend, which is what the climate sceptics seem to be running on about recently.
I think that this is an excellent summary of or current status wrt the ENSO condition; and I would like to add that as the ENSO is an oscillation, even if for some reason an El Nino does not develop this season, it will certainly occur within the next few years; and when it does it will certainty contribute to an increase in mean global temperatures; which in-turn might trigger an acceleration of some positive feedback factors such as methane emissions from both tropical, and tundra, wetlands.
Isn’t it true that we’ve already reached the point where the “El Nino / La Nina” status of 2014 has been decided? The last conversation I had with the CPC folks said that they go off the ENSO numbers of the first three months or so because of the lag effect. I believe it led to the re-evaluation of some recent years if memory serves. Or, are there special exceptions when exceptional ENSO events occur?
Since 2010, the biggest problem for El-Nino forming was its split equatorial personality; cold sst’s South and much warmer Pacific SST’s North of the equator, wrote about it last year:
http://eh2r.blogspot.ca/2013/10/clouds-major-play-explains-cool-2013.html
And it continues to this date where warmer sst’s seem to spread southwards from North of the equator.
When finally the south temperatures where gaining warm in early January:
http://www.ospo.noaa.gov/data/sst/anomaly/2014/anomnight.1.2.2014.gif
El-Nino looked like it was making a winter comeback then. Is there something particularly obvious which makes this strange equatorial dichotomy? Something must be causing this phenomena.
> isn’t it true …
No, not if you believe what they say:
‘oogle “el nino” “spring prediction barrier”
(the spring prediction barrier is mentioned in the opening post but not explained; “spring prediction barrier” for el nino (‘oogle tells me) refers to the unreliability of predictions made around this time of year, during which predictions aren’t very, er, predictive. After this time of year passes, predictions have much more success year after year.
Wait a bit and we’ll hear from someone who knows rather than the likes of me who just looks things up.
RE: 5 (AbruptSLR); ENSO feedbacks
You raised the possibility of an El Nino driven positive feedback from e.g. methane.
I made a non-quantitatve remark about a different contribution:
Reduction of of Planck feedback caused by a series of la Nina’s (or equivalent). A change to El Nino conditions would involve a sign reversal leading to a temporary enhancement of the Planck feedback i.e. a slight net negative contribution to the feedback
RE: #7 Thank you Wayne, yuo never disappoint your readers. I am taking the liberty to post your comment on Joe Romm’s Climate Progress which yesterday featured a good blog on the coming El Nino.
And, the massive plumes of China/India aerosols may be having some impact on ocean surface temperatures east of the Date Line. Any thoughts?
One of the confounding problems in understanding the oscillations of ENSO is that they tend to synchronize with a certain time of the year, typically the end of the year. Therefore even if there is a fundamental periodic pattern in the ENSO, it will lock in to years that resonate more strongly to the end of the calendar year. So this may be a factor that breaks up the periodicity.
If we don’t get a big El Niño this year or soon, with a spike in global average temps, we’re gonna lose more and more of the climate “undecided” to the denier side… that’s the bust.
My Comments in (brackets).
“on May 8th, the CPC/IRI ENSO team increased the chance that El Niño will develop, with a peak probability of ~80% during the late fall/early winter of this year”
( I feel the spot light is on the Americas. No body seems to worry about Asia or tohther ares of the WORLD.)
“Could El Niño predictions fizzle? Yes, there is roughly a 2 in 10 chance at this point that this could happen. It happened in 2012 when an El Nino Watch was issued.”
( It could ; as far as the Americas are concerned. In 2012, the Indian Summer monsoon Rainfall was -8%. . It means a lot to the poor farmers of Asia).
“we live in an uncertain world.”
Sure; But weather Scientist must be more realiable than say “Economists”.
Gopinathan Krishnan is Scientist in India.
If we don’t get a big El Niño this year or soon, with a spike in global average temps, we’re gonna lose more and more of the climate “undecided” to the denier side… that’s the bust.
Comment by Shelama
Have no fear…. Reality will prevail.
I dread an El Nino stronger than 1998. My recollection was standing next to one of the few farm dams that hadn’t dried up. A huge firefighting helicopter called ‘Gypsy’ appeared from the fire blackened sky and drew water from the dam. Now we have more expensive desalination plants on standby and of course plenty of coal fired power stations to run them. You’d have to think something’s not right with this picture.
“we’re gonna lose more and more of the climate “undecided” to the denier side… that’s the bust.”
Far better to lose some ‘votes’ than live with the consequences of an El Nino this year. The comments are trivializing the serious downside of the next real El Nino; it appears to be for the sake of some “told ya so” or vote-swaying.
It’s far more serious – NOAA is recording near-record global temperatures without an El Nino: Dec ’13=3rd; Jan ’14=4th; Feb ’14=21st; Mar ’14=4th. The time for rounding up a response-vote is 20 years late. The planet is already committed to facing the most serious consequences carbon pollution can produce as soon as possible. The lack of response has ensured the worst outcome.
Keep hoping for no El Nino, lots of aerosols, and some major volcanic activity – better the Pause problem than the hit from a major El Nino. Just don’t tell the Chinese that the poison they’re inhaling is ‘taking one for the team’.
El Nino are temporary and minor. AGW is big and long term. El Ninos are just little practice drills for the real thing.
Mother Nature seems to feel that we did not learn the full set of required skills and mind set in the last El Nino.
However bad the next El Nino is, it will not as bad as what we will see on our BAU path toward AGW. We need to take the El Nino drills as a chance to learn that ANYTHING is better than BAU AGW.
Though a large spike in tropospheric temperatures is likely should an El Niño develop, this energy is mostly just latent and sensible heat coming from the IPWP. More interesting to me is how quickly this warm pool “fills back up” as it did after the 97-98 El Niño. With ocean heat content, including the IPWP, running at record high levels (literally off the chart), how much energy is released in this El Niño and how quickly it fills back in is of keen interest to me.
IPWP is usually International Parliamentarians for West Papua, but in this case you probably mean the Indo-Pacific warm pool.
This is quite obscure, and it is not in the acronym index on this site. It is worth spelling out.
We discussed El Ninos in my climate class, and our book suggested the same thing…that another occurrence is more than likely to happen. I also find it interesting that it was already up to 50% chance by March. Shocking. Let’s hope the world is prepared for an event of this magnitude.
@19,
Well maybe some latent and sensible heat is coming from the International Parliamentarians for West Papua!- but yes, by IPWP I meant the Indo-Pacific Warm Pool and sorry if the term seems obscure but it is well known by those studying ocean to atmosphere interactions and as such, is key to really understanding El Niño activity and the spikes in tropospheric heat El Niños can bring.
R. Gates, what are your best links for seeing and understanding the IPWP? Can you shed any light on Wayne’s question @ 7?
http://news.sciencemag.org/climate/2014/05/el-nino-coming-back illustration puzzles me — why is the temperature anomaly shown from “5” on the cold/blue end to “-5” on the warm/red end of the scale ?
For some reason Hank’s link does not work for me. I read that article last night. I think this is the illustration:
a slice of the ocean
Australia’s BOM produces this one, and the numbers look right.
Gopinathan Krishnan, you may be interested in Predicting Extreme Phases of the Indian Summer Monsoon, but you probably won’t enjoy these wet bulb comments.
@22, for starters see: http://www.aoml.noaa.gov/phod/regsatprod/ipwp/
May 2014 IRI Climate Forecast Briefing, climate briefing highlights (focus on ENSO) with Chief Forecaster Tony Barnston (2:23):
http://vimeo.com/95354413
You are there.
It is interesting that the El Nino has to be practically upon us before it can be forecast. Has the availability of data from the ARGO floats improved ENSO forecasting?
Milestones along the Charney Road
About a third of total realized AGW manifested within the twelve most intensive months of the ’97 – ’98 El Nino. An unlikely Second Coming of identical wallop this Fall, would just bring realized warming to pari passu with concentration enhancement.
The average global Hadley anomaly from 1890 thru 1924*: -0.553 F.
minus the average 5-yr Hadley anomaly from 2009 – 2013: +1.084 F.
Measured & Realized Warmth:………………………………….. 1.64 F.
9-97 thru 8-98 Hadley excess anomaly over prior 12 months: 0.55 F.
Summation (new ENSO as chicken counted before hatching) 2.19 F.
Charney assessed mid-range for 2X CO2…………………….. 5.40 F.
…. Summation as a fraction of Charney: ……. 219 / 540 = 41%
2013 CO2 concentration ………………………………………. 396 ppm
less……pre-industrial ……………………………………………280 ppm
anthropogenic carbon loading …………………………………116 ppm
……Loading as fraction required for 2X CO2: …… 116 / 280 = 41%
* The 35-yr crawling Hadley anomaly attained equipoise in 1907; thereafter late Holocene cooling ended and Global Warming first attained an ascendant influence.
robertscribbler now has a post on the predicted El Nino:
http://robertscribbler.wordpress.com/2014/05/16/deep-ocean-warming-is-coming-back-to-haunt-us-record-warmth-for-2014-likely-as-equatorial-heat-rises/
It includes an video interview with Kevin Trenberth who predicts a permanent 0.2 to 0.3 C rise in global average temperatures from the event, assuming a subsequent flip in the Pacific Decadal Oscillation from cool to warm phase.
When do we start attributing storm events to El Nino?
It is not officially here yet, but the increasing warmth across the tropical Pacific seems to be changing circulation to cause larger storm events along the US Gulf Coast and Atlantic Seaboard.
Can we attribute aspects of the Pennsacola storm and the more recent DC rain event to both AGW and El Nino?
Perhaps with AGW, we need to revise some of definitions. After all the background heat content of the oceans is changing faster now than it was back when we set up our definitions of El Nino.
re #31, Aaron Lewis
“When do we start attributing storm events to El Nino?”
I think that’s working in the wrong direction.
It is valid to examine the storm event and see if its cause can be reasonably determined, then what the causes may be, then assign probabilities to those causes rather than have a conclusion in mind and look for evidence to support it.
Here in NYC, for example, we had a massive, destructive hurricane which damaged over 50K homes and created storm tides up to 15 feet above normal.
That, of course, was the Great Hurricane of 1938.
Were that exact hurricane to hit again (somehow having the same incubating weather recreated), it would be over a slightly higher base sea level and thus the storm surge could move further inland, or over defenses which were not raised after ’38.
Would you ascribe the damage to the reincarnated hurricane or to today’s higher sea level, or some other cause?
There is already enough evidence to show that climate change is occurring and that it is anthropogenic. Emphasizing weather as evidence of climate only confuses the issue. *
* I do not know whether that is your intent, don’t take it personally.
Correction:
The ’38 storm tides were modest in NYC, but high and destructive at other points on the coast such an NJ, and in RI where it was amplified by funneling at coastal inlets. An awesome spectacle of Nature, provided you were not among the 600 or so people who were in the wrong place at the time.
BTW, I’m not sure if this is intended, but the graph of “Current Forecasts .. as of May 5” is continually updating. This may look a bit odd in a few years.
Aaron Lewis @ 17
“Mother Nature seems to feel that we did not learn the full set of required skills and mind set in the last El Nino.”
http://www.coris.noaa.gov/about/hazards/
El Niño can lead to increased sea-surface temperatures, decreased sea level, and altered salinity due to excessive rainfall (Forrester, 1997). During the 1997-1998 El Niño season, extensive and severe coral reef bleaching occurred, especially in the Indo-Pacific region, and the Caribbean. Approximately 70 to 80 percent of all shallow-water corals were killed on many Indo-Pacific reefs (NMFS, 2001). During the same year, coral reefs in the Florida Keys experienced bleaching events ranging from mild to severe (NMS, 2001).
Oh yeah, there’s also this thing called pH which affects ocean acidity and the carbon cycle of those very same coral reefs. Too bad most humans don’t grasp how logarithmic scales actually work.
I suspect that if we do have another sever El Niño we can say sayonara to many of the remaining tropical coral reef ecosystems.
Having had the opportunity to dive on coral reefs over the last 30 plus years, I will certainly miss them. As for the rest of humanity, you don’t have to worry about it, ‘Out of sight out of mind’… Just go shopping and everything will be just fine!
http://www.wunderground.com/blog/RickyRood/comment.html?entrynum=297#commenttop
“One reason there is so much discussion about the possibility of a colossal El Niño is the whole silly warming hiatus. The warming hiatus is the name given to the observation that the global surface temperature has not risen as fast as might be expected. The scientific investigation of the hiatus reveals that there are many things that might be viewed as extreme. Since the 1997-1998 El Niño, the eastern Pacific has remained cool, with strong tropical winds blowing from east to west piling up water in the western Pacific. As discussed in England et al. (2014), and in the blog I referenced above, these extraordinary winds have kept the eastern Pacific and, hence, the planet cool(ish). The amount of water piled up in the western Pacific is enormous and it is natural to imagine an event that might adjust to levels closer to long-term averages. Such a large shift in mass of the Pacific Ocean would be a large El Niño.
If there were such a large El Niño, then there would a large spike in the planet’s temperature. If this proved the end of the warming hiatus, then it would be dramatic in the realm of climate-change news. There are also other possible consequences, such as disruption of the patterns of oceanic and atmospheric heat transport that currently lead to the build up of Antarctic sea ice”
In possibly related news, and in line with GISTEMP, NCDC is reporting the warmest April on record:
http://www.ncdc.noaa.gov/sotc/
“The combined average temperature over global land and ocean surfaces tied with 2010 as the highest on record for April, at 58.09°F (14.47°C) or 1.39°F (0.77°C) above the 20th century average.”
In a ’round numbers’ milestone, April also marked the 350th consecutive month to show a positive GMST anomaly.
@#12, Shelema,
I agree with Chuck. Sooner or later, reality will catch up. Question is, what kind of a corner will we collectively be painted into by that time?
http://robertscribbler.wordpress.com/2014/05/22/global-sea-surface-temperatures-increase-to-extraordinary-1-25-c-anomaly-as-el-nino-tightens-grip-on-pacific/#comments
“On May 22nd, 2014, global sea surface temperature anomalies spiked to an amazing +1.25 degrees Celsius above the, already warmer than normal, 1979 to 2000 average. This departure is about 1.7 degrees C above 1880 levels — an extraordinary reading that signals the world may well be entering a rapid warming phase.”
That robertscribbler link Dio posted says:
I can’t tell if he’s arguing for
— a higher climate sensitivity number, or
— a higher variability, or f
— a change in trend, or
— something else
I don’t see the basis or reasoning for his wording in the cites he links on his page (the U. Maine link is the only one that seems likely).
Would someone familiar with El Nino comment on what he might mean?
http://www.skepticalscience.com/record-growth-co2-2013.html
SkS 22 May guest post on variability of the land carbon sink and generally higher CO2 atmospheric growth during El Nino events. A+ graphics.
Atmospheric CO2 record growth and El Nino watch.
Hank @#40: I took that comment to be a reference to the Trenberth interview video in the earlier RS post linked just below that quote: http://robertscribbler.wordpress.com/2014/05/16/deep-ocean-warming-is-coming-back-to-haunt-us-record-warmth-for-2014-likely-as-equatorial-heat-rises/
It could have been more clearly cited and articulated, but Trenberth does seem to be saying something like that there. It would be great to get reactions about his idea from others here. It does not seem to be a main stream view, but can it be ruled out?
It seems to be going without notice here, but suddenly the deniers are switching all their comments to RSS/UAH where this April is simply a “normal” April an not even in the top 10 on a number of large public sites where you see astroturfing going on.
Jan Galkowski #38,
“Question is, what kind of a corner will we collectively be painted into by that time?”
You might want to ask what kind of a corner have we been collectively painted into at present. Do we have ANY wiggle room left?
A little mosaic stone from the marine biogeography of the Sydney region, Australia:
Normally we have lots of Heterodontus portjacksonii, small horn sharks, convene in Sydney’s waters in early winter, where they congregate to mate. I have so far only seen 1 individual this year. Instead, we still, this time of the year, see lots of rather tropical species, which are at the very southern edge of their distribution range. Examples are several butterflyfishes, cornet fish, and tang (surgeonfish). The animal assembly definitely hints at unusually warm waters in the Pacific ocean this year.
El nino is a natural, the heat is from direct sun light not co2?
Dan @46.
That you employ a question mark is suggestive of you wanting an answer rather than making an assertion.
This graphic of the global energy balance is not controversial & shows only a third of the energy hitting the surface coming direct from the sun. Of course this is a global average but in principle I see no reason not to consider that some large percentage of the energy warming the tropical Pacific will be from ‘back radiation’ (for which CO2 will be partly responsible) and thus not “direct from the sun.”
Dan – if none of the oceans’ warmth comes from the greenhouse effect, approximately what would the average temperature of world’s oceans ocean be?
Dan, all the heat that matters is from sunlight – increased GHG reduce the efficiency of irradiation from the surface causing the temperature to rise. This includes heating the ocean. (for example see the Ocean heat content – graph of latest published measurements here.)
What this will mean is that a El Nina will have more effect on surface temperatures than a similar sized event in the past.
So yes, El Nino is a part the natural internal variability associated with unevenly heated, ocean-covered sphere, but increased GHGs mean oceans have more heat and the impact will be greater.
For “Dan”
Nope. Read down on this page:
http://blog.chron.com/climateabyss/2012/04/about-the-lack-of-warming/
Keep reading; when you get to the picture:
http://blog.chron.com/climateabyss/files/2012/04/1967withlines.gif
read the explanation below that, down to where that ends with: