Guest post by Sarah G. Purkey and Gregory C. Johnson,
University of Washington / NOAA
I solicited this post from colleagues at the University of Washington. I found their paper particularly interesting because it gets at the question of sea level rise from a combination of ocean altimetry and density (temperature + salinity) data. This kind of measurement and calculation has not really been possible — not at this level of detail — until quite recently. A key finding is that one can reconcile various different estimates of the contributions to observed sea level rise only if the significant warming of the deep ocean is accounted for. There was a good write-up in The Guardian back when the paper came out.– Eric Steig
Sea leave rise reveals a lot about our changing climate. A rise in the mean sea level can be caused by decreases in ocean density, mostly reflecting an increase in ocean temperature — this is steric sea level rise. It can also be caused by an increase in ocean mass, reflecting a gain of fresh water from land. A third, and smaller, contribution to mean sea level is from glacial isostatic adjustment. The contribution of glacial isostatic adjustment, while small, has a range of possible values and can be a significant source of uncertainty in sea level budgets. Over recent decades, very roughly half of the observed mean sea level rise is owing to changes in ocean density with the other half owing to the increased in ocean mass, mostly from melting glaciers and polar ice sheets. The exact proportion has been difficult to pin down with great certainty.
Knowing the proportion of sea level rise (SLR) owing to mass addition versus thermal expansion is not only important for quantifying total SLR. Each component also imparts information about the effects of climate change. First, the ocean absorbs over 90% of the excess heat from greenhouse gas forcing. In order to monitor and model global warming accurately, we need to know where and how much heat is entering the ocean, and which is directly (although nonlinearly) related to steric SLR. Sea level rise is an important consequence of climate change, and quantifying rates of melting of land ice, including contributions from the massive Greenland and West Antarctica ice sheets is vital to understanding sea level rise. Knowing local rates of past SLR and what is driving those rates will help to improve global and local projections of SLR that are essential for informing adaptation strategies in coastal communities.
Over the past two decades, revolutionary advances in the global ocean observing system have made it possible to estimate the relative contributions of mass and thermal expansion with increasing certainty. Since 1992 satellite altimetry has provided high-resolution measurements of sea surface height. These data are used to estimate local and global sea level variations. Since 2002, monthly large-scale variations in ocean mass have been estimated using data from the Gravity Recovery And Climate Experiment (GRACE), twin orbiting satellites capable of measuring very small changes in Earth’s gravitational field. GRACE data can be used to estimate variations in ocean mass either by measuring changes in gravity over the ocean or by measuring glacial retreat, melting of polar ice sheets, and changes in terrestrial reservoir storage. Finally, starting around 2005 the international Argo Program’s array of autonomous profiling floats first achieved sparse near-global coverage, allowing estimates of steric sea level changes in the upper half of the ocean using in situ measurements of ocean temperature and salinity. Thus, since around 2005, satellite and in situ observation systems have allowed for direct estimates of the total change in SLR, that owing to changes in ocean mass, and that owing to temperature (and to a lesser extent salinity) changes in the upper half of the ocean volume.
With these revolutionary developments in ocean observation, many researchers have been asking some obvious, but very important, questions. Does the total sea level change equal the sum of heating and mass changes within estimated instrumental error? If not, which measurement systems might be biased or incomplete? Is neglect of a deep steric contribution preventing the budget from closing?
In situ data deeper than the current 2000 m Argo sampling limit are the best way to address some of these questions. In the 1990s, for these purposes and others, international investigators working on the World Ocean Circulation Experiment (GO-SHIP) began to repeat a subset of these sections at decadal intervals. With the first decadal re-survey recently completed, we have investigated changes in deep ocean temperature and salinity in the bottom half of the ocean volume, around the globe between the 1990s and the 2000s. In our most their paper, we combine these full depth measurements of ocean steric changes with satellite sea-surface height data to evaluate the SLR budget, including any deep steric expansion, and make an estimate of the global ocean mass changes independent of GRACE data.
First, we interpolate satellite sea surface height data to the times and locations of these repeat sections to look at the total sea-surface height changes between repeats. We then calculate the difference of this total sea-level change and the full-depth steric changes from the repeat section salinity and temperature data. The result is the change in ocean mass between section occupations. Despite the very limited spatial coverage compared to Argo (Fig. 1), this method allows for statistically significant global average and seven regional averages of ocean mass trends because ocean mass variations in most ocean regions are comparatively large in spatial scale since small-scale mass fluctuations are very quickly evened out by ocean surface gravity waves. Most small-scale variability in local sea level is related to steric changes that are captured in the steric SLR integration and removed from the total. Globally, our mass trend estimate, centered on 1996–2006, is 1.5 mm per year, with large spatial variability.
Our GRACE estimate of SLR trend (from an averaging kernel) is also 1.5 mm per year for 2003–2013, although this method may produce a slight underestimate of the actual trend. Nonetheless, the results from the two independent methods agree well within their uncertainties (both 0.4 mm per year), despite the fact that these two different decadal estimates only have 3 years of overlap. Furthermore, the spatial variability among the seven regions also shows good agreement, with most falling within error bars of each other.
Both methods find that the South Atlantic and North Pacific are gaining mass the fastest, while the North Atlantic and Pacific sector of the Southern Ocean are either gaining little or no mass (Fig. 1). This regional variability in ocean mass trends can be attributed to a number of factors. In the North Pacific, the more rapid ocean mass addition has been attributed to large-scale changes in wind patterns over the ocean that affects the wind driven ocean circulation. These circulation changes will be reflected in sea surface topography, which is in part a reflection of shifts of mass from one region to another. The relatively large mass gain in the South Atlantic is most likely also attributed to local changes in wind stress, possibly affecting the Weddell Gyre or the Antarctic Circumpolar Current. The two regions with the smallest rates of mass increase are adjacent to Greenland or West Antarctica. These ice sheets are losing mass due to melt, thus losing some of their gravitational attraction, and causing an observable local decrease in sea level there as these waters are redistributed elsewhere.
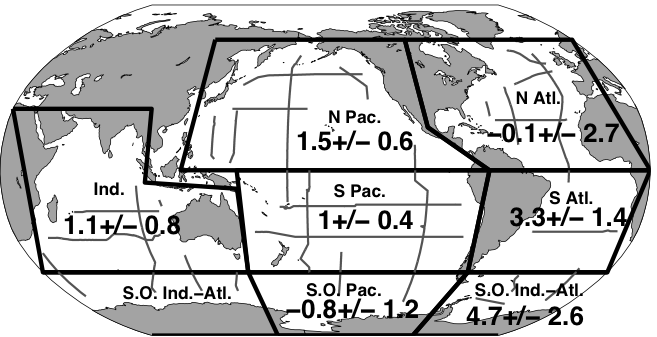
Figure 1: Mean ocean mass sea level rise (mm per year) in within each boundary (black lines) calculated using all full depth data available (gray lines). From their paper.
Because we are using full-depth steric data, we can estimate the contribution of deep ocean warming (hence expansion) to the sea level rise. If deep-ocean warming below 2000 m is ignored, it introduces 13% error into the estimate of the global ocean mass trend. Furthermore, if ocean warming below 1000 m is ignored, the ocean mass trend estimate using our method no longer agrees with that from GRACE within error bars.
This work highlights the importance of the deep ocean warming contribution to SLR. At the moment, the best direct estimates of these changes are using the spatially and temporally sparse but high quality and full-depth WOCE and GO-SHIP data sets to get basin-scale and global trends over decadal time-scales. To estimate regional evolution of deep-ocean warming and its contribution to SLR over shorter space and time scales requires an improved deep monitoring system. Currently, prototype profiling floats capable of measuring temperature and salinity all the way to 6000 m are being tested for a Deep Argo array (Figure 2). If enough of these floats are deployed, this new Deep Argo array, capable of measuring all but about 2% of the entire ocean volume, together with the current 0–2000 m Argo array, would allow for continuous monitoring of full-depth ocean heat uptake and hence steric sea level rise, both regionally and globally.
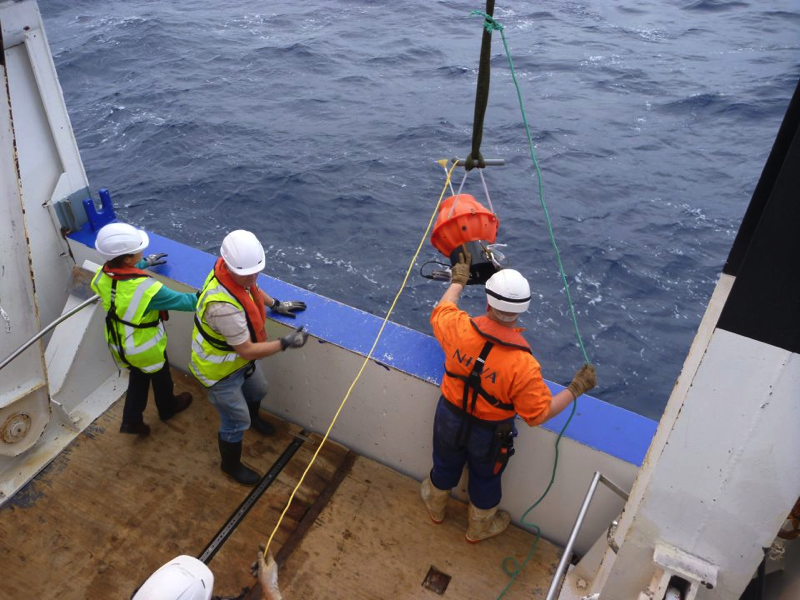
Figure 2. Deep Argo Float (a SOLO model from the Scripps Institution of Oceanography) being deployed from the R/V Tangaroa in the deep Southwest Pacific Basin in June 2014. Photo: LEARNZ (www.learnz.org.nz part of CORE Education www.core‐ed.org
References
- S.G. Purkey, G.C. Johnson, and D.P. Chambers, "Relative contributions of ocean mass and deep steric changes to sea level rise between 1993 and 2013", Journal of Geophysical Research: Oceans, vol. 119, pp. 7509-7522, 2014. http://dx.doi.org/10.1002/2014JC010180
- I. Joughin, B.E. Smith, and B. Medley, "Marine Ice Sheet Collapse Potentially Under Way for the Thwaites Glacier Basin, West Antarctica", Science, vol. 344, pp. 735-738, 2014. http://dx.doi.org/10.1126/science.1249055
- W. Llovel, J.K. Willis, F.W. Landerer, and I. Fukumori, "Deep-ocean contribution to sea level and energy budget not detectable over the past decade", Nature Climate Change, vol. 4, pp. 1031-1035, 2014. http://dx.doi.org/10.1038/nclimate2387
- K.E. Trenberth, J.T. Fasullo, and M.A. Balmaseda, "Earth’s Energy Imbalance", Journal of Climate, vol. 27, pp. 3129-3144, 2014. http://dx.doi.org/10.1175/JCLI-D-13-00294.1
- D.P. Chambers, and J.K. Willis, "Analysis of large‐scale ocean bottom pressure variability in the North Pacific", Journal of Geophysical Research: Oceans, vol. 113, 2008. http://dx.doi.org/10.1029/2008JC004930
- J. Bamber, and R. Riva, "The sea level fingerprint of recent ice mass fluxes", The Cryosphere, vol. 4, pp. 621-627, 2010. http://dx.doi.org/10.5194/tc-4-621-2010
Thanks for a succinct and informative summary of this important research. There were a number of striking points made. For me, the most curiosity-provoking was this: “…we need to know where and how much heat is entering the ocean, and which is directly (although nonlinearly) related to steric SLR.”
The striking thing about that was that significant word “nonlinearly”. Without much thinking about it, I’d more or less assumed something linear or close to it. Is there a concise way to characterize that nonlinear relationship for us? Or, failing that, to expand a bit on factors affecting the relationship?
Oh, there is one minor typo that I noted–“possible” for “possibly” in the 3rd-last paragraph, if anyone is feeling sufficiently fussy: “…possible affecting the Weddell Gyre or the Antarctic Circumpolar Current.”
Did you neglect land subsidience as potential apparent cause ofobservations of sea level rise? See Mississppi Delta and some south sea islands.
John Evjen, land subsidience is a highly local phenomenon that although important regionally has little to no bearing on mean sea level rise in general.
#2–John, their post more than adequately addresses what they did and did not consider, and why. Have you read it through? And did you think carefully about what you read?
“””””””The two regions with the smallest rates of mass increase are adjacent to Greenland or West Antarctica. These ice sheets are losing mass due to melt, thus losing some of their gravitational attraction, and causing an observable local decrease in sea level there as these waters are redistributed elsewhere. “”””””
That looks bizarre, and is a little difficult to understand for me; somebody could explain that with other words ?
John Evjen:
Did you actually read the post? It’s about research on global sea-level rise, using satellite altimetry and gravimetry to measure SLR, and water density measurements to estimate relative contributions of steric and mass-addition (i.e. water from melting land ice) components.
Local land subsidence, as in your examples, would affect local sea-level measurements (e.g. tide-gauges). It presumably has a negligible effect on global sea level as measured by satellite instruments.
[Response: Not “presumably”. It IS negligible.–eric]
Very interesting, thanks.
Typo alert: “In our most recent their paper”
Kevin #1 — layman’s guess: “nonlinearly” simply because thermal expansion coefficient varies with pressure, salinity and temperature?
Hi…great piece…more clear, succinct, worthwhile info in one short piece than I’ve seen total from other various articles…
getting this issue translated into the vernacular is critical…this is a good start…
add this and we’ll make some progress… http://shorelineearth.blogspot.com
Steve Smyth
So, the robust measurement average sea level rise currently give it 10 cm/century. Has waterworld been postponed, or there is a prediction of acceleration “in the pipeline”?
[Response: Actual sea level rise is more like 3 times that. And yes, acceleration is expected. – gavin]
Please clarify this:
“Globally, our mass trend estimate, centered on 1996–2006, is 1.5 mm per year, with large spatial variability.”
This means that the steric component is not included in this rate, correct? This is only mass increase due to ice melting?
If it is included, then it does not agree with GMSL computed by Cazenave set al. (2014).
Ken Miller, Rutgers
I think I’m stating the obvious, but the paper is paywalled. The steric contribution is the total sea level rise rate minus the 1.5 mm/year for the mass change component reported here. Thus the steric component is 3.3 mm/year-1.5 mm/year or 1.8 mm/year. http://www.aviso.altimetry.fr/en/data/products/ocean-indicators-products/actualitesindicateurs-des-oceansniveau-moyen-des-mersindexhtml.html
Correct?
For Jon Evjen: consider that less than 30 percent of planet Earth’s surface is land; the rest is ocean and a bit of ice here and there.
You can look up the areas where oil and water have been extracted, and yes, there’s subsidence well documented and some of it seems a big scary number on the vertical dimension, in human terms. Heck, California’s still mining water like crazy now, knowing that most aquifers, after they collapse, can’t un-collapse. That’s a one-time use. Water checks out, it never checks back in. Yet we suck.
Examples abound, including some under the ocean, e.g. http://en.wikipedia.org/wiki/Ekofisk_oil_field (there are several maps there).
On a map of the world, areas mined for water or oil — and the subset of those that are instances of compaction and sinking — are very, very small in comparison to the surface of the oceans viewed from satellites.
That’s why they say “negligible” above.
I know it sounds like dismissal or a brushoff if you haven’t looked at the numbers and the maps, to be told “that’s not a big enough number to matter” — the natural response is “why not?”
The trick here is, mostly, we amateurs (I’m definitely not a scientist) can figure some of this stuff out (and await correction) — we know where people have drilled and pumped out water and oil and gas, and we know where the surface has collapsed. It’s a big deal for those living on it, but not compared to the area of the ocean looked at in these recent studies.
These studies aren’t using measurements of sea level at the coastline.
As they say above,
That’s not height against the levee or seawall at New Orleans. That’s height from orbit over the broad expanse of the ocean.
Good news for Chinese ocean science — and a discussion of how data is collected and some of the problems with the old methods:
http://www.theguardian.com/environment/climate-consensus-97-per-cent/2014/nov/28/chinese-scientific-revolution-tackle-climate-change
Thank you Prof. Purkey and Prof. Johnson for many years of stellar work. I recall your paper from 2010 ( doi:10.1175/2010JCLI3682.1 ) showing significant abyssal (below 4000m) warming and freshening in the Southern ocean. I believe von Schuckmann ( doi:10.1029/2008JC005237 , 2009 ) also saw a freshening above 2000m in the Southern Ocean. Could this signal have anything to do with increased ice melt ? I do not suggest that the fresh water originated from the ice, but are there any plausible circulation changes that might have affected both ? I have in mind something like the wind driven intrusions of CDW onto the continental shelf, although i am hard put to extract a mechanism for freshening extending below 4000m.
sidd
Fritz,
Since water is a fluid, its surface will conform to minimum gravitational potential energy–that is, it will deform due to the local gravitational field, which is proportional to the mass present locally. That ice represents a whole helluva lot of mass, but since the mass is decreasing, water will flow away from the glacial regions as they melt. Make sense?
This would be better on the Unforced Variation thread, but we don’t have one for January yet, and this does respond to Hank’s #13. From that link comes this quote from John Abraham:
Now, that is a sad story–well, not the Chinese part.
Ray, the presence of seriously thick ice, in both Antarctica and Greenland complicates the view you offer- isostasy makes mile high ice sheets indent the Earth’s deformable crust, and the base of ice sheets that thicken over geological time can, as is spectacullarly the case under central Greenland , end up a kilometer below sea level– a lot of moulin water ends up in such inland depressions instead of flowing into the sea.
Still, there is hope for sea level rise mitigation, as long as you like chowder.
It is worth noting that University of Hawaii is studying divesting from fossil fuel companies. http://www.hawaii.edu/news/2015/01/08/uh-to-study-divesting-from-fossil-fuel-companies/
Thanks Ray ; if I follow your explanation, the remaining part of Antarctic must gain Ice and gravitational potential, as does the South Atlantic ( why?)
Prof. Steig, inline to my #6:
Thanks. I didn’t have a citation readily available, while you OTOH can say that with authority 8^)!
[Response: What I meant is that I cannot imagine it is anything but negligible. If I am somehow wrong, I am happy to be corrected. –eric]
A more relevant-to-this-topic quote from that article I linked:
I guess the only dumb question is the one not asked. So, why would the Indian and Atlantic sectors of the Southern Ocean be considered to act as one during the study period because of changes in the Weddell gyre? Would not the effect be proportional to the areas in question, thus allowing for observational differences?
#11 Chris Dudley
Here’s an ‘Accepted Article’ version:
https://informedgreencifers.files.wordpress.com/2014/11/jgrc20949.pdf
Think about what happens when the ice flows into the oceans on a rotating Earth. Where will the water go on a rotating sphere?
Russell,
Agreed, but these are second order effects, and the ground does rebound over time. The net change is still less mass at the poles.
Everett (#23),
Thank you. The first sentence gives global sea level rise of 3.2 mm per year. That makes it plain what they are doing.
This passage in this article starts to do it: “Over recent decades, very roughly half of the observed mean sea level rise is owing to changes in ocean density with the other half owing to the increased in ocean mass, mostly from melting glaciers and polar ice sheets. The exact proportion has been difficult to pin down with great certainty.”
But, this article never gets back the the proportion.
> this article never gets back the the proportion.
This article adds a third term, and so the proportion is different.
I could wish for a list of other possibilities that were considered and ruled out as possibly — whether individually or in combination — making some considerable change to the total.
/snark
Plastic garbage patch expansion, can that affect sea level? Spurious signals fooling the satellites, maybe?
You can be sure fans of other imaginative possiblities will be trying to come up with numbers that add up to a propitious sum that will suit their fancies.
While local land subsidence may have a negligible effect on SLR over decades to millenia, at 10- to 100-million year time scales the relationship of global sea level to continental drift is apparently well-established.
YMMV, but IMO the prospect of climate chaos within our lifetimes can’t detract from the wonder of geologic processes working in deep time.
What is the temperature measurement system in the Argo floats? How accurate and precise is it?
Hank (#27),
No, I think they are looking just at steric and mass contributions, seeking a better separation between them. I’m complaining about making it clearer that this is their over all object. They did this immediately in their paper, but have not been as plain in a popular article.
for Edward Greisch, in case this helps, LMGTFY
Short answer, as i read it after a few minutes’ “research” with ‘oogle:
it depends; as with other measurements using a variety of devices over the years, a lot of work goes into answering that question.
A bit from one early paper as just one example:
253 Journal of Oceanography, Vol. 60, pp. 253 to 258, 2004
Short Contribution
Stability of Temperature and Conductivity Sensors of
Argo Profiling Floats
(… 31 May 2003)
More than a decade later, they’re still working on improving this, e.g.:
A Preliminary Study on Quality Control of Oceanic Observation Data by Machine Learning Methods
(well worth a glance)
Pasting your question into Scholar and then limiting the results to recent years will give you a few solid hours’ reading if you want to go into that.
http://scholar.google.com/scholar?as_sdt=0,5&q=temperature+measurement+system+in+the+Argo+floats%3F&hl=en&as_ylo=2014
_____________
I’m not a robot (check)
I’m not a librarian (check)
I’m some guy on the Internets (check) (double check, could be wrong)
Nice article. Reading the title, though, I was hoping for a review of all the slr-relevant articles over the last year, with perhaps an estimation of what they spell wrt how fast and how far we might see sea levels rise in this century and the next.
Any chance that something like that might be in the works?
Or if it already exists somewhere, I’d be happy for a pointer in that general direction!
This Skeptical Science article states that sea level declined about 3 meters over the past 4-5,000 years due to sea floor subsidence. That is about 0.7 mm/yr. Is this subsidence correct (and continuing) and does it affect your calculations significantly? Should this be added to either the expansion or the mass increase number?
Related – Sea-level rise: What the experts expect https://www.realclimate.org/index.php/archives/2013/11/sea-level-rise-what-the-experts-expect/
What matters to society is RSL (coastal), not GSL. If the middle of the ocean increases faster than RSL, then this is of little policy importance. The global map showed a lot of the GSL was “out in the middle of nowhere” in the Indian ocean as I recall. The latest IPCC report had little to say about the connection between RSL and GSL, only that RSL is regional and varies. Most people assume that average RSL will rise at the same rate of GSL, but I wonder about that.
What seems to be a disconnect to me is that NOAA tide gauges seem to average ~2mm/year versus GSL estimates of ~3mm year. It suggests that RSL is rising slower than GSL, which would seem to be an important point. The increased volume isn’t making it to the coasts?
As for acceleration, almost all the NOAA gauges on their website show a very near linear trend, some going back 100 years or more at some locations. The JASON data shows a near linear increase over the past 20 years of ~3.2mm year and is supposedly calibrated to RSL tide gauges. The IPCC SLR models expected sea level rise to be 3.7mm/year at this point, and this 15% observational difference suggests the models have overestimated the rate of acceleration. There is no good explanation for this, there are theories it might be pause related, but it is noted that SLR did not pause with the temperatures from 1940 to 1970 according to tide gauges.
At what point would the SLR models be revisited if the discrepancies persist?
michael sweet:
Fascinating, I did not know about that. I want to thank Jon Evjen for raising an interesting question, whether he intended to or not!
Mal, not mentioned in that 2012 piece by Rob Painting is thermal contraction as a factor in that 4-5000 year decline in sea level. Global mean temperature has been slowly declining since the Holocene climate maximum of 5-6000 years ago, which is plenty long enough for that cooling to be integrated at least in part into the ocean, so some part of that sea level decline would be expected to be due to steric change, no?
> sea floor subsidence
Distinguish at least two very different forms there.
One, what Jon Evjen asked about: local subsidence like New Orleans experiences. That’s been very fast, as it has in similar places. New Orleans is sinking locally because of pumping oil and water out of the sedimentary basin:
https://www.google.com/search?q=%22new+orleans%22+groundwater+oil+pump+subsidence&ie=utf-8&oe=utf-8
Two, post-ice-age change, very slow, due to a mile or two of ice having melted off of one side of a very thick rigid solid piece of the Earth’s crust. There, areas tipped “teeter totter” fashion, one side sinking, under the ice cap; the other side, where there was no ice cap on it, tipped up during the ice age. When the ice melted ten or twelve thousand years ago, that tipped slab of crust tipped back toward its unloaded balance position.
Slowly. (Meanwhile of course meltwater was changing sea level quickly, and of course in some places the ocean advanced to replace the ice …. )
That’s an amateur’s offhand attempt at a simple summary; I await correction gladly.
In response to a couple of points made above, this article (titled “The Moving Boundaries of Sea Level Change: Understanding the Origins of Geographic Variability”): http://www.tos.org/oceanography/archive/24-2_tamisiea.html is a good introduction to the effects of GIA on local and global measurements of sea level. There are a number of other articles in that issue (all open access) that may also be of interest.
Reconciling local relative SLR and global SLR measurements is not trivial. For example, the east coast of the USA is sinking due to GIA, so trends in local, relative sea level there are, generally, higher than the global mean. On the other hand, RSL at Stockholm (under the Fennoscandian ice sheet during the last Ice Age) are negative (http://www.psmsl.org/data/obtaining/stations/78.php)!
There is also the fact that the ocean floor continues to sink due to the mass inflow into the oceans at the end of the last ice age. This means that satellite altimeter measurements (of ABSOLUTE sea level) do not reflect changes in ocean volume, which is the most meaningful quantity for many climate-related studies. There is an attempt to explain this concisely in: http://www.sciencedirect.com/science/article/pii/S0012825214000956 (also open access).
On another point that was made above, century-scale trend tend to be around 2mm/year as one poster pointed out. But time spans matter – if you do trends over the last 20 years for many of these gauges the trends over recent years are higher!
Neil
For those interested in the Gulf of Mexico’s past and future sea level trends see: Sea Level Change in the Gulf of Mexico – Davis Texas A&M Press (2010).
Neil,
Thanks for the info. I suppose GIA compensation is for the ocean basin theoretically getting larger (thus holding more water) due to a rebound from the last ice age and other effects.
As far as the 1 mm/yr GIA goes it seems to me this “doesn’t count” as far as policy goes as it doesn’t affect RSL (GIA is of interest if calculating ocean volume). This seems to be of academic interest only? It seems to me that for policy it should be 2 mm /year (and buried in the details volume is changing at 3 mm /yr) instead of 3 mm / yr (and buried in the details RSL is really just 2 mm / year). GIA doesn’t seem important for local policy.
The Australian data is interesting as it reports increasing SLR in the past few decades vs since 1960. However if you examine the entire records the SLR rates were even higher during the 1940’s than today. Comparing 1960-2013 vs. 1990-2013 in isolation without knowing what was happening in the 1940’s could give a false impression. As you say, time scales matter.
Examining all the NOAA tide gauge records individually on their interactive site:
http://tidesandcurrents.noaa.gov/sltrends/sltrends.html
One can come to the conclusion that there is no apparent (let’s say non-obvious) accelerating trend visually, the 50 year MSL trends don’t seem to be correlated well to temperature and in many cases SLR rates were higher prior to 1960 than today.
A mixed bag.
Here’s the first installment (“…This Elastic Earth”) of the the Skeptical Science article by Rob Painting, linked by michael sweet (#33):
http://www.skepticalscience.com/Sea-Level-Isnt-Level-This-Elastic-Earth.html
It has a schematic animation plus a global map of “vertical crustal motions in mm per year via GIA theory” (Glacial Isostatic Adjustment/postglacial rebound) based on Paulson (2007):
http://en.wikipedia.org/wiki/File:PGR_Paulson2007_Rate_of_Lithospheric_Uplift_due_to_PGR.png
Thank you, Michael Sweet. I think the point of the article is that “…the volume of the global oceans has remained static over the last 4-5000 years…” along with “…we can be reasonably confident that the current sea level rise of 3.11 mm per year is anomalous within the context of the last (roughly) 7-8000 years…” When paleo complexities are accounted for, current sea level rise remains anomalous.
Regarding measurements now, it says: “…even today satellite altimetry measurements have to be revised upward at a globally-averaged 0.3mm per year–to account for the subsidence (deepening) of the ocean basins…”
Sea-level curve of the eon: http://en.wikipedia.org/wiki/Sea-level_curve
Good piece in SkS on the general topic. “The Antarctic ice sheet is a sleeping giant, beginning to stir” by J. Abraham
https://www.skepticalscience.com/antarctic-ice-sheet-sleeping-giant-beginning-to-stir.html
Basically an overview of his recent article with Skambos of NSIDC: http://www.icevirtuallibrary.com/content/article/10.1680/feng.14.00014;jsessionid=24wva0tepb9h.x-telford-live-01
“Antarctic ice sheet mass loss and future sea-level rise”
DOI: 10.1680/feng.14.00014
The wikipedia graph is using older data. A better sea level curve can be found in Miller et al (Science, 2005; http://www.sciencemag.org/content/310/5752/1293.short). Sea level probably did not exceed more than 100-150 m more than modern, even in the Cretaceous.
#41–
– See more at: https://www.realclimate.org/index.php/archives/2015/01/diagnosing-causes-of-sea-level-rise/comment-page-1/#comment-623142
But it isn’t. RSL is spatially complex, as Neil made clear. I’ve never seen a number for “global Relative Sea Level Rise”, and I doubt I’m going to, given that it would a) be a pain to generate–since you’d have to collect, interpolate and weight RSL around the world’s coastlines–and b) of no utility whatsoever–since planners in Fennoscandia won’t give a rat’s ruckus what RSL in Boston or Bombay is, and the ‘average’ global RSL value would be no more useful.
If you are talking about a simple graspable number for SLR, there really isn’t an alternative to GSL.
No offense, but as far as I can tell, the “RSL is 2 mm/yr” idea is just something you yourself pulled out of the US tidal gauge record, and has no particular scientific imprimatur.
Peter Sinclair has commented that sea level rise serves as a thermometer, allowing us to measure the extra energy we are retaining due to the accumulation of greenhouse gases in the atmosphere. So, how well do the numbers discussed in this article accord with what one would expect as a result of our current energy imbalance? It would be nice to have an explanation in layman’s terms, as well as pointers to articles or papers supporting the layman’s explanation. Thanks.
Erica Ackerman @46.
I don’t think Peter Sinclair’s description of sea level as a thermometer is a very good one. (I don’t know if Sinclair says it any clearer than he does here.) Certainly Ocean Heat Content is where almost all of the extra AGW energy entering the climate system ends up so OHC is a very good measure of AGW. But that is not Sea Level Rise. If this energy ends up melting ice-caps and glaciers, that will result in about eighty-times more sea level rise than if it heated ocean waters.
If you really do want to use Sea Level Rise as a thermometer, there is a set of graphs in IPCC AR5 Chapter 13 (Figure 13.14) that shows the various ‘calibrations’. The caption is absent from this version of it but the rows represent (1) Ocean heating, (2) Glaciers, (3) Greenland, (4) Antarctica, (5) All sources totalled, and the left-hand graphs are the long-term rise, right-hand the rise after just 2000 years.
The ocean heating happens over a few hundred years and contributes 420mm/ºC (+/- 200mm). Melted land ice however contributes 1,900mm/ºC most of which (1,200mm/ºC) being Antarctica.
There is the complication that an extra 5,000mm sea level rise is caused by Greenland melting away when the temperature reaches a certain point, this melting requiring thousands of years. It is perhaps a bit of a worry that the temperature rise required to melt Greenland is only +1.5ºC (+/-0.5ºC). (And there are quite a few that consider that sea level rise could be a lot more dramatic than this Figure 13.14 suggests.)
Erica Ackerman’s question led me from Levitus(2012, doi:10.1029/2012GL051106) through Durack’s correction last year (doi:10.1038/NCLIMATE2389) and then back to this subject paper.
Levitus et al. had estimated an heat imbalance of 0.39 W/sq. m. per unit area for the world ocean (or 0.27 W/sq. m. when taken over the entire earth surface) for 0-2000m depth and the period 1955-2010. This corresponds to 0.54 +/- 0.05 mm/yr thermosteric component of SLR. (Most steric rise is thermosternic, salinity is small effect)
Durack(2014) corrected this number upward by 60% or so, for the period 1970-2004.
And now Purkey estimates 1.5 +/- 0.4 mm/yr for the mass contribution to SLR for 1996-2013. Naively subtracting this number from the 3.2 mm/yr quoted in her work for total SLR, we would get 1.7 mm/yr for the steric component, about three times as much as Levitus(2012) or about twice as much as the Durack corrected estimate. (Bear in mind these cover different time periods)
sidd
fritz. For all of us non-scientists, the best explanation I’ve seen of this extremely counter-intuitive idea (that a landmass losing ice will have a much lower local sea level and the rise in sea level will appear many thousands of kms away) is explained really well in Jerry Mitrovica’s presentation at Harvard a few years ago. Well worth watching and then rewatching a day or so later. https://www.youtube.com/watch?v=RhdY-ZezK7w
I’m not a scientist, and I’m still a little unclear on the implications of the work described here. Does this research answer the questions it points to in the 4th paragraph:
Is the “missing energy” that Trenberth and Fasullo talk about accounted for now?