Last week we proposed a bet against the “pause in global warming” forecast in Nature by Keenlyside et al. and we promised to present our scientific case later – so here it is.
Traducido por Angela Carosio
La semana pasada propusimos una apuesta contra el pronóstico en un artículo de la revista Nature “pausa en el calentamiento global” por Keenlyside et al. y prometimos presentar nuestro caso científico en otra ocasión, y aquí está.
[Read more…] about The Global Cooling Bet – Part 2
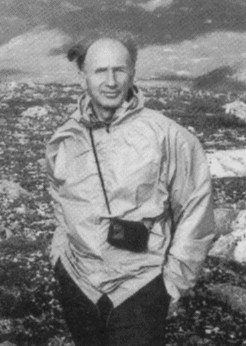 Many of you will have seen the obituaries (