By raypierre , with the gratefully acknowledged assistance of Spencer Weart
In Part I the long struggle to get beyond the fallacious saturation argument was recounted in historical terms. In Part II, I will provide a more detailed analysis for the reader interested in the technical nitty-gritty of how the absorption of infrared really depends on CO2 concentration. At the end, I will discuss Herr Koch’s experiment in the light of modern observations.
The discussion here is based on CO2 absorption data found in the HITRAN spectroscopic archive. This is the main infrared database used by atmospheric radiation modellers. This database is a legacy of the military work on infrared described in Part I , and descends from a spectroscopic archive compiled by the Air Force Geophysics Laboratory at Hanscom Field, MA (referred to in some early editions of radiative transfer textbooks as the "AFGL Tape").
Suppose we were to sit at sea level and shine an infrared flashlight with an output of one Watt upward into the sky. If all the light from the beam were then collected by an orbiting astronaut with a sufficiently large lens, what fraction of a Watt would that be? The question of saturation amounts to the following question: How would that fraction change if we increased the amount of CO2 in the atmosphere? Saturation refers to the condition where increasing the amount of CO2 fails to increase the absorption, because the CO2 was already absorbing essentially all there is to absorb at the wavelengths where it absorbs at all. Think of a conveyor belt with red, blue and green M&M candies going past. You have one fussy child sitting at the belt who only eats red M&M’s, and he can eat them fast enough to eat half of the M&M’s going past him. Thus, he reduces the M&M flux by half. If you put another equally fussy kid next to him who can eat at the same rate, she’ll eat all the remaining red M&M’s. Then, if you put a third kid in the line, it won’t result in any further decrease in the M&M flux, because all the M&M’s that they like to eat are already gone. (It will probably result in howls of disappointment, though!) You’d need an eater of green or blue M&M’s to make further reductions in the flux.
Ångström and his followers believed that the situation with CO2 and infrared was like the situation with the red M&M’s. To understand how wrong they were, we need to look at modern measurements of the rate of absorption of infrared light by CO2 . The rate of absorption is a very intricately varying function of the wavelength of the light. At any given wavelength, the amount of light surviving goes down like the exponential of the number of molecules of CO2 encountered by the beam of light. The rate of exponential decay is the absorption factor.
When the product of the absorption factor times the amount of CO2 encountered equals one, then the amount of light is reduced by a factor of 1/e, i.e. 1/2.71282… . For this, or larger, amounts of CO2,the atmosphere is optically thick at the corresponding wavelength. If you double the amount of CO2, you reduce the proportion of surviving light by an additional factor of 1/e, reducing the proportion surviving to about a tenth; if you instead halve the amount of CO2, the proportion surviving is the reciprocal of the square root of e , or about 60% , and the atmosphere is optically thin. Precisely where we draw the line between "thick" and "thin" is somewhat arbitrary, given that the absorption shades smoothly from small values to large values as the product of absorption factor with amount of CO2 increases.
The units of absorption factor depend on the units we use to measure the amount of CO2 in the column of the atmosphere encountered by the beam of light. Let’s measure our units relative to the amount of CO2 in an atmospheric column of base one square meter, present when the concentration of CO2 is 300 parts per million (about the pre-industrial value). In such units, an atmosphere with the present amount of CO2 is optically thick where the absorption coefficient is one or greater, and optically thin where the absorption coefficient is less than one. If we double the amount of CO2 in the atmosphere, then the absorption coefficient only needs to be 1/2 or greater in order to make the atmosphere optically thick.
The absorption factor, so defined, is given in the following figure, based on the thousands of measurements in the HITRAN spectroscopic archive. The "fuzz" on this graph is because the absorption actually takes the form of thousands of closely spaced partially overlapping spikes. If one were to zoom in on a very small portion of the wavelength axis, one would see the fuzz resolve into discrete spikes, like the pickets on a fence. At the coarse resolution of the graph, one only sees a dark band marking out the maximum and minimum values swept out by the spike. These absorption results were computed for typical laboratory conditions, at sea level pressure and a temperature of 20 Celsius. At lower pressures, the peaks of the spikes get higher and the valleys between them get deeper, leading to a broader "fuzzy band" on absorption curves like that shown below.
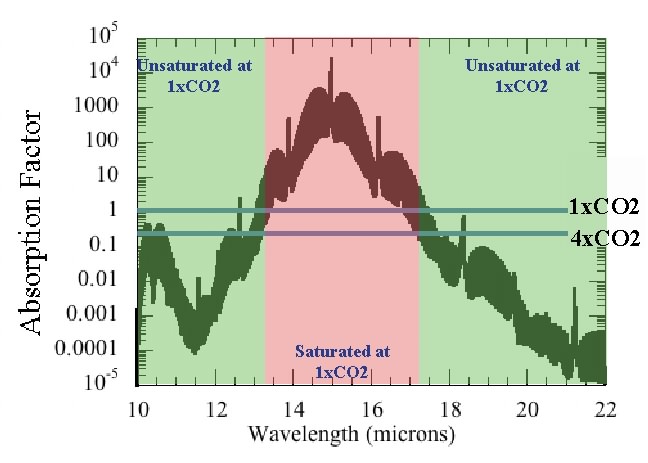
We see that for the pre-industrial CO2 concentration, it is only the wavelength range between about 13.5 and 17 microns (millionths of a meter) that can be considered to be saturated. Within this range, it is indeed true that adding more CO2 would not significantly increase the amount of absorption. All the red M&M’s are already eaten. But waiting in the wings, outside this wavelength region, there’s more goodies to be had. In fact, noting that the graph is on a logarithmic axis, the atmosphere still wouldn’t be saturated even if we increased the CO2 to ten thousand times the present level. What happens to the absorption if we quadruple the amount of CO2? That story is told in the next graph:
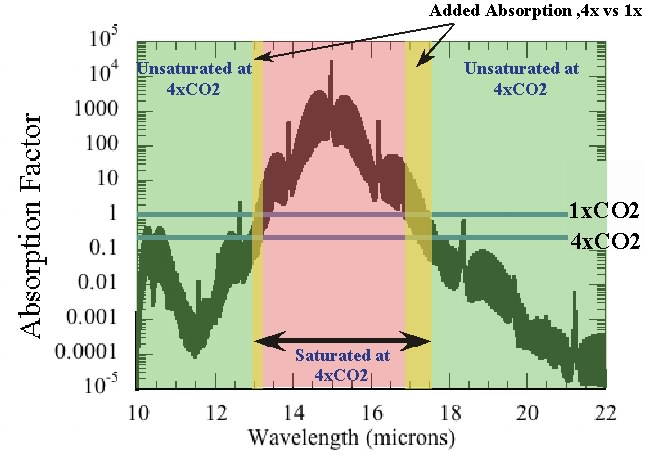
The horizontal blue lines give the threshold CO2 needed to make the atmosphere optically thick at 1x the preindustrial CO2 level and 4x that level. Quadrupling the CO2 makes the portions of the spectrum in the yellow bands optically thick, essentially adding new absorption there and reducing the transmission of infrared through the layer. One can relate this increase in the width of the optically thick region to the "thinning and cooling" argument determining infrared loss to space as follows. Roughly speaking, in the part of the spectrum where the atmosphere is optically thick, the radiation to space occurs at the temperature of the high, cold parts of the atmosphere. That’s practically zero compared to the radiation flux at temperatures comparable to the surface temperature; in the part of the spectrum which is optically thin, the planet radiates at near the surface temperature. Increasing CO2 then increases the width of the spectral region where the atmosphere is optically thick, which replaces more of the high-intensity surface radiation with low-intensity upper-atmosphere radiation, and thus reduces the rate of radiation loss to space.
Now let’s use the absorption properties described above to determine what we’d see in a typical laboratory experiment. Imagine that our experimenter fills a tube with pure CO2 at a pressure of one atmosphere and a temperature of 20C. She then shines a beam of infrared light in one end of the tube. To keep things simple, let’s assume that the beam of light has uniform intensity at all wavelengths shown in the absorption graph. She then measures the amount of light coming out the other end of the tube, and divides it by the amount of light being shone in. The ratio is the transmission. How does the transmission change as we make the tube longer?
To put the results in perspective, it is useful to keep in mind that at a CO2 concentration of 300ppm, the amount of CO2 in a column of the Earth’s atmosphere having cross section area equal to that of the tube is equal to the amount of CO2 in a tube of pure CO2 of length 2.5 meters, if the tube is at sea level pressure and a temperature of 20C. Thus a two and a half meter tube of pure CO2 in lab conditions is, loosely speaking, like "one atmosphere" of greenhouse effect. The following graph shows how the proportion of light transmitted through the tube goes down as the tube is made longer.
![]()
The transmission decays extremely rapidly for short tubes (under a centimeter or so), because when light first encounters CO2, it’s the easy pickings near the peak of the absorption spectrum that are eaten up first. At larger tube lengths, because of shape of the curve of absorption vs. wavelength, the transmission decreases rather slowly with the amount of CO2. And it’s a good thing it does. You can show that if the transmission decayed exponentially, as it would if the absorption factor were independent of wavelength, then doubling CO2 would warm the Earth by about 50 degrees C instead of 2 to 4 degrees (which is plenty bad enough, once you factor in that warming is greater over land vs. ocean and at high Northern latitudes).
There are a few finer points we need to take into account in order to relate this experiment to the absorption by CO2 in the actual atmosphere. The first is the effect of pressure broadening. Because absorption lines become narrower as pressure goes down, and because more of the spectrum is "between" lines rather than "on" line centers, the absorption coefficient on the whole tends to go down linearly with pressure. Therefore, by computing (or measuring) the absorption at sea level pressure, we are overestimating the absorption of the CO2 actually in place in the higher, lower-pressure parts of the atmosphere. It turns out that when this is properly taken into account, you have to reduce the column length at sea level pressure by a factor of 2 to have the equivalent absorption effect of the same amount of CO2 in the real atmosphere. Thus, you’d measure absorption in a 1.25 meter column in the laboratory to get something more representative of the real atmosphere. The second effect comes from the fact that CO2 colliding with itself in a tube of pure CO2 broadens the lines about 30% more than does CO2 colliding with N2 or O2 in air, which results in an additional slight overestimate of the absorption in the laboratory experiment. Neither of these effects would significantly affect the impression of saturation obtained in a laboratory experiment, though. CO2 is not much less saturated for a 1 meter column than it is for a 2.5 meter column.
So what went wrong in the experiment of poor Herr Koch? There are two changes that need to be made in order to bring our calculations in line with Herr Koch’s experimental setup. First, he used a blackbody at 100C (basically, a pot of boiling water) as the source for his infrared radiation, and measured the transmission relative to the full blackbody emission of the source. By suitably weighting the incoming radiation, it is a simple matter to recompute the transmission through a tube in a way compatible to Koch’s definition. The second difference is that Herr Koch didn’t actually perform his experiment by varying the length of the tube. He did the control case at a pressure of 1 atmosphere in a tube of length 30cm. His reduced-CO2 case was not done with a shorter tube, but rather by keeping the same tube and reducing the pressure to 2/3 atmosphere (666mb, or 520 mm of Mercury in his units). Rather than displaying the absorption as a function of pressure, we have used modern results on pressure scaling to rephrase Herr Koch’s measurement in terms of what he would have seen if he had done the experiment with a shortened tube instead. This allows us to plot his experiment on a graph of transmission vs. tube length similar to what was shown above. The result is shown here:
![]()
Over the range of CO2 amounts covered in the experiment, one doesn’t actually expect much variation in the absorption — only about a percent. Herr Koch’s measurements are very close to the correct absorption for the 30cm control case, but he told his boss that the radiation that got through at lower pressure increased by no more than 0.4%. Well, he wouldn’t be the only lab assistant who was over-optimistic in reporting his accuracy. Even if the experiment had been done accurately, it’s unclear whether the investigators would have considered the one percent change in transmission "significant," since they already regarded their measured half percent change as "insignificant."
It seems that Ångström was all too eager to conclude that CO2 absorption was saturated based on the "insignificance" of the change, whereas the real problem was that they were looking at changes over a far too small range of CO2 amounts. If Koch and Ångström had examined the changes over the range between a 10cm and 1 meter tube, they probably would have been able to determine the correct law for increase of absorption with amount, despite the primitive instruments available at the time.
It’s worth noting that Ångström’s erroneous conclusion regarding saturation did not arise from his failure to understand how pressure affects absorption lines. That would at least have been forgivable, since the phenomenon of pressure broadening was not to be discovered for many years to come. In reality, though Ångström would have come to the same erroneous conclusion even if the experiment had been done with the same amounts of CO2 at low pressure rather than at near-sea-level pressures. A calculation like that done above shows that, using the same amounts of CO2 in the high vs. low CO2 cases as in the original experiment, the magnitude of the absorption change the investigators were trying to measure is almost exactly the same — about 1 percent — regardless of whether the experiment is carried out at near 1000mb (sea level pressure) or near 100mb (the pressure about 16 km up in the atmosphere).
So how did they eventually discover the Beer-Lambert-Bouguet law? And pressure broadening? Inquiring minds want to know!
Sweet!
I had run across some of this elsewhere, but you are doing a better job at it by far. Anyway, weak absoption is a linear function of the column abundance before saturation at the peaks, strong is with saturation and works according to the square root, and very strong follows the Beer-Lambert. But I would assume that these are still approximations – and that the actual function applicable at all column abundancies would be would be a function of column abundance and ppm.
PS to my earlier post
In fact, it would seem that one could numerically derive a formula for sensitivity based upon the spectra for both carbon dioxide and water vapor spectra if given the function for water expansion, the shape of the land masses and the total amount of water. As this has not been done, I assume I am missing more than a little.
Hey Ray or Spenser;
Could you clarify the statement, “If Koch and Angstrom had examined the changes over the range between a 10cm and 1 meter tube, they probably would have been able to determine the correct law for increase of absorption with amount, despite the primitive instruments available at the time.”. It seems confusing as it would seem that the obvious explanation is simply due to the inverse square law. You assistance in seeing your point would be most welcome…
Dave Cooke
Is there a way to calculate the forcing where increasing concentrations of CO2 causing a feedback of increasing H2O evaporation yield an amplified forcing from the combination of CO2 and water vapor?
[Response: Yes. This is done all the time in simple one-column models of the atmosphere, such as pioneered by Manabe. Since you don’t have the dynamics that control water vapor in such models, you replace all that with a n assumption that the relative humidity remains fixed as climate warms. Thus, more water vapor goes into the atmosphere, leading to more greenhouse effect, and amplifying the initial effect of CO2. Dave Archer’s online model has an option to hold the relative humidity fixed as you increase the temperature of the atmosphere, which allows you to explore this feedback. –raypierre]
raypierre and Spencer Weart
Thank you very much. It works well for me.
Answer to my question in #3:
1. With climate sensitivity to CO2, you are also taking into account the albedo – and climate sensitivity is in the long-run.
2. Once you take into account the albedo and over the long-run, you are also dealing with ice melt;
3. You have to include convection as well as the distribution of the gases;
4. You have to deal with how the system evolves over time, which means convection both within the atmosphere and the ocean;
5. You have to take into account weather variability and non-laminar flow;
6. You have to take into account storms, including hurricanes – and we have difficulty modeling those.
In the case of hurricanes, our calculations based simply upon an understanding of convection and surface temperature would suggest that wind speeds would be considerably lower than they are, and it appears that water spray in essence lubricates the storm, permitting it to achieve higher speeds.
But once you took all of this into account, you might as well throw in the carbon cycle, vegetation (albedo), soil (albedo), cloud formation (albedo, etc.), evaporation from soil, the spectra for the sun and its luminosity, solar cycles, and once you do that you pretty much have the entire climate model, including how it evolves over time – or there abouts. And at that point, you really aren’t talking about climate sensitivity any more since climate sensitivity would hold the level of carbon dioxide in the atmosphere constant.
Geez! No wonder you guys need supercomputers and fairly big grids.
I’ve heard the pressure broadening being questioned.
This explains a mechanism:
http://en.wikipedia.org/wiki/Spectral_line#Broadening_due_to_local_effects
which is impacts during the emission process.
But the wikipedia explanation is for emission frequency broadening and not absorption frequency broadening which is relevant in our case?
At root pressure broadening is a reflection of the fact that a molecule’s quantum levels change when you bring another molecule close to it, within a few nanometers as a practical matter. At low densities, such interactions, or collisions only involve the radiator and its single collision partner. This is called the impact approximation, e.g. that collisions only occur between pairs of molecules. At high densities the models assume that the radiator is in a cage of other molecules, which may or may not have some short range order (this is equivalent to a liquid). In either case you have to consider the distribution of the change in the quantum state energies over time as the molecules move relative to each other.
Changing temperature changes the number of collisions per second, and to a limited extent the time over which the collision takes place (temperature broadening). Unlike lifetime broadening, which is the same for every radiator, pressure and temperature broadening are heterogeneous (each molecule sees a different environment).
Please include above that the Hitran database was started in the late 1960s. This is not very clear above. It lends some perspective.
Thanks,
[Response: I’m a little unclear myself as to the precise relationship between the “AFGL tapes” referred to in Goody and Yung, and the Hitran database itself, other than that they seem to contain similar information organized in a similar way. Of course, Hitran, now, is far more comprehensive than the AFGL tapes are likely to have been. Can you suggest a convenient reference giving some history of the Hitran database and how it came to Harvard? –raypierre]
Does the broadening work similarly for absorption and emission?
Thanks heaps for that explanation. I indeed got it wrong when trying to explain the CO2 saturation fallacy. At least I will now be a bit better equipped the next time it comes up.
RealClimate continues to be the standard reference for laypeople like myself.
RE #9 Eli Rabett
The cage – that would be due to van der Waals forces – inverse cube.
Lifetime broadening – due to the uncertainty principle as it applies to time and energy, the spontaneous decay from a higher energy state to a lower one – Lorentzian spreading.
Collision broadening – reduces the average lifetime of the excited state, and after numerous collisions results in what is called homogenous broadening. I would assume this is what you refer to as “pressure broadening.”
Doppler broadening – due to different molecules moving at different velocities. I would assume this isn’t significant for what we are dealing with here. Or would this be what you are refering to as “temperature broadening”?
Hi, Ray. I appreciate this good explanation of the greenhouse effect. I am trying to understand how radiation of longwave energy depends on the temperature of the atmosphere. This article says:
My understanding is that a greenhouse gas is not a black body, so the Stefan-Boltzmann law does not apply. I have also been told that re-radiation of absorbed radiation is in quantum units. Can you please explain why the colder greenhouse gases at the top of the troposphere radiate less than warmer gas further down?
Is it correct to say that if there was no lapse rate, ie. the atmosphere was the same temperature all the way up, there would effectively be no greenhouse effect because it would radiate at the same temperature as the surface of the Earth? Or that if temperature increased going up the greenhouse effect would be negative, meaning it would cause cooling?
[Response: To answer your last question first, it is basically true that if there were no lapse rate there would be no greenhouse effect. If there weren’t any turbulent transfers at the ground, you could technically get a greenhouse effect from an isothermal atmosphere if there’s a temperature jump between the ground and the atmosphere, but turbulent transfers in practice limit this effect. (In this statement, I’m putting aside exotic cases like the scattering greenhouse effect on Early Mars from dry ice clouds, which can indeed work in the absence of a lapse rate). As for the earlier part of your query, even though greenhouse gases are not blackbodies, Kirchoff’s law still applies. That means that the emission is the product of an emissivity/absorptivity coefficient (that’s where your quantum effects come in) and the Planck function. The Planck function goes down with temperature, for any give frequency, and there you are. –raypierre]
raypierre
thanks for your response to #5. it obviates my semi objection in the “Saturated Gassy Argument” post comments completely. We really need simple answers like that (keeping relative humiditiy constant) now that are based on fundamentals.
I shudder to think what would happen if getting people to understand GHGs involved having them understand Pauling’s resonance model.
mz @ 8 and 11:
Yes, the broadening effect works for both emission and absorption. The Wikipedia article you pointed to is about spectral lines, and at other points in the article they note that “spectral lines” applies to both absorption and emission. (I’m guessing whoever wrote the text in the broadening sections is more used to thinking about emission spectra, and so got lazy and kept referring only to emission.)
When the product of the absorption factor times the amount of CO2 encountered equals one, then the amount of light is reduced by a factor of 1/e, i.e. 1/2.71282…
Minor quibble: I think that should be written as “reduced by a factor of e” (i.e. Flux_final = Flux_initial / e). “Reduced by a factor of X” usually means “divided by X”, so “reduced by a factor of 1/e” implies “divided by (1/e)”, which isn’t what you want to say…
[Response: If you think this bit of stylistics is confusing, you should have seen us trying to figure out whether “auf” in Angstrom’s paper (as in CO2 reduced “auf 2/3”) means “by 2/3” or “to 2/3”; fortunately we were able to double-check with Stefan. Prepositions are semantically tricky, even for native speakers. That’s why, given my druthers, I prefer equations to words. –raypierre]
Ray,
I agree with you that Angstrom was wrong in saying that increasing the amount of CO2 in the atmosphere would not raise the surface temperature, but his experiment is pretty convincing with a 50% increase in the amount of CO2 hardly altering the absorption.
The current models have the greenhouse gases radiating in their bands with the same intensity that they absorb, but the greenhouse gases lose most of that excitation by collisions to other air molecules. It defies the Law of the Conversation of Energy for the lowest layer of the atmosphere to warm the air, as it does every day, and also radiate back to Earth the same energy it has absorbed. Shouldn’t we be looking for another way in which CO2 can affect the climate, such as that suggested by Callendar.
IMHO, what really happens is that the radiation is absorbed in the first 30 m of the atmosphere, with a rate of absorption that decreases exponentially with height, just as the Beer-Lambert law predicts. If you then double the CO2, you will half the height of this layer, with the result that the warming from the CO2 will be concentrated in a smaller volume causing more heating. The heated air will rise, preventing the CO2 from re-emiting the energy it has absorbed to the surface.
However, the maximum absorption is at the surface of the Earth, (e.g. bottom mm. or 0.1″.) Therefore it will cause more evaporation, leading to more water vapour which is also a greenhouse gas. Moreover, it will also cause more melting of ice, and this will change the planetary albedo. In this way, higher CO2 levels lead to snowline rising in altitude and latitude, and so is how CO2 levels are linked to ice ages.
But, just as the absorption from the surface is saturated, so is the radiation emitted at the top of the atmosphere. Increasing CO2 cannot emit more radiation. In order for the planet’s climate to stabilise, if it loses ice albedo, then it will warm until there is an increase in albedo due to the formation of new clouds.
When the Arctic sea ice melts, then the change in albedo will be so great that it could cause a radical change in the atmospheric circulation before it settles into a new regime where there is adequate cloud cover to produce climate stability.
Stephen Weart described how the US Air Force saved the day by finding that the absorption bands were thinner at high altitudes. That sounds almost like a 1950’s cowboy movie with the US Cavalry coming over the horizon to rescue the heroine. However, I suspect that “The Day After Tomorrow” is closer to the truth, with a lone scientist who knows that disaster will strike, but no one will listen to him!
Alastair, what’s special about the bottom millimiter or 100 mils? Why not the bottom micron, or even the bottom angstrom. Indeed, let us go all Zeno-esque and show that Earth’s surface cannot radiate at all. Only one thing wrong–reality isn’t cooperating, and indeed IR radiation in the CO2 band does make it to the stratosphere, and even escapes to space. The usual response when evidence conflicts with theory is to modify the theory accordingly.
[Response: There’s nothing wrong with the theory. The theory, as embodied in radiation models, is in extremely good agreement with all available observations. I don’t think Alastair has managed to understand either my post or Spencer’s. I don’t understand how Alastair could still be talking about all the absorption happening so low down, if he had understood the wavelength dependence of absorption in the graphs I showed. It’s very frustrating. I worked hard to make this stuff perfectly clear, but evidently I have not succeeded. –raypierre]
raypierre (inline comment to #19) wrote:
The important thing is that the radiation at the lower levels has to make its way up through higher levels of the atmosphere before it is able to escape into space. It will be absorbed and re-emitted numerous times, and each time it could be re-emitted either towards space or torwards the ground – but ultimately it has to escape. But to escape, it must pass through the level where the atmosphere is dry and the effects of carbon dioxide dominate.
I am not sure why some have difficulty with this, but it is an easy principle to keep ahold of once you grasp it.
Alistair:
Aha! This is exactly the response I feared someone would have to this. First, Koch’s experiment was poorly designed and badly interpreted. Second, it ignored positive feedbacks. We are not dealing with an experiment with the correct measurements of the tube, carefully recorded, and with relative humidity kept constant.
The correct answer is, therefore, that Koch’s experiment is completely unconvincing because he didn’t account for differences between surface level and the upper radiant levels, didn’t measure precisely because he didn’t understand the importance of small differences in absorption over time – which you have because excess C02 lingers, and didn’t understand the importance of small differences in C02 and small but persistent increases in temperature because he didn’t account for water vapor’s response to temperature and pressure changes.
As a piece of the overall puzzle this is a tremendous post. Maybe my favorite on Real Climate so far.
Re #14: Thanks, raypierre, for your response. I don’t understand how the Planck function, which is about black body radiation, affects a greenhouse gas. Is it basically the same, except there is only one frequency of radiation instead of the black body distribution? If a cold greenhouse gas absorbs a photon emitted from the ground, and emits at a lower intensity, where does the rest of the energy go?
If the greenhouse depends on the the temperature of the gas that radiates into space, that implies all the other events of absorbing and re-radiating longwave radiation are of no ultimate consequence for determining the temperature of the Earth. But when a greenhouse gas aborbs radiation, it is either transformed into kinetic energy (ie. warms the local air) or is re-radiated. Some of this re-radiated energy should reach the ground and warm it. This process appears to be independent of the temperature of the air. I am having a hard time connecting this with your description. There are still a few pieces of this puzzle that I am missing.
[Response: The radiation is not independent of temperature, since the emitting molecules and the photons are interacting with each other and forming a kind of equilibrium. If you accept Kirchoff’s law for the moment, that tells you that the emission is the absorption coefficient times the very same Planck function B(nu,T) that governs blackbody emission. The statistical mechanics behind this is very tricky, because it’s not a true thermodynamic equilibrium. A very turgid derivation is given in Goody and Yung. If you like, you can just take Kirchoff’s law as a well-established experimental fact. That’s indeed how early investigators hit upon blackbody radiation to begin with. They weren’t measuring actual blackbodies, but rather were measuring the ratio of emission to absorptivity of various stuff, and finding that the ratios fell on a universal curve that depends on frequency and temperature but not on the stuff. That curve is what we would now call the Planck function, and it increases monotonically with temperature at any given frequency. Where I’m sympathetic with Alastair is that people take Kirchoff’s Law far too much for granted. It’s extremely well confirmed experimentally, but its conceptual foundations, though basically put on a sound footing by Einstein, are very, very subtle. They have bedazzled such greats as the mathematician David Hilbert. –raypierre]
Alastair McDonald (#18) wrote:
Adiabatic expansion increases the distance between CO2 molecules giving them more time to relax. That is why the center of the band isn’t saturated. Additionally there is always some spreading, even if it is only due to the lifetime broadening which results from the uncertainty principle as applied to time and energy.
This is a very nice article. I really enjoy seeing abstract concepts in physics explained so that most laymen can grasp the essentials of what’s being explored. It’s been decades since I was a physics undergrad, but I managed to understand the essentials fairly well.
Thanks.
Raypierre and Alastair–that’s precisely the theory–Alastair’s theory–that I’m trying to get Alastair to see doesn’t hold water.
Alastair, I don’t mean to be dismissive. I just can’t see where you get the idea that absorption–which is isotropic–and emission–also isotropic–gives rise to a one-way opacity to IR radiation in the lower atmosphere. While the CO2 absorption lines are far from saturated in the upper atmosphere, they are still flattened a bit in the peak–that right there tells me that the IR getting through is not insubstantial.
Marion,
I sympathise strongly with Ray. I too work hard to make my ideas clear, but seem to have little success :-(
It is highly unlikely that Dr Koch failed to keep his relative humidity constant. He was using pure CO2. See: http://docs.lib.noaa.gov/rescue/mwr/029/mwr-029-06-0268a.pdf Moreover, the saturation of greenhouse gases had already been discovered by Tyndall. See:
The Bakerian Lecture: On the Absorption and Radiation of Heat by Gases and Vapours, and on the Physical Connexion of Radiation, Absorption, and Conduction
John Tyndall
Philosophical Transactions of the Royal Society of London, Vol. 151, 1861 (1861), pp. 1-36
Ray claims that his diagrams of bandwidth broadening show that the radiation is cascaded through the troposphere, but to me that seems an unreasonable conclusion to draw. It is true that bandwidth broadening will widen the lines, but for it to make much difference Ray has had to postulate a 400% increase in CO2. At present with less than 40% we are seeing global warming.
Moreover, when a line is broadened it happens at all altitudes. The effect is that the bandwidth at the bottom level then becomes the width one level up, and the width at one level up is then at level two. In other words, if we ignore the bottom level nothing has changed. Therefore the bottom level is where the real change is happening, and so the main increase in absorption will there, QED.
But more importantly, carbon dioxide only makes up about 400 parts per million of the atmosphere. Doubling the amount of CO2 will not double the number of collisions a CO2 molecule receives. In fact it will make practically no difference at all, since here we are considering pressure broadening, and the global surface atmospheric pressure can only change if the mass of the atmosphere changes. Adding another 400 ppm of CO2 to the atmosphere will hardly change the mass of the atmosphere!
Moreover, the low concentration of CO2 in the atmosphere also shows why the current models are wrong. When the CO2 is excited, some of that energy is converted to heat. But the heat goes mainly into N2 and O2 molecules which do not re-radiate the heat. They convect. Therefore the energy of radiation absorbed by the greenhouse gases is not re-radiated back to Earth. It is carried high into the atmosphere by convection, and then is radiated from below the tropopause either by exciting CO2 molecules or from the tops of clouds.
Although the radiation to space is from the same region in both schemes, in my scheme the surface global warming is driven by effect at the surface, not ten miles away by a belt of air with a density of only 1% of that at the surface.
As I explained in my talk in Stockholm on 12 september 2006, Knut Ångström measured CO2 absorption on Mount Teide on Tenerife using solar radiation (with the Wien peak in the visible light), which means that the near infrared CO2 absorption bands hardly have any contribution to the absorption.
http://home.casema.nl/errenwijlens/co2/angstrommodern1.gif
He used a measurement instrument with two tubes: one with air and one with CO2, and measured the differerence in absorption. Of course he couldn’t measure a difference with this crude method.
http://home.casema.nl/errenwijlens/co2/angstromfig1.gif
That’s why Knut Ångström claimed the CO2 spectrum was saturated.
[Response: It’s true that most of Angstrom’s paper (which is available from the link we gave in Part I) dealt with absorption of solar radiation. There is, however, the almost throwaway reference to Herr J. Koch, who did indeed do the experiment for thermal IR. It was Koch’s experiment that was picked up by Monthly Weather Review and used to argue for saturation. –raypierre]
“…the atmosphere still wouldn’t be saturated even if we increased the CO2 to ten thousand times the present level.”
Doesn’t this mean that the amount energy absorbed is very, very small for a given increase in concentration for these bands?
Shouldn’t we be concerned with the bands that are more readily absorbed, you know, that give the molecule the characterstics that make them green house gasses?
Re #25 Ray (Ladbury)
When a gas is in LTE then the absorption and emission is isotropic, but when Milne came up with the idea of LTE he wrote “This permits us to see in a general way why the state of local thermodynamic equilibrium in the interior of a star breaks down as we approach the surface.” My point is that plantary atmospheres have two surfaces; interior and exterior. Where the surface of the Earth is radiating into the atmosphere, the radiation is unidirectional. The same is true at the top of the atmosphere where the outgoing longwave radiation to space is also unidirectional.
BTW. Don’t confuse region emitting from the TOA with the non-LTE region. The non-LTE region does not emit net long wave radiation. It just gets hotter!
Alastair McDonald (#26) wrote:
(emphasis added)
It is at the bottom level that water vapor dominates. It absorbs virtually all of the longwave which is available at that level. Therefore adding carbon dioxide at that level will have a miniscule effect. However, the stratosphere is a completely different matter. The stratosphere is very dry, and for this reason CO2 dominates in the stratosphere.
How do individual molecules “convect”? As I understand it, thermal energy is random kinetic energy and as such will be isotropic. What can convect is an air mass. And whatever thermal energy might be lost due to some collisions can also be gained by other collisions? Can it not? And it wouldn’t have to be the same CO2 molecule losing energy as gains it. In addition, the greater the altitude, the lower the air density, the fewer the collisions.
But the extensive set of observations of upwelling and downwelling radiation does not fit into your scheme. It fits mainstream theory. And the troposphere is responsible for only three quarters of the mass of the atmosphere – not ninety-nine percent. The rest of the atmosphere is above it. Beyond this, why is distance such a large factor in your view – if the stratosphere is in all directions?
Perhaps if you showed climatologists a little more patience and took time to better understand why they believe the things they do – no matter how silly they may seem – you would stand a better chance of showing them the errors of their ways. But your current approach hardly seems productive.
First, Alistair, we have to be clear what we’re discussing. I was not talking about Angstrom’s solar radiation measurements, even though you mentioned Angstrom’s experiment being conclusive, since it’s Koch’s experiment, as stated above, that was mainly used to argue for saturation. The post is called what Angstrom didn’t know, after all, so that must be the point of confusion. When you wrote “he used pure C02” that explained it to me. But in fairness, how do you square that one (tube of air, tube of pure C02) with “I agree with you that Angstrom was wrong in saying that increasing the amount of CO2 in the atmosphere would not raise the surface temperature, but his experiment is pretty convincing with a 50% increase in the amount of CO2 hardly altering the absorption.”? I think pure C02 is a little more than a 50% increase in the amount. Angstrom’s comparison was a point of data, not necessarily “crude” but also not really an experiment. It established what it established.
I believe what we mean by keeping relative humidity constant is just that – an experiment where you mimic the actual response of water vapor by keeping the atmosphere in the tube at the same relative humidity.
The thing that makes Koch relevant is his measurement of IR. Had raypierre been around then, I believe he would have recommended that Koch: measure very, very precisely and do numerous trials; use a longer tube.
And I wanted to add that a key factor for both angstrom and koch low-balling the importance of C02 concentration was not just that they didn’t fully envision conditions where energy radiates away, but that they weren’t modeling positive water vapor feedback (the magnitude of which but not the existence is still being hashed out). Water vapor is important because it’s an amplifier. C02 is important because it’s a tiny but persistent ratchet. Even if they had been right, and raypierre is showing nicely why they weren’t, the only change would be the scale and time frame of human-assisted warming, not the fact of it.
Ray ladbury:
Given what Timothy Chase said just above, I would put your “doesn’t hold water” right up there with tamino’s observation that “urban islands of liberalism” skewed the data, masking the truth of Gavin’s “sunspots cause Republicans” theory.
More seriously, I think this issue just needs more diagrams.
Aaron (#28) wrote:
Each doubling of carbon dioxide raises the temperature by roughly 2.9 degrees Kelvin. But this additional carbon dioxide isn’t absorbing energy which is somehow left over and hasn’t been absorbed before – its absorbing the same energy more times. The temperature of the system rises as the result of each parcel of energy staying within the system for a longer period of time – which means that the more times it is absorbed and re-emitted, the higher the temperature will be.
However, that wasn’t quite the issue that Ray was considering I believe. He was thinking of the issue of spreading or “broadening.” Higher temperatures and pressures will result in the broadening of the band so that it is able to absorb over a wider range of wavelengths. And even in the case of an isolated molecule, there will be some spreading – “lifetime broadening” as the result of the uncertainty principle as it applies to time and energy. (This was covered in the essay.) But there are other points which could be brought in, even with respect to the centerline.
I don’t know.
What do you have in mind?
It might help, though, if you checked to see whether or not the essay already dealt with it or at least some aspects of it.
Is there a good link(s) to publicly available literature (no charge preferrable) that shows the agreement between calculated and observed atmospheric IR emission spectra looking up or down or both, or at least some observed spectra that can then be modeled at the Archer site? The spectra I have calculated there seem quite reasonable, although I’m not sure his use of a constant tropospheric lapse rate, especially in the tropics, is completely justified. But then it is a radiation only model.
RE #30 Timothy,
You wrote “But the extensive set of observations of upwelling and downwelling radiation does not fit into your scheme. It fits mainstream theory.”
I know of no set of observations of upwelling or downwelling radiation taken within the atmosphere. If you know of any I would be extremely grateful if you could tell me where to find them.
You also wrote “And the troposphere is responsible for only three quarters of the mass of the atmosphere – not ninety-nine percent. The rest of the atmosphere is above it. Beyond this, why is distance such a large factor in your view – if the stratosphere is in all directions?”
You are quite correct that the troposphere forms only 70% of the atmosphere, but my point was that the density of the air at 10 miles is only 1/100 of that at the surface. Of course the tropopause is at 10 km rather than 10 miles so I was exagerating. Moreover I believe that the height from which the radiation is emitted to space is at only 6km. That still means that the density of the air in that region will be much less than at the surface. In effect you have the tail wagging the dog! You can get some idea of the air density from this web page which shows air pressure, which is effectively the same thing.
http://www.metoffice.gov.uk/education/secondary/teachers/atmosphere.html#main
[[Moreover, the low concentration of CO2 in the atmosphere also shows why the current models are wrong. When the CO2 is excited, some of that energy is converted to heat. But the heat goes mainly into N2 and O2 molecules which do not re-radiate the heat. They convect. Therefore the energy of radiation absorbed by the greenhouse gases is not re-radiated back to Earth. It is carried high into the atmosphere by convection, and then is radiated from below the tropopause either by exciting CO2 molecules or from the tops of clouds. ]]
Alastair, I think your mistake is in thinking that because the nitrogen and oxygen don’t radiate, there’s no radiation from a given level at all. The nitrogen and oxygen will collide with the carbon dioxide and the carbon dioxide will radiate. The net effect is that just as much is radiated as is received, once conduction and convection are accounted for.
In #33 Timothy says:
First, I think it should be 1.2 K, because the 2.9 K is after various feedbacks which are a separate issue. But the point I want to make is that the model presented here (and many other places), of warming the atmosphere each time longwave radiation is absorbed and re-emitted, seems to me to be in conflict with radiation balance model presented by Raypierre, where the key factor is the temperature of the greenhouse gas molecules that radiate into space, usually high in the atmosphere.
If both of these ideas are valid, I would like to understand the connection between them.
[Response: It’s not the “residence time” of energy in the system that counts for warming. In the end, what counts is the rate of escape out the top, for a given surface temperature. The greenhouse effect lowers that rate (for any given surface temperature) by replacing high temperature radiation from the ground with lower temperature radiation from aloft. That happens partly through “new” absorption of radiation that more or less used to escape directly from the surface, as well as absorption and re-emission of radiation that used to get absorbed and re-emitted at lower layers, but now (at higher CO2) does so at higher layers. It just confuses the matter to try to think of the heating the way Timothy is. For example, in the troposphere, the net infrared absorption-emission is a cooling effect, which balances convective heating. Does that mean that CO2 is cooling the troposphere and that it would get warmer if you took it out? No, of course not. There are dangers in thinking about local budgets of that sort. –raypierre]
So what I’m getting is: additional solar absorption is negligible (but exists), GHGs reabsorb heat in the IR bandwith radiated from the earth causing a slight warming because it takes longer to reach an equilibrium.
What is magnitude of this effect, as describe I would assume it were very slight. Most of what my flawed view of the GHG effect that gave it credibility was that it absorbed more solar energy which would require the atmosphere to heat until it radiated more energy.
The mechanism described above is missing something, mainly a link to temperature increase. I don’t see how it can cause an imbalance of the magnitude described. How much can increased CO2 concentration really slow reemission?
[Response: As far as warming of the surface goes, you can forget about solar absorption in the atmosphere. It’s there, but it’s a sideshow, and the greenhouse effect would work perfectly well in an atmosphere that was completely transparent to solar radiation. The effect has nothing to do with changes in the time it takes to reach equilibrium. Increasing CO2 increases the temperature even once you reach equilibrium. CO2, and other greenhouse gases, work on the “energy loss” side of the equation — infrared loss to space — not on the “energy gain” side (absorption of solar radiation). It’s just like putting on a blanket. Putting on a blanket doesn’t make you feel warmer by generating new heat. It makes you feel warmer by reducing the rate at which you lose heat to your environment. Same thing with greenhouse gases. The very same thing. I don’t know why you’d have the intuition that this is “a pretty small” effect. How can you have any intuition about it without having done the numbers? I don’t think this is the sort of thing to which the word “intuition” applies. The quantitative effects of CO2 on absorption are just too far outside what can be gleaned from common experience. One can have prejudices or preconceptions — like the prejudice that most early scientists had that humans were just too small to be able to change something as big as the global climate. That’s a prejudice that Lindzen and many other misguided people still have today. I hasten to add that I’m not by any means tarring you with the same brush, or indeed with any brush. I do want to make the point, though, that one should distinguish between a prejudice and an intuition. –raypierre]
Re: #35 (Alastair McDonald)
The density of air at 10 miles is about 1/10 that at the surface, not 1/100. The very graph you link to shows this.
Blair Dowden (#37) wrote:
Of course – I was writing in too abbreviated a manner. Actually I waivered on whether to use on figure or the other while trying to keep things short. Too short, it seems. But there has been at least one time where I brought up the amplification carbon dioxides’ effect by water vapor, and if I didn’ explain that the feedback had feedback, that became an issue for someone else – and I was trying to avoid that aspect of it. As Raypierre says, “there are many wrinkles.” Or as I like to think of it, “The way that can be spoken…”
And that is appreciated.
Honestly, I wasn’t thinking of the radiation heating the atmosphere each time it got absorbed and re-emitted – since its not that kind of radiation. But I was thinking in terms of a residence time while at the same time realizing that this could only be an approximation of sorts. It seemed an appropriate response to the apparent view that each photon gets absorbed only once – and that was what heated up the atmopshere. But you are right: the fundamental principle is that of radiation balance, and I probably should have brought it back to that.
Yeah, got all that. But a blanket doesn’t raise your body temperature and it won’t give you a fever. If you’ve lost heat, it will help you get back up to temperature faster, but it doesn’t actually warm you.
You can tar away, I don’t mind. I fall into that group (though I’m not a scientist, I just like the topic), but I’m not trying to pick a fight (I believe we do affect the climate, I just see no evidence that we are in any dangerous way). I’m just trying to learn.
I want to believe.
[Response: Really, no tar implied. You did well to spot the imperfection in the analogy. What makes the blanket/person analogy imperfect is that the absorption of solar energy by the earth remains nearly constant as you increase the CO2 (put on the blanket), whereas for a mammal’s body can adjust its metabolism. In practice, putting on the blanket allows you to maintain body temperature with less expenditure of calories. The blanket analogy does work properly for a person on the verge of hypothermia, since then their metabolism is going flat out to try to maintain body temperature but can’t do it, so core temperature drops, leading to bad consequences; putting on the blanket raises body core temperature back to survivable values. In my experience, the blanket analogy is the most accessible way to get across that CO2 warms the planet by making it harder for the planet to lose heat — by putting on a layer of insulation. If anybody can suggest a better analogy that gets around the metabolism problem, though, I’d be very grateful. –raypierre]
Alastair McDonald (#35) wrote:
Unfortunately, they don’t have an extensive library all in one place on the web, at least that I am aware of as of yet, and much of the material which is there is by subscription. However, performing a search for either “‘downwelling radiation’ altitudes” or “‘upwelling radiation’ altitudes” on Google will bring up quite a few hits. 629 and 941 respectively. Much of the data we get is at the surface, other satellite, but a fair amount appears to be from planes. I see twenty- and sixty-second intervals being mentioned, above and below cloud platforms, polarization, etc.
There is obviously a great deal of data out there, whether one is talking about measurements of radiation, the size of thermokarst lakes in Canada, the levels of carbon dioxide at thousands of different stations, measurements on the flow of water and nutrients in the ocean using various markers, etc. We aren’t speaking of a discipline which lacks data, which consists of only of arm-chair theorizing or which is likely to be overturned by the same.
raypierre (inline to #38) wrote:
You overestimate me, sir.
Honestly, I wasn’t even thinking in terms of local budgets, but how, for the system as a whole, the level of energy within that system may remain at a higher level than it would without the greenhouse effect. But in any case, “residence time” (which is more or less what I was getting at) would be a concept more apt to confuse than enlighten – although it does help at least initially to realize that the energy stays within the system for a longer period of time. In essence, greenhouse gases result in a longer queue. The energy going in is balanced by the energy going out – once the equilibrium is reached, but the amount within the system at any given moment is higher than it would be without the greenhouse gasses, hence the higher average temperature.
Basically the “blanket” model.
However, the problem (as I understand it) with local radiation budgets which you brought up isn’t simply that we are treating the local conditions in isolation from the global system, but that we would be looking at the radiation budget without considering convection, evaporation, condensation, etc. No part should be regarded in isolation from the rest of the system, but more importantly, no aspect should be treated in isolation form the others.
And so what we will generally look for is a simple framework for analysis through which we consider each relevant aspect where this framework can be applied anywhere within the system – at least for the purpose of understanding what is going on at specific points within the sytem. But in terms of being able to calculate the trajectory of the system as a whole, given all of the interactions, one will have to perform for the whole, taking into account all of those interactions. No single element exists in isolation from all the rest.
Nothing particularly profound, but for someone only a little more lost than myself, it might help.
Raypierre, in your response to #37 you said “…in the troposphere, the net infrared absorption-emission is a cooling effect, which balances convective heating.” I wonder if you could expand on how that works. I suspect that the idea of the greenhouse effect heating the air is not just simplistic but also misleading.
Alastair McDonald had asked where you can get the empirical data for downwelling and upwelling longwave radiation (#35) since I had said that such data is extensive (#30). I suggested a couple Google searches (#42), but what would appear to be one of the better and more organized repositories would be “The Atmospheric Radiation Measurement (ARM) Program.”
At the following two links, they describe in some detail the data they have, where the measurements are being taken (via satellites, ground-based, or planes, etc.), although they want you to pay to get the actual data.
Downwelling longwave irradiance
http://www.arm.gov/measurements/measurement.php?id=downlwirrad
Upwelling longwave irradiance
http://www.arm.gov/measurements/measurement.php?id=uplwirrad
The website itself will give the visitor a better idea of what kind of data is out there and how extensive it is.
Blair Dowden (#44) wrote:
The surface and lower troposphere loses much of its heat due to moist air convection, but given that the stratosphere is extremely dry, the loss of heat in the upper troposophere must be due to something else: outgoing longwave radiation, I would presume.
Something along these lines is suggested here:
7 Dec 2004
Why does the stratosphere cool when the troposphere warms?
gavin
[edit URL]
Of course I would also be interested…
[Response: Actually, that was a good example of the weeds one can get stuck in on this subject. A better discussion is found here: https://www.realclimate.org/index.php/archives/2006/11/the-sky-is-falling/ – gavin]
Re #45 Timothy, Thanks for those two links.
If anyone else happens to know where I can get the information for free please let me know. The problem with paying, is that I don’t really know what I am getting until it is paid for :-(
FWIIW I suspect that the data does not exist because when the experimenters measured radiation they found that it did not match the models and so concluded that their data was wrong and did not publish!
At least Christy and Spencer were brave enough to publish :-)
[Response: Alastair, that’s really going too far. There is a figure in Goody and Yung showing the old Tiros top of atmosphere spectra that confirms the standard picture of radiative transfer. There are airborne FTIR observations looking down, shown in Liou’s textbook. There are Mars Global Surveyor TES spectra that confirm the models (I put one of those in Chapter 4 of my book, in the real gas section). The CKD paper on the water vapor continuum verifies the radiative transfer calculation against field observations. Looking upward from the ground, you can find even more data. There’s all of Dan Lubin’s upward looking FTIR data, both in the tropics (the CEPEX experiment) and in the Arctic. If it sometimes seems like there’s a paucity of downward looking spectral data covering the whole thermal IR, it’s because there really aren’t any serious scientific issues left to settle. Most spectrometers being flown look at narrow spectral windows with very high resolution, because that’s where the good science is right now. –raypierre]
Alastair McDonald (#47) wrote:
Well, I usually can’t afford a new pair of socks…
Well, I dug around a little more, and I found something that might be just the sort of comparison you are looking for — although you need to keep in mind that this is for spectra resulting from the3 influences of clouds and aerosols – which are considerably more difficult to model than clear sky. Additionally, these are from a few years ago: 2000-1.
Climate Forcing by Clouds and Aerosols: Two Years of Field Studies
http://geo.arc.nasa.gov/sgp/radiation/rad1.html
I will see if I can find some more stuff along these lines in the next few days.
Alistair McDonald – “FWIIW I suspect that the data does not exist because when the experimenters measured radiation they found that it did not match the models and so concluded that their data was wrong and did not publish!”
OR the published data is correct. I guess if you really want to believe in something you will invent all sorts of things. William of Occum said something long ago about multiplying entities and you are multiplying them a bit here. Unless you have measurements of your own that refute the published ones I think we can all assume that they are correct within current knowledge.
More comparisons of modeled vs measured spectra may be found here…
CAVE Publication List
http://www-cave.larc.nasa.gov/cave/pages/bibliog.html
This one contains a few:
Introduction to an Online Coupled Ocean-Atmosphere Radiative Transfer Model (2002)
Zhonghai Jin, Thomas Charlock, and Ken Rutledge
http://www-cave.larc.nasa.gov/cave/pdfs/Jin.AGU02.pdf