Arctic sea ice watch
A few people have already remarked on some pretty surprising numbers in Arctic sea ice extent this year (the New York Times has also noticed). The minimum extent is usually in early to mid September, but this year, conditions by Aug 9 had already beaten all previous record minima. Given that there is at least a few more weeks of melting to go, it looks like the record set in 2005 will be unequivocally surpassed. It could be interesting to follow especially in light of model predictions discussed previously.
There are a number of places to go to get Arctic sea ice information. Cryosphere Today has good anomaly plots. The Naval Sea ice center has a few different algorithms (different ways of processing the data) that give some sense of the observational uncertainty, and the National Snow and Ice Data Center give monthly updates. All of them show pretty much the same thing.
Just to give a sense of how dramatic the changes have been over the last 28 years, the figures below show the minimum ice extent in September 1979, and the situation today (Aug 9, 2007).


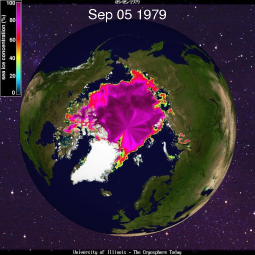
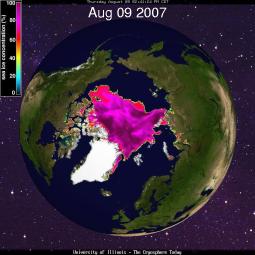
The reduction is around 1.2 million square km of ice, a little bit larger than the size of California and Texas combined.
Update: As noted by Andy Revkin below, some of the discussion is about ice extent and some is about ice area. The Cryosphere Today numbers are for area. The difference is whether you count 'leads' (the small amounts of water between ice floes) as being ice or water - for the area calculation they are not included with the ice, for the extent calculation they are.
Update: From the comments: NSIDC will now be tracking this on a weekly basis.

10 August 2007 at 8:17 AM
One thing that’s important is to track what someone is measuring. Chapman/Walsh at UIUC focus on ice AREA while NSIDC estimates ice EXTENT. That’s one reason they have different findings at the moment.
But everyone I talked to yesterday (Claire Parkinson, Mark Serreze, Walsh/Chapman, etc) agreed we’re in for a remarkable year. Polar bears and Arctic shippers beware.
More on the implications here:
http://topics.nytimes.com/top/news/science/series/thebigmelt/
10 August 2007 at 8:20 AM
I went on record last year - as an outside observer, of course - that summer Arctic sea ice will be gone completely within 5 years.
Granted, that is not a scientific observation. It is more of a gut feeling that all of the conditions which contribute to the melt will continue to strengthen.
Important to remember is that temperature will rise most rapidly in the polar regions, thus magnifying the overall effect. Also, the Arctic is an albedo-intensive region, and as the albedo rapidly shifts from positive to negative (do I have that right? From reflecting to absorbing), the pace of the melt must quicken.
Would I be correct to conclude that the re-freeze each winter actually creates less ice than the year before? Perhaps the area is roughly the same, but the depth would be less, correct? Thus, the next summer’s melt can be even more rapid because there is less ice to melt.
I see this as a self-enhancing feedback process, which is why I say that it will be extremely rapid.
My question has been: what will the naysayers say when the Arctic, for brief periods, is essentially ice-free?
Hmm?
“Well, that’s not a bad thing. Look, now we have easier shipping lanes. Anyway, these things are cyclical.”
In other words, it will be proof of something, just not AGW.
Question for “group”: Will these observations regarding the rapidity of the melt lend any knowledge to the predictions of how quickly land-based ice might be set loose? We hear talk that the breakup of land-based ice could be much more rapid than previously speculated. Does the Artic sea ice melt inform that understanding in any way?
10 August 2007 at 8:33 AM
This shouldn’t really be a surprise; I wrote this on April 12th:
What about the coming seasons? Last summer’s level was just above the record low. There was some recovery during the Autumn, but then the Winter level was also close to a record low. Normally, a less anomalous Winter would be expected to follow a Autumn ‘recovery’, but this year it didn’t happen that way. It is also worth noting that the period of maximum extent was in late February, rather than the more normal March, implying an earlier than usual shift in the seasonal influence. Given the already low level of Winter ice, the early onset of the thaw season, and the recent trends, it is reasonable to forecast that this year, the sea ice levels in the Arctic will hit a new record low. This is my prediction for the coming seasons. I have not mentioned other factors such as the Arctic Oscillation and Sea Surface Temperature Anomalies, though they have been considered in this forecast. The AO is broadly neutral at the moment, but may be shifting phase; the SSTAs are positive. Both of these influences are consistent with a forecast of low ie levels this year.
You missed out the PolarView/Damocles site, which is also excellent, and the graphics magnify really well. There’s a link on my blog (sorry!).
I’d like to ask if the areas of thin ice/open water to the north of N. Greenland and Ellesemere Island are unprecedented? Is there any record of there being open water here?
Regards,
10 August 2007 at 8:34 AM
I need some perspective on this. What was the Arctic Ice extent in the 1930s? What was the extent during the Medievel Warm Period?
10 August 2007 at 8:37 AM
Each year the Arctic sea ice meltback appears more dramatic and prompts the obvious discussions on causes.
I have tried for a year to persuade scientists to start a discussion on effects.
For openers, it is obvious the greater expanse of open water eliminates more area of old ice. The new ice will be thinner, melt sooner and more easily break up with storm and wave action. So, it will be no surprise that the 2008 season will be a repeat of or surpass the 2007 meltback.
But, what impact is that greater expanse of open ocean having on temp and precip in Western North America and more specifically in the world’s grain belt.
The National Academy spent more than a year researching and publicizing abrupt climate change. Is it not of equal or, IMO, greater importance, to begin to answer the question: are we building the ethanol industry in a future dust bowl?
The Arctic meltback has a great deal more to do with how the world will be fed than how polar bears will survive.
10 August 2007 at 8:45 AM
Re: Walt,
What you are saying is very logical in most likely going to be correct.
The re-freeze each winter will result in the ice depth getting thinner
and thinner and also the edges of the polar region to shrink as well.
From the 1960-1980 the rate of ice loss each decade was on average 1.4%,
now in 2007 it is 7.8%. It is safe to assume that in the coming decade the
loss of ice will escalate to 30-40%. So that probably well within 20 years
we will have no permanet ice at all in the polar region. It’s a positive
feedback mechanism.. the less ice and more dark coloured ocean the more
heat that will absorb, melting even more ice…etc. The great oceanic conveyor
is in real danger of slowing or stopping completely plunging europe, russia, china
and canada and north america into a snap ice age.
If everybody acted in a way as if thier lives depended on it(which it does)
things would change..fast! Trouble is no one still seems to give a shit!
10 August 2007 at 9:03 AM
Climate Deniers = Climate Dodos
“The Dodo (Raphus cucullatus) was a flightless bird that lived on the islands of Mauritius. Related to pigeons and doves, it stood about a meter tall (three feet), lived on fruit and nested on the ground.
“The dodo has been extinct since the mid-to-late 17th century. It is commonly used as the archetype of an extinct species because its extinction occurred during recorded human history, and was directly attributable to human activity. The phrase “as dead as a dodo” means undoubtedly and unquestionably dead.” — Wikepedia
10 August 2007 at 9:05 AM
Re: Walt, hmmm? if the great oceanic conveyor was to cease and down to the temperate latitudes were to
freeze up…logic says that the polar ice cap might well return to normal thickness..or thicker? I’ll pass this to the
group to discuss, they probably have more insights than me on this thought.
There is ample evidence that the greenland ice shelves and glaciers are retreating and the pack ice thinning. Again the higher the temps in the region more of the rock beneath the greenland ice is exposed to the sun and the hotter it gets and will no doubt exellerate the rate of land ice melt raising sea levels.
10 August 2007 at 9:09 AM
Re: #6
“If everybody acted in a way as if thier lives depended on it(which it does) things would change..fast!”
Lawrence,
Dr. Hansen is one of the most vocal of those who say that there is no way to quickly reverse the effects of AGW. Too much future warming has been built in.
Things will get much worse before they get better, if we completely stopped adding to atmospheric CO2 today (which we can’t, and which the world won’t be able to do for at least a decade, more likely several decades).
So, that’s a bit of fantasy on your part.
However, “visuals” such as this should - SHOULD - get people to start hopping down off the fence, so that perhaps we can keep my estimate at the low end.
Perhaps.
10 August 2007 at 9:33 AM
Re #8 where Lawrence wrote ‘… if the great oceanic conveyor was to cease and down to the temperate latitudes were to freeze up…logic says that the polar ice cap might well return to normal thickness..or thicker?’
That is obviously correct, therefore it could not have been the halting of the oceanic conveyor (THC) that caused the rapid climate changes at the start and end of the Younger Dryas. It was the formation and disappearance of sea ice in the North Atlantic. The sea ice stopped and restarted the THC, not vice versa.
The Arctic ice will not be able to reform this winter, because the climate in the Arctic will have been changed from pseudo-continental to maritime. Thus next summer, without any ice to reflect the sun away, the Arctic and the whole of the northern hemisphere will warm considerably, and the subsequent rapid climate change will lead to global famine since the farmers will have planted the wrong crops.
What will the nay-sayers say then - they will blame the scientists!
10 August 2007 at 9:45 AM
If anyone is interested in seeing what is happening at the North Pole NOAA have two web cameras there:
http://www.arctic.noaa.gov/npole/2007/images/noaa2-2007-0803-065437.jpg
Unfortunatly this one is sinking:
http://www.arctic.noaa.gov/npole/2007/images/noaa1-2007-0804-010717.jpg
For more pictures go to http://www.arctic.noaa.gov/npole/index.php?year=2007
10 August 2007 at 9:45 AM
Folks:
The National Snow and Ice Data Center (NSIDC) will be posting our first of a set of discussions and figures on 2007 sea ice conditions today (Friday, August 10). We’ll be providing updates each week (or as conditions warrant). We did this last year and got a lot of positive feedback.
10 August 2007 at 9:47 AM
Walt..i didn’t mean the climatic situation would change fast..as you said there is still 40+ years of all the pollution we have been emmitting to impact us..what I meant was public attitude would change fast. People would protest governments like never before for doing nothing..did I say George Dubblya? I mean if people realized this is life or death, things on a governmental and private sector level would change in the blink of an eye. Then if it isn’t already too late, the climate in maybe 80-100years time will slowly stabilise back to normal (for the last million years). Then if all the antacids people have been taking for climatically induced stress were dumped into the oceans their ph would resort to normal as well..
10 August 2007 at 9:58 AM
Are we whitnessing albedo flip (Hansen et al) right now? The graph from simulation runs (Hollan/Bitz/Tremblay) shows a dramatic drop once 4 million km2 september mean ice extent is broken. At this pace we will enter september well below threshold lining up for a dangerously low monthly mean.
10 August 2007 at 10:04 AM
Any answer to #4?
10 August 2007 at 10:22 AM
Re #4 VirgilM, Check out the website:
http://nwpi.krc.karelia.ru/climas/Ice/Ice_no_sat/XX_Arctic.htm
It is much lower now than in the 1930’s.
The medieval warm period was not as warm as it is now, based on Coral records and other proxies. So, it is unlikely that the ice extent was anywhere near as low as it is now.
Why did you ask? If your interest is genuine you could find out the information yourself. I found the the above web site in 3 minutes. The second point, there were no satellites in the medieval warm period! I would suggest Lonnie Thompson may have more definitive work regarding that question.
The people who run this web site are very professional and honest and do not peddle “spin”.
They seem to be so busy with the like of you they rarely answer my questions.
10 August 2007 at 11:11 AM
I believe the topic of a shut-down of the ocean conveyor belts has been exhaustively discussed in prior posts at this forum and the conclusion was it ain’t gonna happen.
So, the trend will be more warming in the northern lats.; there ain’t gonna be an ice age for northern europe; and the arctic ice cap is going.
10 August 2007 at 11:27 AM
As I’ve tried to point out before, there is a secondary effect to be considered as the reduction of sea-ice extent continues. That is, the outflow of sea-ice and surface water from the Arctic Ocean into the Greenland Sea.
Each year, as the sea-ice melts, the surface water of the Arctic Ocean becomes freshened. That’s the result of salt rejection during the freezing process. That rejected salty brine tends to sink during the freeze season, adding to the Thermohaline Circulation. However, the fresh surface water that migrates into the Greenland Sea would tend to suppress the THC which has been seen to occur in that area. The net result may be a reduced THC overall and a shift in the path of the in flowing water from the North Atlantic. Should the sea-ice decline in extent continue, it is plausible that the flow or water into the Greenland Sea would increase and include more sea-ice than now passes thru the Fram Strait, as the sea-ice would no longer be the thicker, multi-year ice that is now seen in the area. The flow thru the Fram Strait continues along the eastern coast of Greenland, flowing into the Labrador Sea, which is another area of THC sinking. Thus, it is likely that the THC would be greatly reduced. There is also a flow of surface water and sea-ice thru the Canadian Archipelago into Baffin Bay and that transport would be much enhanced as the sea-ice cover is removed. These processes may already have happened in the late 1960’s, as seen in “The Great Salinity Anomaly”.
There are those who have claimed that there is no need to worry about a reduction or shutdown of the THC. I suggest that this year’s changes present strong evidence which questions this conclusion.
10 August 2007 at 11:27 AM
I am not an expert on the Arctic, but it is a whole lot more interesting place than these posts suggest.
First, normal sea water sinks as it cools, and thus normal ocean water freezes from the bottom up. Arctic sea ice includes a lot of freshwater that normally floats on the Arctic Ocean. Under the fresh water on its surface, the Arctic Ocean contains layers of warmer, saltier water, with very cold, very salty water in its depths.
When the Arctic sea ice melts, it opens the surface water to mixing by storms, thus allowing the surface waters to become warmer and saltier. The additional salt in the surface waters means that they are likely to sink (into and through the warmer middle waters) as they cool rather than freezing at the surface.
Thus, loss of Arctic sea ice not only changes the albedo of the Northern Hemisphere, it opens up a whole Pandora’s box of interesting physics.
Here, that means that the arctic stops being a desert, and becomes a huge latent heat engine. Think about how much more lake effect snow is now being produced down-wind of Lake Erie, now that Lake Erie has a shorter freeze season, and think about the effects of less ice in the Arctic.
10 August 2007 at 11:30 AM
re question from #2 Walt B.: “Will these observations regarding the rapidity of the melt lend any knowledge to the predictions of how quickly land-based ice might be set loose?”
As I understand it, there is some similarity in the mechanisms. As sea water is darker than ice, so melt pools on the top of Greenland and Antarctic ice darken the surface. Also, warmer ocean water melts ice shelves from below, making them thinner, but the main thing here is a separate matter: they are then more likely to break up and “uncork” the land glaciers behind them. Even more different from the ocean situation, an important possible mechanism on land is that meltwater will sink to the bottom and lubricate glacier flow, speeding it up.
Overall, I’d say that if Arctic Ocean ice disappears faster than expected, it will not tell us a lot about land ice, but it should reinforce the concern that we do not fully understand nonlinear effects that could make everything, not just land ice, change faster than current models predict.
10 August 2007 at 11:48 AM
The New York Times article missed a little something, which was Siberia had a warm winter/Spring, with especially warm air aloft over that region, as to compared with the Canadian Arctic region. Which I was observing with fascination…
10 August 2007 at 11:52 AM
Anybody know where one could find a composite graph of total global sea ice extent? I mean, there seems to be a million sq km positive sea ice anomaly in the SH, but whether this compensates for the big melt in the north is unclear. (Cryosphere today treats the hemispheres like two different planets.)
10 August 2007 at 12:22 PM
Re: #21,
If your implication is “maybe the warm Siberian winter/spring had something to do with warming conditions in the Arctic”, my rejoinder would be “what is the cause of the warm Siberian weather?”
I would also ask you this: has some anomalous event been the cause of the Arctic warming for the last 30 years?
In other words, when enough seemingly random events occur in a given period of time, and they add up to a trend, and that trend has not only been predicted but the eventual causes of the trend have been observed and measured for half a century…
I find it very interesting to see how the denial machine handles this news.
10 August 2007 at 1:03 PM
I’m just an amateur, however has any consideration been given to the thickening of the troposphere and accelation of the polar jet stream as to why arctic ice may be disappearing quicker than what climate models have predicted?
Over the last few years, it seems as though the polar jet stream is being diverted much further south than is customary. The result has been rather cool temperatures in the Northeast US from all that polar air. Understand that this is may also be due to a persistent high pressure system over Greenland.
There is just so much cold air in the arctic and by emptying it out, that opens up pathways for warm air to enter that arctic from Asia…
At least that is my pet theory.
Thanks in advance.
10 August 2007 at 1:16 PM
Re comments 4 & 10:
Perspective is indeed important.
There are studies showing past instances over last 130,000 years when Arctic was warmer than it is now and sea ice area smaller (particularly early in Holocene ~ 9k to 5k years ago and then the Eemian warm period between ice ages ~ 130k years ago).
One recent story of mine explores how Arctic flora responded (very resilient):
www.nytimes.com/2007/06/15/science/15arctic.html
As for 1930s and Medieval optimum, Chapman at UIUC and others have some data, but doesn’t seem there was Arctic-wide retreat.
The main reason this is significant news (to my mind) isn’t how it relates to the global warming trend, but more simply the reality that all that open water is starting to juice up the jockeying over who’s going to control the warming Arctic.
10 August 2007 at 1:37 PM
With the forthcoming Arctic melting, there will clearly be more ships in the Arctic, and I’ve seen general articles expressing general concern about the further acceleration of albedo-lowering from their soot.
Does anybody have pointers to any more specific numerical studies about the relative effects of existing soot sources on the Arctic ice versus likely effects from shipping? Put another way, will controls (assuming any set of governments can agree on them) on Arctic shipping emissions help, or will they be essentially irrelevant by the time shipping there is substantial?
Google: soot sources arctic ships
didn’t find exactly what I wanted, but the following was interesting:
http://www.polarcat.no/coordination/meeting-paris/meeting-materials/ppts/quinn_overviewArcticPollution.ppt
10 August 2007 at 1:37 PM
Here, that means that the arctic stops being a desert, and becomes a huge latent heat engine. Think about how much more lake effect snow is now being produced down-wind of Lake Erie, now that Lake Erie has a shorter freeze season, and think about the effects of less ice in the Arctic.
Comment by Aaron Lewis
Aaron, what happens if huge amounts of snow fall in the area around the Arctic Circle during the Arctic winter but stay on the ground until late in the Arctic summer when it all melts from the warmer temperatures? Wouldn’t that whole area be a cold wet desert in that case?
10 August 2007 at 1:52 PM
ESA has much more interesting pictures of the density of the polar ice cover at:
http://www.esa.int/esaCP/SEM7ZF8LURE_index_1.html
Should have the 2007 comparison picture out in a few weeks…
10 August 2007 at 2:37 PM
Re: 10
> What will the nay-sayers say then - they will blame the scientists!
Idi Amin: Yes, you are my advisor. You are the only one I can trust in here. You should have told me not to throw the Asians out, in the first place.
Nicholas Garrigan: I DID!
Idi Amin: But you did not persuade me, Nicholas. You did not persuade me!
– The Last King Of Scotland
10 August 2007 at 2:38 PM
#23 Walt
With regards to Siberia being warm there is a simple explanation, once the Northern Hemisphere reaches a certain state of heat (energy), it does not lose it overnight. Heat radiation escapes to space at a constant rate, if the system cools from a higher state of heat at fall, during winter, eventually spring will be warmer, not necessarily at always the same geographic location since the Earth rotates.
There is no anomalous event similar to this one, not in my about 25 winter seasons of observing from within the Arctic. There are years when synergystic combinations (as mentionned in the article) cause open water with relatively very small polynias, but nothing like a new ocean appearing before our eyes.
10 August 2007 at 2:54 PM
Following up on Mark Serreze’s comment early. The NSIDC update is on the web at:
http://nsidc.org/news/press/2007_seaiceminimum/20070810_index.html
This will be updated once or twice a week through the rest of the melt season (end Sept or early Oct). It includes a daily image of extent and a timeseries of the seasonal behavior compared to climatology and previous low years. Looking at this, one can see that this year is quite stunning.
A couple of notes:
On area vs. extent - NSIDC uses total extent, which the total area covered by at least 15% sea ice. Area just counts up the area covered by sea ice. Thus, area values are lower since extent includes regions not completely covered by ice. Extent is a more robust value to use to compare to other years. Area estimates from the satellites can be biased by surface melt and atmosphere. This much less of an issue for extent, so it is more reliable to use extent.
On earlier sea ice: It was quite warm in the 1930s, but the best data available indicates that we’re well below the extents in the 1930s. This could be due to a thicker overall ice cover back then that was more resistant to melt.
Walt Meier
Research Scientist
National Snow and Ice Data Center
10 August 2007 at 3:06 PM
Re: #31
What is the best data available? When I looked at the UIUC material, it seemed like their view was that one should be cautious when using their pre-1953 data.
10 August 2007 at 3:07 PM
re 27
Did you ever see a lot of melting snow without a lot of mud? Did you ever see a lot of mud in a desert?
That snow machine is driven by heat. Think of snow as a way to transfer heat from the warmer water to the air over the colder land. Just because it snows, that does not mean(all)the heat has gone away. The latent heat of the moisture from the water remains in the air.(Some of)that heat will come back as a warm wind or rain to melt the snow. Some of the heat will be radiated away. The point of Gavin’s 6 Aug. 2007 post was to help us understand how much heat will remain. (Excel is so much fun!)
10 August 2007 at 3:41 PM
Andy Revkin (#25) wrote:
Likewise, in earlier periods, at least over the human history of the past 10,000 years, a warming of the northern hemisphere meant a cooling of the southern. It sea-sawed back and forth. But this time the warming is pretty much a global phenomena. The West Antarctic Peninsula is going, melts are occuring deep within the Antarctic interior, and the ice-mass balance of Antarctica is falling. There is cooling in some areas, but the net trend is the same.
In human terms this is unprecedented.
10 August 2007 at 3:54 PM
Is there any connection between the very persistent low over the Gulf of Alaska and the rapid erosion of sea ice seen north of the Bering Sea?
10 August 2007 at 4:07 PM
Re: #5
I agree completely that we desperately need to talk about the effects of a rapidly warming Arctic on agriculture in the American Midwest.
I think that not only are we building the roots of an ethanol industry in a very drought-prone region (and a region that may see less water as the Arctic warms), we are covering the Midwest in the same crops that covered the region in 1930 before major drought triggered the Dust Bowl. It seems to me that we’re asking for dust and trouble, albeit we haven’t ravaged the topsoil as badly as we had in the 1920’s.
Can we quantify the danger of Arctic warming and reduced sea-ice in terms of North American precipitation? Are there any estimates of precipitation in the northern hemisphere is affected by Arctic warming?
10 August 2007 at 4:20 PM
Karl Sanchez (#34) wrote:
I believe there is.
A high pressure over the Arctic Sea is “pushing” sea ice out of the Arctic and into the subarctic where it tends to melt more quickly. If you look at the 30-day “movie” of ice distribution for the Northern Hemisphere at…
Cryosphere Today
http://arctic.atmos.uiuc.edu/cryosphere
… you will notice that it is near the Bering Sea that the large swath of low-density sea-ice is concentrated and that it appears to be moving most quickly towards the Bering Sea.
10 August 2007 at 4:22 PM
re: #25, and the jockeying for sovereignty in the Arctic: what’s scary about it is that they are after the huge reserves of fossil fuels that have been inaccessible till now under the ice. Just imagine what happens if all of that CO2 gets churned out into the system!
10 August 2007 at 4:39 PM
Jeff Masters at Weather Underground has an interestingnew post on sea ice. Consider what he has to say about the impact of Arctic sea ice melt on global weather patterns:
For me, this is the really big question. What does a rapidly melting Arctic do to NH weather patterns? The potential for dramatic shifts is obvious, but as far as I know only one group is trying to model this (Colorado?). Should be a rather urgent subject for research, I’d have thought…
10 August 2007 at 4:47 PM
Very interesting Gareth. Here in Northwest Ohio, 5 of the last ten days have been over 90 F., with dewpoints up to 77 F. The meteorologists attribute it to high pressure keeping the jet stream north of the Northern US. This is what Jeff Masters has said was to be expected. I suspect this will become a new, unwelcome feature of our weather here.
Oh. We’ve had many more days over 90 F here than normal, so far this summer.
10 August 2007 at 5:32 PM
re #36
Regarding ethanol, you might be interested in the article by Jeff Goodell in the current issue of Rolling Stone.
According to his report it’s a huge scam that has no real benefit for anyone … except certain special interests. Bad for the environment, bad for corn prices, just plain bad.
10 August 2007 at 6:41 PM
This is off topic, but the study out today on high cirrus clouds in the tropics is very interesting. I read it at http://blogs.usatoday.com/weather/2007/08/cloudy-forecast.html?csp=34. Their finding was fewer, not more clouds, thus more global cooling. However, I think this just makes the CO2 contribution to warming even stronger, as it would be warmer were it not for this negative feedback.
10 August 2007 at 7:05 PM
Walt Bennett (#2) said:
They’ll say the Arctic must have been ice-free in 1421, when the Chinese Navy circumnavigated Greenland.
hey,, what is it with wordpress blogs and disappearing preview?
10 August 2007 at 7:15 PM
re: 36, 41 Ethanol is OT in this thread…
but as much as I enjoyed Goodell’s “Big Coal”, I think he hasn’t looked deeply enough into this, especially with regard to plausible trends, multiple studies with different numbers, use of switchgrass/miscanthus instead of corn, etc. Put another way, I think I give more credence to Argonne National Labs, UofI, Vinod Khosla, etc. Finally, recall that the petroleum industry has no reason whatsoever to like ethanol.
10 August 2007 at 8:06 PM
RE # 44 John Mashey
Discussing ethanol is very much related to this thread if you have an interest in understanding the impact on North American temp and precip as the Arctic sea ice rapidly disappears during our mid-summer.
Its simple: when you read ethanol, think grain. When you think grain, think global surplus. Then, you can factor that euphamism called ethanol into the thread.
10 August 2007 at 8:12 PM
Please note that on July 15, the English swimmer Lewis Gordon Pugh was able to *swim* 1 km in the North Pole exact location (google on this) - proving for WWF that there was enough free water to achieve this. This was impossible ten years ago (this crazy guy was just wearing a speedo in a -1.8°c water…)
10 August 2007 at 8:22 PM
There is, of course, more to sea ice than just its extent. Thickness, amounts of multi-year ice, etc, etc. What’s most interesting in these two images is the asymmetry of the areal reduction. Significant changes is the Laptev, Siberian, and Chukchi Seas; in the outflow areas of the Khatanga, Lena, and Kolyma rivers but not the same dramatic changes out from the McKenzie. What is going on here? Meanwhile, in the Greenland, Barents, and Kara seas more modest changes in area. Yet, again, in the Canadian lower Arctic archipelago significant changes. A perplexing pattern.
10 August 2007 at 8:46 PM
Hey guys, probably a silly question from a “still learning” guy. How are photo’s showing melting icecaps any different that the plots showing rising temperatures? I would expect that since the global temperature has risen between 79 and 07, that ice would melt. I would think, in order to add any new useful info, you would need to compare ice volumes with those of earlier hot years, like in the 30’s to help determine whether the ice is similar to what was going on then, or whether it has melted way more. Thanks for the informative blog. I find this place and ClimateAudit very interesting, I only wish there was less bickering and veiled shots taken at each other in the posts =D
10 August 2007 at 9:35 PM
re “Climate Deniers = Climate Dodos…”
Nice.
10 August 2007 at 9:41 PM
re: #45 & OT
I’d be delighted to see a Friday Roundup or specific topic called “Expected temperature and precipitation trends in the US & Canadian mid-west”….
but turning *this* thread into an ethanol discussion is the kind of OT-amplification that eventually ruins a bulletin board.
I’d expect there would be *many* other climate factors relevant to mid-West climate discussion than Arctic Sea Ice. From a quick look at the Index, I’d guess one could argue for an ethanol discussion in half of the topics (not even counting the Sheep Albedo Feedback), but that really doesn’t make sense.
sci,energy has 4000+ hits for ethanol, might be a better place, or maybe there’s an RC-quality on fuels.
Grain: I’ve heard of this stuff, having grown up on a farm with corn & wheat & oats. However, when I think about ethanol, I think ahead to switchgrass, miscanthus, or genetic-engineered versions thereof, as opposed to crops tuned for food for thousands of years.
10 August 2007 at 9:56 PM
I seems pretty likely the pole will be ice free (in summer) within a few decades if not sooner.
I can’t help thinking that the first satellite picture of the ice-free arctic will be truly iconic, on a par with the first images of the earth taken from space/the moon. There’s no arguing with the idea that humanity can affect the planet when faced with something as concrete as that.
10 August 2007 at 11:07 PM
This is extremely frightening and alot of the comments here regarding theories corelates well with what we are currently seeing. It is currently like 55 in Upstate new york. It felt like October today but two states to the west of us, it’s nearing 100, (and well into canada I would presume.).
I dont want to go much further into my thoughts because i dont want to upset the moderators of this blog, because I am not too too familar with the rules here as of yet. I read every blog, and most of the comments just don’t participate much because of this. I too would think maybe a forum of general climate discussion would be a great addition to this database of reliable climate discussion and information.
Although, this I believe I can add without hesitation. On the topic of a colder Northeast, I already made the point above that it is extremely cool here lately, and we seem to be espcaping most of the high heat, but If my memory serves me correctly, last year the same type of trend occured, we’d get heat, then cool for a while then intense heat back and forth. Along with it, I’ve noticed it seems that during the fall (this at least for the past couple years now) the temperatures stay much milder, giving an opprtunity this past christmas to wear a short sleeved shirt, the year before was a nice warm day as well for Christmas. I also saw a baby bird on january 5, 2007 this year, outside my window while taking down christmas decorations, in the meanwhile, the rest of the country was dealing with the cold and heavy snows, and not to mention the erratic weather. El Nino was said to be of blame, but this trend has been progressive over the past few yeras. Many locals notice the shift in seasons in the Northeast as well. We seem to get better chances for severe weather in the fall similar to the midwest (not in terms of frequency, but intesity). Albany New York had a Tornado watch out on Dec 1st 2006. Maybe one of the handful of times theres ever been the word Tornado and watch or warning in this area, and decemeber of all months.
Just my 50 cents to add to several posts above related to less artic ice effects on weather, IE the Northeast. I would only imagine from the trends and what I have read about it, that this would continue.
10 August 2007 at 11:46 PM
Re #33: [Did you ever see a lot of melting snow without a lot of mud?]
As a matter of fact, yes. It’s quite common around here (east slope of the Sierra Nevada). Porous decomposed granite soils without much organic matter, low humidity, and large day/night temperature swings means that meltwater either soaks in or evaporates almost immediately (if it doesn’t actually sublimate), so the ground just gets sort of damp.
11 August 2007 at 2:11 AM
I am curious, as we are discussing this absolutely startling rapid melt of the arctic sea ice, where the discussion of permafrost and methane enters into the equation. It would seem to me that with all the extra heat in the arctic, both atmospheric and ocean, that permafrost would also be thawing out rapidly, and we might be seeing a continuation of the rapid rise in methane that we’ve seen the last 20 years, (though it was flat to slightly lower the last 2 or 3)? Any experts here care to discuss potential permafrost/methane connections to an ice free Arctic Ocean?
11 August 2007 at 3:59 AM
Re #51 The North pole is already free of ice in the summer. In fact a Briton has been swimming there this summer to raise awareness of climate change, but he seems to have had little effect
See http://news.bbc.co.uk/2/hi/uk_news/england/london/6899612.stm
In fact it was first free of ice in the summer of 2000.
See http://news.bbc.co.uk/2/hi/americas/888235.stm
But the ‘powers that be’ forced the New York Herald to withdraw that story. Things are a lot worse than you are allowed to know.
11 August 2007 at 4:39 AM
Re 48. Different people have different modes of neural processing, well described in the literature on neural linguistic processing. To many people, showing a graph is a waste of time. They don’t know how to interpret graphs; they haven’t had the training, and so it is not a surprise. Showing a picture however can be very powerful, especially if two pictures are shown as before and now. That leaves the person to whom the pictures are shown with the problem (or opportunity) of thinking about what the picture for the ‘after’ condition might look like.
The real problem, though, is how to get over the problem of the failure of climate scientists to deliver absolutely clear messages to the world about the potential for sea level rises of the order of metres over the coming decades. The IPCC has demonstrated failure in that regard, and has run away for 6 years. Perhaps it should be re-convened on a 12-monthly basis specifically for the emergency topic of sea level rise.
The world is probably justified in thinking that the potential sea level rise over the next century is a few inches or, for those who don’t do inches, a few centimetres. Climate scientists, or those who give themselves that description, will mumble to each other. What might they say? Perhaps a discrete conversation over coffee might go along the lines:
Climate Scientist A: “we know it’s not a few centimetres”
Climate Scientist B: “we are reticent, we can’t go public”
Climate Scientist A: “oh, leave it to Hansen, he’ll do the going public bit”
Climate Scientist B: “but will we still get funding and will we still be able to publish our work in peer-reviewed journals?”
Climate Scientist A: “oh yes, we can tell them that the rise will be a few centimetres but then add a bit on the end to cover our arse”
Climate Scientist B: “what bit will that be?”
Climate Scientist A: “we’ll add the phrase … but it could be more”
Climate Scientist B: “oh … that means we are covered when the ice sheets do start to disintegrate”
Climate Scientist A: “you got it!”
The time for reticence is over. The world needs a clear message.
For example, where can the public find the results of a Delphi study of the world’s top 100-500 climate scientists’ estimate of what sea level rise might be up to 2100?
11 August 2007 at 4:48 AM
Yes indeed, what is going on in the Arctic sea ?!?
Have a look at:
http://www.servumpecus.canalblog.com/archives/2007/08/05/
With my best regards,
Servumpecus
11 August 2007 at 6:32 AM
Meanwhile, sea ice coverage at the south pole is above average. Does RC have any posts discussing expected trends in southern hemisphere sea ice ?
11 August 2007 at 9:34 AM
re 56
“The time for reticence is over. The world needs a clear message.”
Michael, have you seen the report of the joint study by Sigma XI and the United Nations Foundation? Entitled “Confronting Climate Change: Avoiding the Unmanageable and Managing the Unavoidable”, it strikes me being as along the lines of what you are asking for.
http://www.sigmaxi.org/about/news/UNSEGReport.shtml
I think the real problem is that unless you read American Scientist magazine, or follow the proceedings of the UNF, John Q. Public is not going to know it exists. Which, IMHO, is the real problem. I think the climate scientists have been rather clear in their message.
It’s the media. On one hand, they muddle the issue by allowing themselves to be manuevered into suppounding the “It’s a debate” promoted the denialists (Dodo-ists?), most likely because conflict sells more papers than conclusions. Second, again related to selling papers in an era where readership is declining, they are more interested in letting us know what and who Brittney, Lindsey and Paris are running their automobiles into, detailing the latest tragic family slaying, repeating teh latest al Qeada warning. Something like the oncoming climate disaster, supposed to happen far in the future and with no Katrina to make it current and “sexy” just isn’t selling papers.
So John Q. Public (re Joe Six-Pack & Matilda Make-up) haven’t heard the news and likely wouldn’t pay attention if they did.
Now if only some poor, starving Polar Bear ate Paris Hilton, maybe the issue would get some press…
*sigh*
11 August 2007 at 9:48 AM
Question (one of those wake-up-in-the-middle-of-the-night kind).
In 2005 and, I think, 2006, the ocean currents off Northern and Central California were much warmer than expected. Combined with weak upwelling, the zooplankton production dropped precipitously, in some areas to 14% of normal, if I’m remembering correctly, which led me to wonder:
Has anyone done any projections of biomass levels for the Arctic seas over the next year based on what’s happening? (I’m assuming they have, given 2005’s ice retreat).
Also, of course, is there some sort of correlation between what California currents from the north experienced in 2005 (and 2006) and the decline of sea ice in the Arctic?
Thanks in advance.
11 August 2007 at 9:58 AM
re 50 (and #45 & OT)
I’d be delighted to see a Friday Roundup …
=========================
Agreed. That said, regardless of your feelings for the author, you should read it. The problems associated with ethanol are fairly straightforward, and laid out well. And switchgrass is not a solution, particularly once you factor in land use, transportation and processing costs. And this isn’t even factoring in the energy efficiency figures versus the cost of bringing home the bacon.
The real problem, IMHO: it’s a panacea, a short-term, likely unsustainable effort that does little more than give the appearance of “doing something” when, in fact, it’s actual positive effect is negligible, while the negative is large (You’ve heard of the “tortilla crisis”, right?) in terms of higher corn prices and lost land better used for food production.
That said, I’ll shut up and worry about something more in line with the subject, like how the warming Arctic will affect the ocean’s ability to produce food.
11 August 2007 at 10:03 AM
re 58:
Meanwhile, sea ice coverage at the south pole is above average. Does RC have any posts discussing expected trends in southern hemisphere sea ice ?
========================
Could you provide a link to this? I’m personally curious as my wife is journeying to the Ross Sea in February…
That said, I believe Timothy Chase said something contrary to what you are saying in #34. Hopefully this will get sorted out.
11 August 2007 at 10:03 AM
David in 58 remarked:
“Meanwhile, sea ice coverage at the south pole is above average.”
Yeah, and there is no Sun in the South pole at the moment.
Besides, there is neither obvious trend nor alltime record maximas/minimas in Southern Sea Ice Area data. See:
http://arctic.atmos.uiuc.edu/cryosphere/IMAGES/current.area.south.jpg
11 August 2007 at 10:25 AM
Its too bad we can’t compare the last equivalent weather situation, 1934 for instance. But, satellite technology being what it is takes getting satellite date from that period a little difficult. My grasp of the obvious.
11 August 2007 at 10:42 AM
Re 54- R. Gates raised the question about methane release and permafrost melting because of the extra heat in the Arctic. I have been watching with concern the temperature anomaly off the NE Siberian coast, which has persisted for weeks, seen here:
http://weather.unisys.com/surface/sst_anom.html
Surely this portends more rapid disintigration of the Siberian permafrost coastal shelves, with the attendant release of methane. Am I correct in recalling that there are substantial methane hydrates included in these structures?
11 August 2007 at 11:26 AM
JS McIntyre (#62) wrote:
Nope.
He was speaking strictly of sea ice. (#58) I was speaking of glaciers and some parts of the interior of the Antarctic, but made no mention of sea ice. (#34)
As I have pointed out previously, if Antarctica were to experience a sudden loss of glaciers, you would expect an increase in sea ice, not a decrease.
However, Petro is right (#63) - no obvious trend in sea ice.
I am curious, though: how were you able to know the number of my post? I assume you looked it up, but this doesn’t make any sense given the fact that the two posts were clearly speaking of different things, and both posts were short enough I presume the difference would have been obvious.
11 August 2007 at 4:56 PM
Alastair McDonald (#55) wrote:
Now that is a dramatic detail!
Something which bears repeating - particularly in essays.
It should be obvious how bad things are to anyone reading the headlines who has a wit of common sense - given the power struggle that is beginning to be waged by Russia, Canada, US, Sweden and the Netherlands over the Arctic Ocean oil reserves. Fighting over oil under these circumstances! Someone must have a perverse sense of humor.
11 August 2007 at 5:13 PM
re: #61 OT
“Agreed. That said, regardless of your feelings for the author, you should read it. The problems associated with ethanol are fairly straightforward, and laid out well.”
?? Peace: you seem to be reading something other than what I posted.
I have previously recommended Jeff Goodell’s “Big Coal” several times (hence, if anything, I’m favorably disposed), but I didn’t think his RS piece (which I’d read before I commented) was up to that standard. Robert Rapier’s blog is way more informed and balanced, with well-nuanced discussions (including some agreement/disagreements with Khosla) but that doesn’t come through very well in JG’s RS piece.
For example, RR says: “I firmly believe we should be aggressively researching the potential of cellulosic ethanol…But I think the hype has gotten way out of touch with reality at this time.” *That* is good, albeit a tiny sample of fairly complex discussions there.
Anyway, back to Arctic ice, please; let’s take this ethanol stuff to i-r-squared.blogspot.com or some other more relevant place.
11 August 2007 at 5:19 PM
Freeman Dyson cast some interesting doubts (as heresies) about the climate modeling in GW on the Edge website here:
http://www.edge.org/3rd_culture/dysonf07/dysonf07_index.html
He isn’t claiming GW is untrue, just possibly too reliant on poor models.
Any comment about this?
11 August 2007 at 6:24 PM
Re 66,62,63 - The cryosphere today website has a graph of current sea ice coverage over the last year in both the Arctic and the Antarctic, together with the current difference from the 1979-2000 mean value. The difference from the mean is obviously corrected for the time of year. In the Antarctic it currently shows about 0.6million square kilometres more ice that the mean.
In my original post I was merely asking for intelligent comment on the future of antarctic sea ice.
11 August 2007 at 7:19 PM
I imagine nobody else noticed but the NOAA and the NCDC changed the historic sea ice extent data in January of this year. The changes were very, very substantial.
If you want a BEFORE and AFTER, here is link to gif image.
http://img401.imageshack.us/img401/2918/anomalykm3.gif
As well the best place to look at sea ice extent is using the VISIBLE satellite picture from AQUA/MODIS/TERRA satellites. These VISIBLE real-time images show there is more arctic sea ice than shown by the NCDC and the Cryosphere Today.
http://rapidfire.sci.gsfc.nasa.gov/realtime/
11 August 2007 at 7:55 PM
In the data collected by National Snow and Ice Data Center, University of Colorado, Boulder, CO.
http://nsidc.org/seaice/characteristics/difference.html
The melt and recovery show that the total Arctic Ice in manner of Millions of sq. miles. It lists it’s data as being about the same. How is the pack getting smaller if the recovery level and the melt level are consistently the same? Can anyone help me here?
11 August 2007 at 9:05 PM
John Wegner (#71) and hoosiemorm (#72),
I believe it might help everyone to check out a chart showing Northern Hemisphere Sea Ice Extent which has not been updated to include 2006. (Unless you are suggesting they went back and edited this image as well, John - but this would seem to imply intent.) This is done seasonally…
Northern Sea Ice Extent
http://arctic.atmos.uiuc.edu/cryosphere/IMAGES/seasonal.extent.updated.2005.jpg
For John, here is another image from 2005, albeit based on annual trends..
28 September 2005
Sea Ice Decline Intensifies
Figure 1: September extent trend, 1978-2005
http://nsidc.org/news/press/20050928_trends_fig1.html
John, somehow I don’t think the images of the Arabian Peninsula will be very helpful.
11 August 2007 at 10:25 PM
Re: Post #65
I have only recently become more interested in the methane part of the equation, and certainly the great unknown (isn’t it all though really?) is how quickly the permafrost will respond to the temperatures associated with a summertime ice free arctic.
Does anyone know where we can get reliable and near real-time atmospheric methane concentrations for various parts of the planet? I think the reponse of permafrost and perhaps even methane caltrates in the deeper (and warmer ocean) would be of keen interest considering how potent a GH gas it is.
11 August 2007 at 11:06 PM
ftp://sidads.colorado.edu/pub/DATASETS/PASSIVE_MICROWAVE/POLAR_STEREO/ANCILLARY/ICE_EXTENT/SMMR-SSMI_BOOTSTRAP/BROWSE/gsfc.bootstrap.extent.Total-Arctic.1978-2004.n.gif
So is the Colorodo Chart Wrong?
12 August 2007 at 6:14 AM
[[Freeman Dyson cast some interesting doubts (as heresies) about the climate modeling in GW on the Edge website here:
http://www.edge.org/3rd_culture/dysonf07/dysonf07_index.html
He isn’t claiming GW is untrue, just possibly too reliant on poor models.
Any comment about this?]]
Yes. Freeman Dyson is given to making extravagant claims in fields he isn’t really familiar with.
12 August 2007 at 6:38 AM
On 10 August 2007, NOAA data showed the direct Northwest Passage through the McClure Strait north of Banks Island to be completely open. I’ve scanned the recent data and cannot find a precident (though 1998 and 1999 go very close).
The historic plot is here: http://polar.ncep.noaa.gov/seaice/analysis/nh/nh12.20070810.gif
[The previous direct NWP minimum appears to have been ~20 Sept 1998: http://polar.ncep.noaa.gov/seaice/analysis/nh/nh.19980920.gif ]
12 August 2007 at 7:37 AM
#73 - Timothy Chase - the MODIS/TERRA/AQUA satellites are in a polar orbit and take pictures every 5 to 10 minutes. Click on one of the images and you can use the Prev and Next buttons on the side to move back and forth in the orbit to see the North Pole or just about anywhere on the planet in real-time or in the last 24 hours at least.
The images also allow you to use different wavelengths and Zoom into 4km, 2 km, 1 km, 500M or 250M resolutions.
Here is the 4 km Visible image of the Siberian side of the Arctic ocean including the North Pole from about 10 hours ago (remember 24 hours of sunlight in the Arctic circle this time of year.)
According to the Cryosphere Today software-produced image in this thread, there is supposed to be very little sea ice here whereas obviously there is (Note clouds are sometimes in the way but if you go back and forth and look at other images you can directly see with your own eyes whether there is sea ice or not.)
http://rapidfire.sci.gsfc.nasa.gov/realtime/single.php?2007223/crefl2_143.A2007223234001-2007223234500.4km.jpg
12 August 2007 at 7:45 AM
Rapid Sea Level Rise of 500mm per decade is possible, its not a question of if but when. We can all see the process starting now in which the melting will facilitate the cascade of the land based ice into the sea, giving the general public a bit of a shock. I think we will see the start of the cascade in a decade or two, I hope not. What I think needs to be discussed is the preparation for such an event, being early is not a problem, more than anything it will help society move into the next stage of civilisation. Their are a lot of things to do, but I would just like to mention one. Nuclear power stations on the coast line do pose a bit of a problem, especially the ones being planned now. Decommissioning will not be possible when the cascading takes effect as the sea level rise will be rapid and unforgiving. Renewable energy can work, especially the CETO technology being developed in Perth Western Australia. A lot of things can be done about climate change, I just wonder what path we will all take.
12 August 2007 at 9:40 AM
Re 79. In addition to potential burial-at-sea of nuclear reactors there is also the potential for wash-out of thousands of toxic dumps. Potential dislocations spreading through global supply chains during this process may have a high impact on decommission and rebuild capacity. The situation requires urgent international attention.
12 August 2007 at 11:46 AM
Re # 19 Aaron Lewis
“normal sea water sinks as it cools,”
No argument there.
“thus normal ocean water freezes from the bottom up.”
Not normally, it doesn’t. As the upper layer of water cools and approaches its freezing point (in contrast to fresh water, in seawater the freezing temp equals the temperature of maximum density), the sinking (downwelling) slows - the layer of water at the surface is in contact with the colder atmosphere and starts to freeze first, with ice crystal formation causing it to expand. Hence, ice freezes at the surface, just as it does in fresh water. Brine rejection by the ice will add salt to the underlying water and cause downwelling under the ice, but that is a gradual process. If you were thinking of anchor ice formation, that occurs only in very specific situations (http://en.wikipedia.org/wiki/Anchor_Ice; http://amsglossary.allenpress.com/glossary/search?id=anchor-ice1)
At least is how I understand it.
12 August 2007 at 11:47 AM
# 81 I should have said ice forms at the surface, just as it does in fresh water.
[Response: That is overwhelmingly the case, but curiously you do sometimes get ice forming at depth when supercooled water from underneath ice sheets moves into the open ocean. I think it’s sometimes called ‘marine ice’ . - gavin]
12 August 2007 at 12:17 PM
re 66
That said, I believe Timothy Chase said something contrary to what you are saying in #34. Hopefully this will get sorted out.
Nope.
He was speaking strictly of sea ice. (#58) I was speaking of glaciers and some parts of the interior of the Antarctic, but made no mention of sea ice. (#34)
==============
I note you didn’t seem to have a problem with David’s remark “Meanwhile, sea ice coverage at the south pole is above average” when, in fact, there is no sea ice at the south pole, or any within hundreds of miles.
I bring this up not to be contentious, but to underscore that you did mention the West Antarctic Pennisula in #34 (”The West Antarctic Peninsula is going”), where a great number of glaciers are emptying into the sea, which was where I made the association, as I tend to think of the sea surrounding the territory as part of the area. I didn’t think I needed to be clearer, but in retrospect, I should have.
My apologies.
12 August 2007 at 1:25 PM
J.S. McIntyre (#83) wrote:
Not a problem.
I myself keep reading over what I am about to post, but maybe a little too quickly. It is only after I go back that I will notice that some sentence is garbled, usually either near the very beginning or end of the post. The beginning is worse as this is what people are likely to read first. But it is usually at that point that the mind is still in the process of tuning up, sorting out your thoughts, trying to put everything into context. It is only later that you know exactly what it is that you want to say.
Then of course there are the misinterpretations of what other people have said, of their intent, responding to what you think they have said or what you think was the intent behind their words. I enjoy participating, trying to take into account everything I can, but I probably don’t measure up to what I would like most of the time.
Sometimes I will respond to what someone else has responded to, but typically in more detail because I am still trying to get everything straight in my own head. Different responses will probably speak to different people, longer responses to some, shorter and more direct responses to others. As such I don’t see a problem with different people responding to the same post.
But sometimes I wonder whether this too might be misinterpreted - as if I think that I am in some sort of a contest with others. But it most certainly isn’t a contest, at least as I see it. I just think that everyone should do the best that they can and not worry too much about the rest.
Anyway, this is probably more personal detail than most will care to hear. But I figure some will find some value in it simply in terms of being able to see what others are probably going through. There is a great deal at stake, and I am sure the emotions often run high for others as well as myself.
12 August 2007 at 2:12 PM
The remarkable point in Arctic sea ice extent is not that it is lower by the year in summer (and in yearly average), it is that winter sea ice cover hardly declined from the long-term average.
See the seasonal trends here.
Thus in winter, most of the summer melt refreezes. Why is that? In summer there are more clouds than in the past. This reduces the influence of the sun (or the melting would be larger). In winter the reverse happened: less clouds than usual, thus with more open skies during polar night, more heat radiation escapes to space and water freezes more rapidly.
See Science”
Something that climate models didn’t expect…
12 August 2007 at 4:23 PM
Ferdinand said:
“The remarkable point in Arctic sea ice extent is not that it is lower by the year in summer (and in yearly average), it is that winter sea ice cover hardly declined from the long-term average.”
Contrary to your claim, there is a shrinking trend in winter sea ice cover starting around 1972. Dramatic drop has occured during last four winter. See: http://arctic.atmos.uiuc.edu/cryosphere/IMAGES/current.area.jpg
12 August 2007 at 8:54 PM
Re # 19 Aaron Lewis
“Think about how much more lake effect snow is now being produced down-wind of Lake Erie, now that Lake Erie has a shorter freeze season”
I don’t know about recent changes in lake effect snow due to warming to date, but lake effect snow on Lake Erie’s Southern shore (and that of the other Great Lakes) is predicted to decrease by the end of the century due to global warming:
The Future of Lake-Effect Snow: A SAD Story
From Acclimations, January-February 2000
Newsletter of the US National Assessment of
the Potential Consequences of Climate Variability and Change
By Peter J. Sousounis, The University of Michigan
[Excerpt]
“Recent simulations from the Canadian Model (CGCM1) and the United Kingdom Hadley Model (HadCM2) suggest that the climate in the Great Lakes region by the end of the 21st century will be warmer and wetter — with the CGCM1 being warmer and drier than the HadCM2 (4 vs 2°C and 25% increase vs 50% increase). While understanding the mean temperature and precipitation changes predicted by the models is important, day-to-day weather will be affected by corresponding changes to cyclone tracks, arctic outbreaks, and lake-effect snow patterns. In predicting these crucial day-to-day local aspects of the weather, even the current suite of GCMs is inadequate. However, some conclusions about the local weather patterns can be made with confidence by understanding the connection between the large scale flow patterns and local weather. In this respect, both models are more similar and suggest that by the end of next century, the typical winter may be comparable to what we experience now during a moderate-to-strong El Nino. The coldest winters may be comparable to what we experience now in a normal winter. Snowfall totals may therefore be half the current normal totals with lake effect snow being significantly reduced, especially over the southern portions of the region where average temperatures barely support snow now. Both the CGCM1 and the HadCM2 suggest a more zonal flow pattern, meaning more Pacific systems, fewer Gulf of Mexico systems, and fewer Alberta Clippers. Alberta Clippers are a primary source for reinforcing the cold air over the Great Lakes in winter. Fewer outbreaks likely means less lake-effect snow.
Impacts on recreation
Less lake-effect snow could potentially have a considerable impact on the winter recreational activities of the region — particularly in the southern portions, where significant reductions in snowfall totals coincide with populous urban centers like Chicago, Detroit, Cleveland, and Buffalo. …”
http://www.usgcrp.gov/usgcrp/Library/nationalassessment/newsletter/2000.02/Lakefx.html
13 August 2007 at 4:23 AM
Re 69. Freeman Dyson writes at that link “The most alarming possible cause of sea-level rise is a rapid disintegration of the West Antarctic ice-sheet, which is the part of Antarctica where the bottom of the ice is far below sea level. Warming seas around the edge of Antarctica might erode the ice-cap from below and cause it to collapse into the ocean. If the whole of West Antarctica disintegrated rapidly, sea-level would rise by five meters, with disastrous effects on billions of people.”
Freeman Dyson suggests that we are relying too much on models.
Where are the models of ice sheet disintegration that the world is relying on?
Where are the models of ice sheet disintegration that contain the physics of ice streams, effects of surface melt descending through crevasses and lubricating basal flow, or realistic interactions with the ocean?
Where are the models predicting the sizes of mini-Meltwater pulses that may be expected through the next few decades as the WA and Greenland ice sheets begin to disintegrate?
It is only when such models do become available that more realistic assessments of the potential impacts on other systems (eg industrial dynamics, economic circuitry, life-support systems) can be made.
On the matter of ice sheet disintegration and huge sea level rises, Freeman Dyson should reconsider his position. The world is not overly relying on models. There is plenty that is being observed and plenty to be observed, but there is a dirth of models on matters which are of critical importance that may give us better insight into the unnecessary emergencies we are allowing to happen.
13 August 2007 at 4:43 AM
Re #78:
Yes, but not sure why you would say that the MODIS images differ significantly from Cryosphere Today. Here is the MODIS Aqua of the Northwest Passage on Saturday, with the direct McClure Strait route all but open for perhaps the first time in recorded history:
http://rapidfire.sci.gsfc.nasa.gov/realtime/single.php?2007223/crefl2_721.A2007223184001-2007223184500.2km.jpg
Roald Amundsen could have motored through in under 10 days. (He actually took 3 years, and a much less direct route).
13 August 2007 at 5:51 AM
How is the record low sea ice impacting greenland? Someone knowing current developments in ice quake frequency or outlet flows?
BTW the lack of media coverage of this current event baffles me… It should be front pages news!
13 August 2007 at 6:33 AM
Re 59. Thank you for the link. From page 93 of that document: “A complete collapse of the Greenland Ice Sheet, projected to take roughly 1,000 years once local warming reaches about 3°C (which is expected by late this century), would increase global mean sea level by about 7 m. The collapse of the West Antarctic Ice Sheet (WAIS), which would likely take a comparable amount of time, would add another 4 to 6 m. While the IPCC’s 2001 estimates do not anticipate significant loss of ice mass from either ice sheet during the 21st century, accelerated retreat of some ice streams has recently begun in Greenland, and some parts of the WAIS also seem to be nearing destabilization (Vaughan and Spouge, 2002; Schiermeier, 2004; Dowdeswell, 2006.)”
I am not sure that addresses the matter of a clear reference point of the liklihood of a sea level rise of several metres by 2100 for business-as-usual.
There is a state of confusion amongst risk managers.
There needs to be a Delphi study in which the top 100-500 climate scientists input their estimate of what they expect the sea level rise to be by 2100 if we carry on business-as-usual. Delphi studies which accumulate the experts’ opinions / estimates into one summary histogram are standard practice for futures studies in science, technology, engineering, etc. There doesn’t have to be named attribution to each data point.
The world needs a reference point that says … this is the expectation profile of a very large number of the world’s climate scientists of sea level rise through the next 9 decades.
Once the world has that reference point, others can then do their jobs with the world’s best estimate. The IPCC SLR numbers were not that. There is too much at stake for climate scientists to allow risk managers in corporations and elsewhere to continue assuming that the IPCC SLR estimates of a few centimetres are the ones that should be used.
The world needs its best estimate. The matter is urgent.
13 August 2007 at 9:23 AM
I’ve looked at the MODIS satellite images a little closer (and with some places having less cloud cover.)
There still isn’t a way through the NorthWest Passage without an icebreaker. Maybe in another week or two.
But that is just the problem with the Passage. There is only a few weeks from mid-late-August to mid-September when the Passage is open for non-ice-breaking ships. In some years, there is no opening at all.
As well, there are two or three distinct paths to take. In any one year, only Path3 is open while 1 and 2 are closed off. It would make no sense to station a ship off Baffin Island in early August wating for the satellites to tell you which one of 3 Paths is open for the next few weeks.
In addition, the winds can quickly close off any opening so the risk-return trade-off is just not there (unless global warming extends the Opening to two or three months, rather than a few weeks.)
13 August 2007 at 9:47 AM
Re #83:
J.S., there is a lot of sea ice in the Antarctic winter, which makes it very difficult to impossible to reach any coastal station. See: http://arctic.atmos.uiuc.edu/cryosphere/IMAGES/current.area.south.jpg
Summer sea ice is around 2 million km2, winter around 15 million km2.
The overall trend seems to be slightly positive, between 0.5-1 million km2.
Re #86
Petro, indeed, there is a winter shrinking, with the past few years some extra. But since 1970, the winter trend is about -0.5 million km2 over 35+ years, while the summer trend is about -2 million km2 in the same period. That means that summer-winter refreezing increased with about 1.5 million km2. Which is remarkable, as one may expect that winter and summer decrease would be similar.
Re #90
Up to 2004, the retreat of the largest Greenland glacier (near Ilullisat) can be seen at Wiki, but one need to compare the period 1953-2003/4 to the previous period of strong retreat of the breakup point (1929-1953) at the same page. Moreover, the summer (melt) temperatures around Greenland don’t/hardly reach the 1930-1945 temperatures.
13 August 2007 at 10:14 AM
re 93:
“…there is a lot of sea ice in the Antarctic winter, which makes it very difficult to impossible to reach any coastal station…”
Yes, I understand this about winter conditions; it’s rather common knowledge. For McMurdo Station, if I recall orientation correctly, this affects flights from New Zealand and other (relatively) nearby points, as well. It is not unusual for planes to be turned back mid-flight due to changing weather. Which is why the coastal stations have intermitant arrivals, and the interior stations, like the South Pole station, are completely cut off during Antarctic winter.
Of course, my original question regarded sea ice extent in February, which is Antarctic summer.
The link you provided was originally posted by Petro in 63, where I first saw it. But thank you all the same.
13 August 2007 at 10:32 AM
Timothy Chase (#67) said: It should be obvious how bad things are to anyone reading the headlines who has a wit of common sense - given the power struggle that is beginning to be waged by Russia, Canada, US, Sweden and the Netherlands over the Arctic Ocean oil reserves. Fighting over oil under these circumstances! Someone must have a perverse sense of humor.
I know this is off topic, but I think that the powers-that-be are probably even more afraid of peak oil than they are of global warming…..
13 August 2007 at 2:00 PM
re 94, 93 et al
Answered my question re Sea Ice in February.
It’s a pretty informative, interactive link:
http://nsidc.org/data/atlas/
Just click on your favorite hemisphere. It doesn’t address record amounts, though I will note everything I looked at regarding SHELF ice and glaciers point to a decline, not an increase.
13 August 2007 at 2:12 PM
Re #93: “That means that summer-winter refreezing increased with about 1.5 million km2. Which is remarkable, as one may expect that winter and summer decrease would be similar.”
And after the summer ice goes completely, the difference will be even larger! The key point is that what refreezes is quite thin, and thus is prone to quick melting the next year. Ironically the refreezing allows the retention of much of the heat gained by open water during the summer.
Regarding Greenland temps, this paper discussing trends for the entire Arctic is useful. From the conclusions:
“In the Arctic in the mid-1990s an abrupt rise in SAT was noted (by about 18C in comparison with the 1951–90
mean); this then stabilized and has remained at this level up to now. The greatest warming occurred in autumn and spring, and the lowest in summer and winter. In the period 1995–2005, the warming was greatest in the
Pacific (by 1.458C) and Canadian (by 1.268C) regions,
and lowest in the Siberian region (by 0.828C).”
That said, the exact pattern of warming is not the same as predicted by the models, and there is no published detection and attribution study for the Arctic.
Another thing to bear in mind about Greenland is that inferring temperatures up on the ice sheet from the surface stations around the edges has its limitations.
13 August 2007 at 3:57 PM
1978 and 1979 were the coldest years in the US since 1929. There was a general cooling trend in the US since the Dust Bowl days of the mid 1930’s down to 1979. I remember some climatologists back in the late 1970’s predicting that the Earth was heading for the next Ice Age. Strange that you would use 1979 as your comparison photo. It would be nice to have one from the mid 1930’s or mid 1950’s when it was just as hot as it is now but there were no satellites to take the pictures back then.
By the way everyone is missing the point. The Earth is warming. It has been warming since the last Ice Age and will continue to warm until the break over point to the next Ice Age is reached no matter what Humanity does. We only have the choice to get to the break over point earlier or later by the actions that we take.
13 August 2007 at 4:16 PM
Re #67 [given the power struggle that is beginning to be waged by Russia, Canada, US, Sweden and the Netherlands over the Arctic Ocean oil reserves.]
I’ve not heard that Sweden or the Netherlands have any territorial claims in the Arctic. Norway and Denmark (which has sovereignty over Greenland) do. There’s a map here:
http://news.bbc.co.uk/2/hi/americas/6941426.stm
13 August 2007 at 4:30 PM
Re #93: “That means that summer-winter refreezing increased with about 1.5 million km2. Which is remarkable, as one may expect that winter and summer decrease would be similar.”
If one was to think that the winter and summer decrease would be similar then they would not be facing up to reality.
The winter ice grows out from the perennial ice cap due to the cold air forming over the ice and freezing the water at the ice edge. This growth can continue until the surrounding water is at a low enough latitude that the water is too warm to freeze. Since ocean sea surface temperatures change little on an annual basis the maximum ice edge does no vary either. On the other hand, the minimum ice edge is determined by the thickness of the ice. As the perennial ice thins then since the sun can melt a fixed thickness, a larger area will be completely melted and expose the ocean beneath.
If the sea ice system was linear, then winter and summer decrease would be similar, but there are positive and negative feedbacks. The positive feedbacks dominate the melting and that will lead to a sudden collapse of the ice.
Not only will the sea ice disappear suddenly, but with its demise the main air conditioning unit for the Northern Hemisphere will be gone. This will lead to an abrupt warming with temperatures in Greenland rising by 20C within three years, just as they did 10,000 years ago at the start of the Holocene.
Timothy Chase (#67) said: It should be obvious how bad things are to anyone reading the headlines who has a wit of common sense - given the power struggle that is beginning to be waged by Russia, Canada, US, Sweden and the Netherlands over the Arctic Ocean oil reserves.
That fight over oil reserves will be nothing compared to the wars that will ensue when the starving Chinese, Indians, and Africans invade North America, Russia, and Europe in search for food!
13 August 2007 at 5:01 PM
Remember the Arctic circle has 6 months of darkness starting on September 21-22. It gets very cold in the Winter at the North Pole.
The average annual temperature at the North Pole is -24.5C (South Pole is -49.5C) ICE causing temperatures to say the least.
13 August 2007 at 5:44 PM
Re #101 But it can only get down to -24.5C because the water is covered with ice! If there was only open water then the surface could not cool below -2 C. You need a solid surface nearby to provide the cold air so that deep water can freeze!
14 August 2007 at 4:28 AM
I simply don’t have time to read all of these entries right now, but I will later.
I think I have said here, a few times at least, that this was going to happen. I have been watching it very closely over the last year (daily thanks to the university of Bremen http://iup.physik.uni-bremen.de:8084/amsr/amsre.html) and the areas which showed the most warming over the winter months were pretty much the first to disappear during the summer.
Also I watch all the cyrosphere news on a daily basis. The most interesting news to me this year was the 10m multi year ice which locked in the fishing fleet earlier this year. The icebreakers were unable to get in to reach them, yet icebreakers can sail to the pole with regularity today. That means the pole is still flushing out the thick multi year ice and replacing with new thinner ice. More melt, faster.
It is always the summer ice lows which get the news, but it is the winter ice melt and lows which are much more dramatic, if in a smaller way, because they are the proof of much more dramatic change.
Also after 3 winters in Sweden, spaced out over 7 years, I am personally seeing a trend. There is more cloud in the winter. As a result, temperatures are up to 10degC higher in the winter now. As a result of which the sea is not freezing as much, which means more heat from the water, etc, and the great circle goes on.
Reports from Tara Arctic this winter were of very cloudy skies, lots of snow and, except for very severe events, much warmer temperatures than normal.
Also a very interesting point is that the sea under the Ice cap is -1.7 degC. It is Fresh water which is freezing to -24 degC in the arctic, Sea water does not freeze until you reach -7… Remove the fresh water Ice, add clouds and you remove the ability of the pole to freeze in the winter. Then you have a Serious tipping point.
I always find that statements like “The great oceanic conveyor stopping completely will cause another ice age” as interesting. My logic goes like this.
The climate warms
which warms the Arctic
Which slows the conveyor
Which does?
Very little because the Arctic cannot provide the same level of cooling because it, itself, is warming. Otherwise, it would have been impossible at any time for the Arctic to have had a climate close to that of Florida. But we know for a fact that it did.
It is like the argument that txt messaging on mobile phones will cause longer thumbs in 5,000 years. Actually not, we will all be walking around with sugar powered chips in our body in 100 years time and won’t use our thumbs for any form of messaging, just our brains. Perhaps we’ll get smarter as we use our brains more????
14 August 2007 at 5:09 AM
RE # [That fight over oil reserves will be nothing compared to the wars that will ensue when the starving Chinese, Indians, and Africans invade North America, Russia, and Europe in search for food!]
Untrained people, let alone starving ones, do not form armies capable of invading functioning modern states. In fact, I cannot recall offhand any recorded instance of an army of the starving invading anywhere, anytime - although invading armies may starve after invading, due to “scorched earth” defence, bad weather, and/or logistic failures. Large-scale starvation in China, India or Africa may lead to state collapse, increased levels of attempted unauthorised immigration to North America and Europe, and possible wars of distraction launched against traditional and/or weak enemies by elites desperate to rally their populations, but nonsense of the sort quoted above will merely encourage racism and militarism in North America and Europe.
14 August 2007 at 6:01 AM
Re: 98 (Curtis Metz)
What are you talking about?
The warming following the last ice age peaked around 6000 years ago, followed by a very slow temperature fall:
http://en.wikipedia.org/wiki/Holocene_Climatic_Optimum
And US temperatures are NOT global temperatures, or even arctic temperatures..
Re: 100, 102 (Alistair)
20K warming in Greenland in 3 years? Certainly the removal of permanant arctic ice would be bad, but I wasn’t aware of any research that said it was *that* bad..
14 August 2007 at 6:27 AM
re: 98. “I remember some climatologists back in the late 1970’s predicting that the Earth was heading for the next Ice Age.”
You may want to read about that myth at http://www.realclimate.org/index.php/archives/2005/01/the-global-cooling-myth/
14 August 2007 at 7:09 AM
[[By the way everyone is missing the point. The Earth is warming. It has been warming since the last Ice Age and will continue to warm until the break over point to the next Ice Age is reached no matter what Humanity does. We only have the choice to get to the break over point earlier or later by the actions that we take.]]
Curtis — The world has NOT been warming “since the last ice age.” If you calculate the effects from the assorted Milankovic cycles (it involves a lot of matrix math), you find that we passed the peak of the interglacial 6,000 years ago and the world should now be COOLING. The present warming is not natural. “We’re just coming out of an ice age” doesn’t correspond to reality.
14 August 2007 at 9:32 AM
re 104
“Large-scale starvation in China, India or Africa may lead to state collapse, increased levels of attempted unauthorised immigration to North America and Europe, and possible wars of distraction launched against traditional and/or weak enemies by elites desperate to rally their populations, but nonsense of the sort quoted above will merely encourage racism and militarism in North America and Europe.”
Agreed … to a point. As someone once said, no country is more than a couple of meals from revolution. And from revolution is born chaos.
This is a new age, a nuclear age, and that changes the equation dramatically. Put another way, the worst type of enemy is one that is convinced they’ve nothing to lose.
14 August 2007 at 11:42 AM
Re #108 [As someone once said, no country is more than a couple of meals from revolution. And from revolution is born chaos.]
Well, “someone” was wrong! Food shortages may cause riots, but revolution requires a loss of the ruling elite’s control over a significant segment of its armed forces (and while there’s any available food at all, the armed forces and their dependants will be first in line), or the successful formation of rival forces in an area uncontrolled or very poorly controlled by the ruling elite.
[This is a new age, a nuclear age, and that changes the equation dramatically. Put another way, the worst type of enemy is one that is convinced they’ve nothing to lose.]
Agreed - but the enemy we have to fear is a ruling elite on the edge of losing control, not a starving horde. Even then, such an elite is much more likely to attack a neighbour perceived as weaker than a core power - but there are cases where this could lead to a nuclear war big enough to cause global breakdown.
14 August 2007 at 3:37 PM
I note the NSIDC Arctic Ice News Page http://nsidc.org/news/press/2007_seaiceminimum/20070810_index.html
Particularly figure 5 http://nsidc.org/news/press/2007_seaiceminimum/images/20070814_rate.jpg (and comments).
It seems that this unusually early melt is due to specific conditions: “Taken together, the rapid sea ice losses that we’ve seen in June and July can partly be explained from the effects of this “triple whammy”: it was warm; atmospheric circulation pushed ice away from the coast; and skies have been fairly clear.” (and yes; I have noted the paragraph that follows the above quote)
So before people start incorporating this into considerations of long term melt trend, future years might not quite reach it for a bit. i.e. don’t go expecting this to happen next year. The trend is still worrying enough without possibly unwise extrapolation from one years data.
What particularly interests me with regards the Arctic ice-melt is the effect on Northern Hemisphere climates by impact on jet stream tracks. Obviously there’d be a further impact on permafrost and glacier melt, but this warming with regards sea level rise is a longer term issue. So as with the vagueries of Arctic geo-politics it’s something we’ll find out as we go.
I’m less and less convinced about the utility of equating changes in the Thermohaline Circulation with events such as the Younger Dryas and coming up with “freezes”. Changes in atmosphere and ocean circulation implied seem to me to be far more important for us, due to food impacts. We’ve had odd summer weather this year in the UK (as far as I can see, largely down to the El Nino), a summer that just goes to show how a change in Pole/Equator weather systems can have substantial impacts.
Thanks to William Chapman and all at Cryosphere Today (an all year regular site for me) and Mark Serreze and all at NSIDC for their seasonal roundups. Greatly appreciated by this British amateur climate science enthusiast.
14 August 2007 at 8:13 PM
#102, Alastair must have lived in the Arctic, that is correct, the coldest place for ice is just North of Ellesmere and Northwest Greenland in February when a local High spreads Northwards often generating -50 C conditions at sea level, this creates multy year ice. The open Arctic ocean sea water scenario during winter is a little more complex, the biggest component has something to do with winds, which actually keep Polyneas open at -40 C. Clouds come next, so with say -24.5 C conditions, you can have open water provided it is always windy, or very cloudy with a little less wind. Weather underground Dr Masters, called it right when he said that further South winter will be delayed as well, but the biggest thing is the dynamics now of a cold and warmer zone at the Pole, surely affecting current weather everywhere in the Northern henmisphere. Not so long ago the Pole had a more even distribution of ice and that was the summer/fall weather we were use to.
14 August 2007 at 8:22 PM
I have noticed that each year the main variability and recent ice decline has been in the shallower part of the Arctic Basin. The deepest part of the basin seems to keep its ice coverage each year. I wonder if the recent minimums are the lowest that the ice extent can get given the present state of the arctic climate and it won’t get any worse unless there is more significant arctic warming. One other item of interest is that the reanalysis data from NCEP shows that much of the region of the arctic basin where there is open water was slightly BELOW average in temperature from June through August10th in the height of the melt season. Could it be the warmer waters of the north atlantic ocean(warm phase AMO) that are flowing up into the arctic basin part of the reason for the shallow water melt-off in recent years? The decline really kicks in after the mid 1990s when the AMO flipped to the warm phase. From the late 70s to mid 90s, there was some small decline but the AMO was in the cold phase much of this time and slowly phasing back to the warmer phase. Could this decline be
relayed to the AMO phase at least partly??
14 August 2007 at 9:27 PM
Re 53
The Salinas River is dead. That mud in the lettuce farmer’s fields is made with water from Sierra snow melt.
Re 81, 82
My point was that as much as 80 meters of relatively fresh water floats on the surface of the Arctic, and on which, most of the sea ice floats. This layer of fresh water has a dramatic effect on the formation of Arctic sea ice. Fresh water freezes at higher temperature than sea water.
Frozen bulk sea water sinks. The ice that forms on the surface of the ocean is crystals of fresh water ice that exclude most of the impurities as they freeze. It must be significantly colder for ice crystals to form from sea water than from fresh water. This fresh water ice floats. The impurities rejected from the crystals form cold brine that sinks.
If, and when, the fresh water ice melts, it often leaves a layer of low salinity water which may protect other sea ice from the warmer, saltier water that is below the surface in the Arctic. Thus, sea ice protects the surface layer of fresh water from storm mixing, and, the layer of fresh water protects the sea ice from the warmer saltier water below.
Lose the Arctic sea ice, and storms mix the surface fresh water into the warmer, saltier mid-waters making the reformation of sea ice much more difficult. This is in addition to the loss of albedo as the ice melts.
15 August 2007 at 12:28 AM
Curtis Metz, do you mind my asking, where do you get your beliefs? I’m always curious what sources people have relied on for what they believe to be true, when they come here and post those beliefs.
I went looking for what you posted and found the same thing a few places, but nowhere that looks like a primary source, just people stating the same belief: