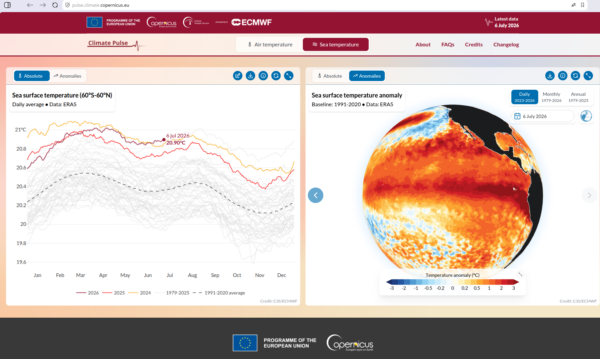
There is a new El Niño out there and it was officially declared already on June 11 by NOAA. This is both unusually early in the year and very soon since the last El Niño in 2023-24. Another remarkable thing is the seasonal forecasts, which for a couple of months have indicated that it may well be at strengths by the end of the year that we have not seen before. All these three aspects combined seem to make this El Niño different to the previous ones.
One question is whether such El Niño events, which is a phase of the El Niño Southern Oscillation (ENSO) phenomenon, is changing because of global warming.
ENSO is a natural phenomenon, but so is also the greenhouse effect. We know that exploitation of fossil resources releases greenhouse gases, such as CO2 and methane, which strengthen the greenhouse effect. This is well-established knowledge.
The first time I was confronted with the question whether global warming also may affect ENSO was back in the 1990s, when I did my D.Phil. on mechanisms responsible for ENSO dynamics.
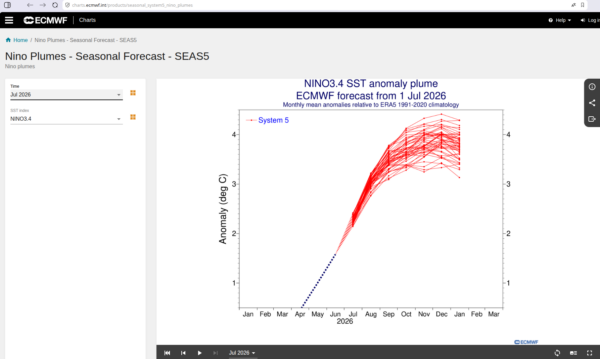
It was also the time seasonal forecasting was established at the European Centre for Medium Range Forecasting (ECMWF), and it was very much focused on ENSO. Since then, the seasonal forecasts for ENSO have made impressive progress and are now quite accurate (see the graphic above).
One indicator central for ENSO is NINO3.4 which provides a measure of how much the average sea surface temperature (SST) over the region 5°S-5°N/120°W-170°W deviates from normal conditions. The latest seasonal forecasts for NINO3.4 are shown in the graphics above.
Jacob Bjerknes was a pioneer on ENSO and the first to realise that El Niño events were coupled with changes in the atmosphere, the Southern Oscillation. Since ENSO indeed involves a coupling between the ocean and the atmosphere, there are several ways that global warming plausibly may affect how ENSO behaves.
The mechanisms that drive the ENSO dynamics include cloud formation, how winds respond to temperature changes, and how Rossby and Kelvin waves propagate in the ocean. In my D.Phil thesis from 1997, I found that the propagation Kelvin waves is affected by changes in the temperature structure. There have been many studies since then, and different global climate model studies (GCMs) have pointed in different directions.
One problem is that the GCMs may not have had detailed descriptions of small-scale parts of the system with sufficiency accuracy to give a robust result, and a quote from the Intergovernmental Panel on Climate Change, assessment report 6 by working group 1 (IPCC AR6 WG1) sums it up:
CMIP6 models are able to reproduce most aspects of the spatial structure and variance of the El Niño–Southern Oscillation (ENSO) and Indian Ocean Basin and Dipole modes of variability (medium confidence). However, despite a slight improvement in CMIP6, some underlying processes are still poorly represented.
In this case, CMIP6 refers to the World Climate Research Programme’s (WCRP) Coupled Model Intercomparison Project phase 6. While the IPCC AR6 WG1 concludes that
There is no consensus from models for a systematic change in amplitude of ENSO sea surface temperature (SST) variability over the 21st century in any of the SSP scenarios assessed,
I still think that this question is not resolved, since there are also studies suggesting that the models indicate that a global warming may result in stronger El Nino events, e.g. Cai et al., (2014) and Fredriksen et al., (2020).
References
- W. Cai, S. Borlace, M. Lengaigne, P. van Rensch, M. Collins, G. Vecchi, A. Timmermann, A. Santoso, M.J. McPhaden, L. Wu, M.H. England, G. Wang, E. Guilyardi, and F. Jin, "Increasing frequency of extreme El Niño events due to greenhouse warming", Nature Climate Change, vol. 4, pp. 111-116, 2014. http://dx.doi.org/10.1038/nclimate2100
- H. Fredriksen, J. Berner, A.C. Subramanian, and A. Capotondi, "How Does El Niño–Southern Oscillation Change Under Global Warming—A First Look at CMIP6", Geophysical Research Letters, vol. 47, 2020. http://dx.doi.org/10.1029/2020GL090640

Here’s the link to the 6 July NOAA CPC update (the ENSO Diagnostic Discussion update is scheduled to post Thursday, 9 July–the link is in the PDF document):
https://www.cpc.ncep.noaa.gov/products/analysis_monitoring/lanina/enso_evolution-status-fcsts-web.pdf
Already, data suggest that El Nino conditions may persist “into” March, though later assessments may well show that conditions persist “through” March, if not into April or beyond.
–and here, the link to the NOAA CPC ENSO Diagnostic Discussion for 9 July 2026:
https://www.cpc.ncep.noaa.gov/products/analysis_monitoring/enso_advisory/ensodisc.pdf
El Nino conditions remaining “through March 2027” (if not into or through April) now look possible or likely.
Thank you for this. I read that this El Nino was different. I was not sure exactly why, but at the summary at the top of the post, unusually short time since the last, an earlier start in the year, and predicted to be stronger than ever, answered that for me.
“I still think that this question is not resolved, since there are also studies suggesting that the models indicate that a global warming may result in stronger El Nino events” I also wondered about how global warming could change or currently is changing El Nino, but sometimes the most interesting answer is we don’t know yet.
thank you, Rasmus, for spelling out what is going on.
Mike
March 2026
https://jimehansen.substack.com/p/super-el-nino-super-warming-is-the
June 2026 Yes, 2026 is on Track to be the Hottest Year https://jimehansen.substack.com/p/yes-2026-is-on-track-to-be-the-hottest
Video https://dai.ly/xah8dwu
Hansen apparently says: “Multiple data sources now indicate that climate sensitivity is 4-5°C, which is consistent with aerosol-cloud modeling that reveals increasing aerosol cooling during the 1970-2005 period of rapid linear warming because of increased global spread of the aerosol sources.”
But scientists have said the period of flat temperatures in the middle of last century (about 1945 – 1975) ended mostly because of REDUCTIONS in total volume of aerosols after the 1970s, because coal power stations scrubbed most of these aerosols.
So we have two very inconsistent claims about the volume of aerosols after 1970. So as a layperson I ask whats going on?
Is it possible that aerosol volumes decreased enough from around 1970 to say about 1990 to allow surface warming to resume in full but around 1990 total aerosol volume increased again thus masking some warming? This would suggest Hansens claims of very high climate sensitivity might be too high. although perhaps still higher then 3.0 deg c. Alternatively, something is very wrong with the accepted wisdom about the flat period of temperatures last century and why it ended.
I’m definitely not a climate change sceptic. I think we are causing dangerous climate change even with medium climate sensitivity. Just curious about what seems like a significant inconsistency.
Nigelj,
This 2025 Zeke Hausfather Explainer ‘How human-caused aerosols are ‘masking’ global warming shows graphics of aerosol load by year peaking 2000-10. What happened back in 1970 was the rate of increase of the aerosol load peaked in the 1970s while the rate of additional GHG climate forcing continued ramping up. The graphic HERE is the source of the one in the Zeke Hausfather Explainer (which itself is too interactive to link-to).
Thanks. Good explanation. I must have misread something about aerosol trends, or it was incorrect.
Rasmus… “One question is whether such El Niño events, which is a phase of the El Niño Southern Oscillation (ENSO) phenomenon, is changing because of global warming. ENSO is a natural phenomenon, but so is also the greenhouse effect. We know that exploitation of fossil resources releases greenhouse gases, such as CO2 and methane, which strengthen the greenhouse effect. This is well-established knowledge.”
If one plots the monthly NINO 3.4 index against the monthly Mauna Loa CO2 going back to 1982 there is no correlation. A positive correlation exists with El-Nino and CO2 and a negative one with La Niña. But none with all three.
Ken Towe: If one plots the monthly NINO 3.4 index against the monthly Mauna Loa CO2 going back to 1982 there is no correlation.
Weather is not climate, Mr. Towe. CO2 affects global climate (timescale of DECADES) so why would you expect correlation at a local MONTHLY scale ???
In other words, garbage (wrong time-scale) in – Ken Towe’s conclusions out.
By your logic, I could disprove anything. For instance – the seasons:
– “ I found no correlation between the temperature measured twice daily and the day of spring.
Therefore, I have proven that there no such a thing as “spring”. ”
(The trick here was to drown the gradual 3-month spring warming SIGNAL – with the much wider short-term NOISE of the day-to-night differences)
As the Greeks would have said.:
“ Let the denier choose the time-scale, and he can prove ANYTHING “
Can you please clarify whether the approximately 4C. projection for the SST anomaly in the 2nd chart is global or specific to the equatorial Pacific? Many thanks.
It is for NINO3.4 which is a limited region: 120W-170W/5S-5N. Also, this is a forecast, not a projection. The nmodel starts with todays statecof the climate.
The Nino 3.4 is the most commonly used index for projections and forecasts..
Rasmus…The Nino 3.4 is the most commonly used index for ENSO projections and forecasts..
– B Tokar : “ 4C. projection for the SST”
– Rasmus: “ this is a forecast, not a projection”
Ken Towe “ The Nino 3.4 is the most commonly used index for projections and forecasts..” half a day later again: “Rasmus…The Nino 3.4 is the most commonly used index for ENSO projections and forecasts..”
And your two posts, Ken, are supposed to correct rasmuses point that the +4C is a forecast nor a projection – how exactly?
As a beginner, is this 4 c projection above normal El Nino or normal SSTs? I’m presuming the latter
What I have not seen addressed, unless I missed in, is that almost the entire North Pacific is very warm. The atmosphere will of course feel this. As such, it strikes me that “typical” el-Nino responses such as a strengthened and eastward extended subtropical jet, might not be in the offing. Other factors are at work.
But isn’t the ENSO subject to the vagaries of the Trade Winds?
Duh.
“But isn’t the ENSO subject to the vagaries of the Trade Winds?”
No. That’s a common misconception as the shift in the winds is a result of ENSO change. The ENSO dipole creates a large temperature differential across the Pacific, and that gives rise to a substantial atmospheric pressure differential. Since wind goes from high pressure to low pressure, that is the shift in winds that are being measured.
P. Pukite: “That’s a common misconception as the shift in the winds is a result of ENSO change. The ENSO dipole creates a large temperature differential across the Pacific and that gives rise to a substantial atmospheric pressure differential.” [thus driving winds – P]
Yes, but winds created by this temperature differential – weaken equatorial upwelling or even reverse it into a downwelling – which means … less cold deep water making it to the surface -> FURTHER increase in temperature in eq. East Pac. and colder water in eq. W. Pacific -> which then drives even stronger winds from W to E, and so on and on and on.
So you replaced one common misconception (“it’s the wind”) with … another misconception (*it’s the temperature”) – while in reality it is a positive feedback loop between temps and wind,
“Since wind goes from high pressure to low pressure, that is the shift in winds that are being measured.”
That is not always the case on a rotating planet. Also depends on latitude and altitude.
Dan Hughes: “That is not always the case on a rotating planet.”
Except we are discussing El Nino – which depends on what happens near the equator, where the Coriolis deflection drops to zero. So Paul Pukite’s “ from high pressure to low pressure ” is a good approximation of ENSO equatorial winds.
In more detail:
– during normal and La Nina years it blows from hot W to colder E (i.e. Walker circulation),
these practically undeflected E-> W winds – drag along warm surface water from E Pac. to West Pacific, and create eq. upwelling – bringing the cold deep water to the surface, thus further increasing the temp difference between E and W, and thus fueling even stronger E->W winds.
– during El Nino – the temp difference weakens/reverses, so the wind weakens/or reverses, the hot water blob in the West starts flow east and on to of that upwelling responsible for cold waters in the East – weakens or reverses into a downwelling (keep the cold deep water away), and with the W several deg. cooler and the E several degrees warmer the wind reversal gets reinforced.
Colder waters in the W means less evaporation which together with the shift in the direction of the winds means => less rain/weaker monsoons in the north/east Australia and South East Asia, while much warmer waters in the E and moisture-laden winds from the Pacific – brings more heavy rains, flooding, and landslides to the western coasts of S. America.
The predictable response has been given by Piotr.
Each term in the component momentum balance equations has a potential to change the mean motion. Along the line for the equator, the Coriolis effect is zero. That info is of little practical use, because we are seldom, if ever, interested in the motions of a line which contain no mass. Both North and South of the equator a Coriolis force is present and acts to change the motion in opposite directions. Generally, the focus is on regions of the atmosphere within which the Coriolis force might be both zero and non-zero.
In the present case, consideration of effects of other momentum terms on the direction of mean motion should be taken into account. It might be an improved approach to simply and explicitly state an assumption about mean motion direction, Easterlies or Westerlies, and check that assumption by data, or other methods.
Evidence of existence of potential, Easterly or Westerly mean motions, is not evidence of existence of outcome.
The default assumption, the Coriolis force can be ignored, is based on sound theoretical basis so long as the equator latitude line is of interest. The assumption implicitly contains additional assumptions about all other terms in the component momentum balance equations, and these should be stated.
A bigger issue, is to use a methodology that is based on an absence of the force in situations for which the conditions at the equator do not obtain. Application of a methodology that has absence of the force implicitly included cannot be justified.
Dan Hughes 18 Jul “ The predictable response has been given by Piotr. ”
The disappointing response has been given by Dan Hughes.
D. Hughes: “ Along the line for the equator, the Coriolis effect is zero. That info is of little practical use, because we are seldom, if ever, interested in the motions of a line which contain no mass.”
That’s your strawman, Mr. Hughes. since nobody here, other than you, was talking about
“the motions of a line which contain no mass.”
D. Hughes: “ both North and South of the equator a Coriolis force is present ”
Thank you, Captain Obvious, but you missed the point – it’s not about “presence” but about strength/significance . In the 0-2 deg. zone – the Coriolis deflection is between 0 and 3.5% of the maximum value, That’s why the trades approaching the equator do not curve as much as winds at higher latitudes, and why the resulting Walker circulation surface winds blow in approximately straight direction along the equator from high pressure toward low pressure.
So while Coriolis is very important to the winds in higher latitudes – in the area of discussion here – near the equator – its effect is at its weakest. Hence my contested by you conclusion:
P. 13 Jul: ” So Paul Pukite’s “ from high pressure to low pressure ” is a good approximation of ENSO equatorial winds.”)
Hint – the phrase “good approximation” does not demand the Coriolis deflection to be zero – it is enough that it is relatively weak (here between 0 and 3.5% of its maximum value).
Dan H. “ The default assumption, the Coriolis force can be ignored, is based on sound theoretical basis so long as the equator latitude line is of interest .”
Since I already made it clear that IT IS of interest here:
P, 13 Jul: “ we are discussing El Nino – which depends on what happens near the equator, ”
– what was the reason for your patronizing tirade?
The official NOAA/Climate position seems to be that during El Nino the normally Easterly trade winds weaken but remain Easterly and during especially strong El Nino, the trade winds might sometimes reverse. The latter might occur along only a portion of the Pacific Ocean, so that both Easterly and Westerly winds can be present.
https://www.climate.gov/news-features/blogs/enso/rise-el-niño-and-la-niña
Woods Hole also indicates Easterly winds during El Niño.
https://www.whoi.edu/ocean-learning-hub/multimedia/el-nino/
I suspect Claude, ChatGPT, Gemini, Grok, GISS NASA, and Plain Google will all report the same info.
It’s the thermal and hydrodynamic coupling between the atmosphere and ocean surface that is the primary driving potential.
Dan Hughes: “The official NOAA/Climate position seems to be that during El Nino the normally Easterly trade winds weaken but remain Easterly and during especially strong El Nino, the trade winds might sometimes reverse”.
Thank you for stating … the obvious? Both Paul .and I know it. How is this supposed to save YOUR patronizing comments to others? If the memory does not serve – let me help:
– Paul Pukite, in the discussion of ENSO: “wind goes from high pressure to low pressure” [so a change in pressure during ENSO would change the winds)
– D. Hughes joins in with: “That is not always the case on a rotating planet.”
– Piotr: “Except we are discussing El Nino – which depends on what happens near the equator, where the Coriolis deflection drops to zero. So Paul Pukite’s “ from high pressure to low pressure ” is a good approximation of ENSO equatorial winds.”
– D. Hughes lectures: “The predictable response has been given by Piotr. [Piotr’s] info is of little practical use, because we are seldom, if ever, interested in the motions of a line which contain no mass.”
– P.: That’s your strawman, Mr. Hughes. since nobody here, other than you, was talking about “the motions of a line which contain no mass.”
D. Hughes: “ both North and South of the equator a Coriolis force is present ”
– P. :” Thank you, Captain Obvious, but you missed the point – it’s not about “presence” but about strength/significance . In the 0-2 deg. zone – the Coriolis deflection is between 0 and 3.5% of the maximum value, So while Coriolis is very important to the winds in higher latitudes – in the area of discussion here – near the equator – its effect is at its weakest. Hence Paul Pukite’s “ from high pressure to low pressure” that you “corrected” – is a good approximation of ENSO equatorial winds.”
So, how is your stating: “The official NOAA/Climate position” supposed to justify your patronizing tone above?
DH said:
“I suspect Claude, ChatGPT, Gemini, Grok, GISS NASA, and Plain Google will all report the same info.”
How about the new on the scene KIMI.ai? https://www.nature.com/articles/d41586-026-02281-2
When prompted, this LLM has significant issues with wind as a causal driver for ENSO:
https://geoenergymath.com/2026/07/24/discussion-of-qbo-cw-enso-w-kimi-ai/
KIMI says: “Wind is not the root cause; it is a co-response alongside SST.”
I’d be interested to see if others can get it to say something different.
A few of the primary papers that anchor the modern theory of ENSO trade-wind dynamics.Bjerknes (1969) is generally considered to have establish the grounding of understanding.
1. Matsuno, T. (1966). “Quasi-Geostrophic Motions in the Equatorial Area.” Journal of the Meteorological Society of Japan, 44(1), 25–43. https://doi.org/10.2151/jmsj1965.44.1_25
2. Bjerknes, J. (1969). “Atmospheric Teleconnections from the Equatorial Pacific.” Monthly Weather Review, 97(3), 163–172. https://journals.ametsoc.org/view/journals/mwre/97/3/1520-0493_1969_097_0163_atftep_2_3_co_2.pdf
3. Wyrtki, K. (1975). “El Niño — The Dynamic Response of the Equatorial Pacific Ocean to Atmospheric Forcing.” Journal of Physical Oceanography, 5(4), 572–584. https://doi.org/10.1175/1520-0485(1975)005%3C0572:ENTDRO%3E2.0.CO;2
4. Gill, A.E. (1980). “Some Simple Solutions for Heat-Induced Tropical Circulation.” Quarterly Journal of the Royal Meteorological Society, 106(449), 447–462. https://doi.org/10.1002/qj.49710644905
5. Cane, M.A. & Zebiak, S.E. (1985). “A Theory for El Niño and the Southern Oscillation.” Science, 228(4703), 1085–1087. https://doi.org/10.1126/science.228.4703.1085
6. Rodríguez-Fonseca, B., Calvo-Miguélez, E., Montoya-Carramolino, L. et al. ENSO impacts on marine ecosystems and fisheries in the tropical and South Atlantic. Nat Rev Earth Environ 7, 43–59 (2026). https://doi.org/10.1038/s43017-025-00742-2
7. Climate.gov. The Rise of El Niño and La Niña https://www.climate.gov/news-features/blogs/enso/rise-el-niño-and-la-niña
8. Woods Hole Oceanographic Institution, Global map illustrating changes in sea surface temperatures, wind, and weather patterns that define an El Niño event. https://www.whoi.edu/ocean-learning-hub/multimedia/el-nino/
9. Chunzai Wang, Clara Deser, Jin-Yi Yu, Pedro DiNezio, and Amy Clement “El Niño-Southern Oscillation (ENSO): A Review” In P.W. Glynn et al. (eds.), Coral Reefs of the Eastern Tropical Pacific, Coral Reefs of the World 8, Published 2017. https://DOI 10.1007/978-94-017-7499-4_4
DH provides some historical refs to trade-wind causality but misses all the recent info on equatorial wind sources. For example, the QBO of stratospheric winds show a reversal in direction that is directly related to the nodal forcing of the solar declination and lunar declination orbit.
https://imagizer.imageshack.com/img923/7726/MRnZ6k.png
Here’s a Claude evaluation of the model
https://gist.github.com/pukpr/06a0e461d0d9b64ca573ed634b54ad8b
Dan Hughes 2 Aug 2026 “A few of the primary papers that anchor the modern theory of ENSO trade-wind dynamics.”
Anything in these primary papers that falsifies my response to you and support your claims?
Or do you just throw “a few of the primary papers” so people think that you must be right . because otherwise why you wouldn’t throw around primary papers if they didn’t support your lecturing Paul Pukite that in the equatorial zone winds do NOT move from higher pressure toward lower pressure.
Zeke Hausfather just posted “The Strongest El Nino Ever” on his and Andy Dessler’s Substack, https://www.theclimatebrink.com/. In answer to another reader’s question, Kevin Trenberth offered a lucid, concise explanation of how ENSO moves heat around the globe. I then asked him:
“Are the trade winds being altered as the excess greenhouse warming circulates around the globe?Zeke Hausfather just posted “The Strongest El Nino Ever” on his and Andy Dessler’s Substack, https://www.theclimatebrink.com/. In answer to another reader’s question, Dr. Trenberth offered a lucid, concise explanation of how ENSO moves heat around the globe. I then asked him:
“Are the trade winds being altered as the excess greenhouse warming circulates around the globe? Shifting latitudes as the Hadley cells expand poleward, perhaps?”
He blessed me with another generous response: https://www.theclimatebrink.com/p/the-strongest-el-nino-ever/comment/294670174. The short answer is, yes and yes!
Drat. Too much copy-pasta! Beware over-editing.
Kevin Trenberth – The wider expanse of subsiding air into the subtropics increases sunshine and heating and is a positive feedback. Hansen and others have blamed this on changes in aerosols, but it is much more from changes in clouds and circulation.
Why to they such basic facts wring, and how can you then trust them with anything else? Did Trenberth even read what Hansen was writing imn 2023 onwards about aerosols and the feedback and everything else driving the rapid warming? Or is it easier to just listen to what say and make it up as he goes because Hansen is deemed an radical outsider now?
The proof is here https://jimehansen.substack.com/ and https://www.columbia.edu/~jeh1/ and in his published peer-reviewed research papers.
Is your Zeke the same Zeke who while drawing attention often to Hansen as if it’s an obsession of his, said this last March?
writing: “My central estimate of 1.57C is a bit lower than Hansen’s 1.7C, in part because I’m assuming a moderately strong El Nino and somewhat lower warming rates (0.27C/decade in Forster et al) then the 0.31C/decade that Hansen assumes. But his estimates remain within my (admittedly large) prediction error bars.”
https://www.theclimatebrink.com/p/my-2026-and-2027-global-temperature
As opposed that is to Hansen was saying this about the same time:
“The 300 m temperature already assures that we will have an El Nino in 2026-27. The March average of the 300 m temperature anomaly exceeds +1°C. At that point, it is consistent with either a Super El Nino (Fig. 2a) or an ordinary El Nino (Fig. 2b). However, in the first week of April, the 300 m anomaly reaches +1.6°C (Fig. 3). This increasing heat anomaly is a result of the reinforcing Kelvin wave (Fig. 4, left) traveling from west to east (see the discussion in our prior El Nino post[4]). This Kelvin wave was boosted by recent westerly wind anomalies (Fig. 4, right).
We will update these figures on our website[1] at weekly and monthly intervals until the magnitude of the El Nino is clear. ” April 15
https://jimehansen.substack.com/p/super-duper-el-nino
and before that
https://jimehansen.substack.com/p/runaway-climate-the-point-of-no-return and
https://jimehansen.substack.com/p/super-el-nino-super-warming-is-the
and here in 2025!!!
https://jimehansen.substack.com/p/global-temperature-in-2025-2026-2027
Then there is the published peer reviewed papers:
See Global Warming Has Accelerated: Are the United Nations and the Public Well-Informed?
Fingerprinting the Climate Acceleration Mechanisms and
Reconciling Our Analysis and Aerosol Models
“The main conclusion is that modern temperature change does not provide a tight constraint on climate sensitivity because aerosol forcing is not measured; however, if aerosol forcing is nonlinear (as in Aerosols A and B), IPCC (and thus most of the scientific community) has underestimated climate sensitivity.”
and
“This difficulty has led to consternation that “something is wrong.” In contrast, Aerosols A and B scenarios, with their associated climate sensitivities (∼4.5 and 6 °C for 2 × CO2), the ship aerosol forcing, and a +0.2 °C El Niño, readily reach +1.6 °C current warming.”
and
“Climate feedbacks are real; paleoclimate evidence shows that “fast” feedbacks (water vapor, clouds, and sea ice) amplify climate sensitivity from 1.2 °CFootnote91 for doubled CO2 with no feedbacks to as much as 4-5 °C, i.e., these well-known feedbacks more than triple the equilibrium climate response. ”
https://www.tandfonline.com/doi/full/10.1080/00139157.2025.2434494#abstract
Then there is the Global warming in the pipeline paper which Trenberth may not have read (?)
. However, decline of aerosol emissions since 2010 should increase the 1970–2010 global warming rate of 0.18°C per decade to a post-2010 rate of at least 0.27°C per decade. Thus, under the present geopolitical approach to GHG emissions, global warming will exceed 1.5°C in the 2020s and 2°C before 2050.
The Johnny Come Lately cohort are a dime a dozen.
Like Zeke Hausfather, again showing up a day late and dollar short.
Another data point underpinning my conclusions of abject unreliability of ZH AD KT et al as credible sources on Climate trajectories, present drivers of acceleration and ongoing warming growth toward multiple tipping points of no return:
Q. So, why is it so strong? Just normal variability, or does climate change affect El Niño intensity?
Zeke Hausfather
A. Its a bit unclear if climate change is making strong El Nino events more likely (normalizing for long-term warming). It is strongly debated on the literature with no clear consensus.
For several years now this equals continually minimizing the state of the climate system, minimizing current trajectories and simultaneously not knowing what is happening nor why it is so.
Meanwhile the greater “controlling consensus cabal” have been incapable of defining the extent of and the cause of the 2023-24 massive and sudden temperature anomaly spike as another one approaches at pace.
While they continue to dismiss, ignore and minimize other findings such as F&R’s +0.33 C acceleration rate kicking the can down the road by hiding behind whatever the CMIP7 might produce.
Modelling the Map is not equate to Reality. Especially when the questionable processes and output is decade late.
What about the deep ocean warming, in models it shows distinct patterns and ENSO modulation. Looking forward to read more about this.
Deep ocean warming-induced El Niño changes
Ai: Plausible is an indirect, long-term influence through the global climate “mean state”: changes to ocean stratification/thermocline and deep-ocean heat uptake can alter how efficiently equatorial Pacific feedbacks grow, which changes ENSO characteristics. For example, modeling work shows that deep-ocean warming can intensify/alter El Niño variability via subsurface stratification and feedback changes in the Pacific.
Very interesting indeed. To me it seems obvious, that you would expect a strengthening of El Niño events – sooner or later – from a growing heat content in the upper layers of most of all oceans, but that is probably too simple. Maybe you could as well expect a kind of weakening or slowing down of this very complex oscillating system (interconnected with others) as a result of weakening temperature contrasts in different parts of the oceans? Though I would suspect this effect to be more long-term, happening after the earth climate system crossing several tipping points, some of which maybe even hitherto unknown or unnoticed by science. I wonder what paleoclimatology has to say on the subject of ENSO during warmer climates as fx. during the warmest period of the last interglacial, Eem, when the main sea level was 6-9 meters above the current, probably caused by the deglaciation of West Antarctica (since the Greenland Ice sheet was intact from N to S, even if somewhat reduced) or in earlier warmer climates?
The answers seem inconclusive: 1) “Future increase in extreme El Niño supported by past glacial changes” – https://www.nature.com/articles/s41586-024-07984-y (Eem) points to a strengthening of ENSO based on models, and a weakening during glacials: “Here we uncover a mechanism using numerical simulations that drives consistent changes in response to past and future forcings, allowing model validation against palaeoclimate data. The simulated mechanism is consistent with the dynamics of observed extreme El Niño events, which develop when western Pacific warm pool waters expand rapidly eastwards because of strongly coupled ocean currents and winds6,7. These coupled interactions weaken under glacial conditions because of a deeper mixed layer driven by a stronger Walker circulation. The resulting decrease in ENSO variability and extreme El Niño occurrence is supported by a series of tropical Pacific palaeoceanographic records showing reduced glacial temperature variability within key ENSO-sensitive oceanic regions, including new data from the central equatorial Pacific. The model–data agreement on past variability, together with the consistent mechanism across climatic states, supports the prediction of a shallower mixed layer and weaker Walker circulation driving more frequent extreme El Niño genesis under greenhouse warming.”
Note that the eemian warming wasn’t caused by higher CO2 levels in the troposphere, they were never above 280 ppmv.. Nor any known changes in aearosols etc. Methane levels were much lower than current https://agupubs.onlinelibrary.wiley.com/doi/10.1029/2023GB007875 . This article (1) doesn’t consider these themes, since they only study the last glacial maximum, 21 kyr BP.
2) “Mid-Pliocene El Niño/Southern Oscillation suppressed by Pacific intertropical convergence zone shift” https://www.nature.com/articles/s41561-022-00999-y?fromPaywallRec=false . This article seems (I have only read the abstract) not to consider that a) at this time was the Panaman isthmus maybe still (partly) open and hence b) the AMOC not yet established. The Greenland ice sheet was just beginning to form, bottom layers of icecores suggest a deglaciated Greenland then.
We can still only conclude that “we are in uncharted waters” as Gavin Schmidt said in 2023 when the currently ongoing acceleration in global warming came up first. Or? Can we get beyond the rather obscure and unimportant deliberations/ditherings about less than one tenth of a degree C in global mean up or down next year? Much more fateful things are at stake for billions of people: the consequences in ten years, crossing the two-degree C limit and very fast moving further up. As prognosticized by Rahmstorf and Foster recently https://agupubs.onlinelibrary.wiley.com/doi/full/10.1029/2025GL118804 .
I cenrtainly hope that the critique by James Hansen here “Our scientific papers[5],[6] evoked a strange response from several scientists who serve as public faces of the modeling community: ad hominem criticisms, but no response to the scientific issues that we raised. We have called out[7] this odd response to draw attention to failure of the media to provide quality science reporting on climate change. Given the enormous implications of climate change for the public, especially young people, it is incumbent on the media to ask questions of scientists and demand understandable scientific explanation of their conclusions”
https://jimehansen.substack.com/p/yes-2026-is-on-track-to-be-the-hottest – can soon be cleared up here on realclimate. Which “strange” and “ad hominem” responses does Hansen implicate? Can someone enlighten us? What is the real scientific issue at hand (if there is one, which to me seems to be the case)?
My main observation is this: the current man-made raising ot the tropospheric CO2 and methane levels has no known natural precursors in the whole history of about 3 billion years of life on this planet. Not even close! The CO2 emissions in the end permian 251,9 myrs ago were larger than ours for sure, but they took over 75000 years! We are going far faster than that. That’s certainly no reason to relax and think “we just need to adapt a little” which is now becomiing the mainstream political and “scientific” (bureaucratic) message from people who are adapting – but unfortunately more to fascism 2.0, model Trump and Musk, Putin etc. than to the rising resistance.
KVJ..You may have missed this?
Nature 461, 1110-1113 (22 October 2009)
Atmospheric carbon dioxide through the Eocene–Oligocene climate transition
Paul N. Pearson, Gavin L. Foster, Bridget S. Wade
Geological and geochemical evidence indicates that the Antarctic ice sheet formed during the Eocene–Oligocene transition 33.5–34.0 million years ago. Modelling studies suggest that such ice-sheet formation might have been triggered when atmospheric carbon dioxide levels fell below a critical threshold of ~750 p.p.m.v. During maximum ice-sheet growth, pCO2 was between 450 and 1,500 p.p.m.v., with a central estimate of 760 p.p.m.v.
760 ppm is much higher than today’s value. And the Eocene plant life on land was lush while the carbonate plankton thrived..
KT: 760 ppm is much higher than today’s value. And the Eocene plant life on land was lush while the carbonate plankton thrived..
BPL: But during the Eocene, there were not 8 billion people depending on a stable climate for their agriculture; nor were there trillions of dollars worth of coastal infrastructure in danger of submergence.
EarthClimate: “As reported in the previous study, the deep ocean acts as a stove, continuously supplying heat to the ocean surface”
in the high latitudes. NOT at the discussed here equator/ the ITCZ. Here, the deep ocean is much colder than the surface water. That’s why the ocean off Peru is not the best place to go for a vacation swim – despite being in the tropics, the surface water the water is typically 16-20C – because of the cold Humboldt current and the upwelling bringing very cold deep water to the surface. To swim there you have to time your visit to the El Nino, which disrupts Humboldt current and blocks the upwelling, which increases the surface water temps by 4-8C.
So for this region – deep ocean is not “a stove”, but a cooler.
Emergent climate change patterns originating from deep ocean warming in climate mitigation scenarios
“EarthClimate” 14 Jul 7.47am: “AI: The eastern Pacific refers to the eastern portion of the Pacific Ocean,”
Thank you, Captain Obvious, without you quoting AI on that we would have no idea.
Now the harder part – prove YOUR claim that the “deep ocean” in this equatorial eastern Pacific – “acts like a stove, continuously supplying heat to the ocean surface,”
Let me help you with your authority:
AI: “The deep water temperature in the eastern equatorial Pacific typically ranges from 1C to 4C”
and
AI: “Sea surface temperatures in the eastern equatorial Pacific currently range from 28C to 29C”.
And if suddenly stopped believing AI: let your own eyes be the judge – here is a vertical profile of T from NOAA. Unfortunately it is truncated at mere 500m (ocean there is typically >4km deep), but even this gives you a good idea what is hotter – “the surface waters” or the “deep ocean”:
https://www.ncei.noaa.gov/monitoring-content/sotc/enso/2004/may/dep-lon-200405-eq-0-500-pg.gif
“Deep ocean there acts like a stove, continuously supplying heat to the ocean surface, you say?
Explained here, starting 7 minutes in https://www.youtube.com/watch?v=Mqtt8Ln35t4
Notice that talk about deep ocean should also point to origin to put this in better perspective.
In Re to Piotr, 15 Jul 2026 at 7:47 PM,
https://www.realclimate.org/index.php/archives/2026/07/this-new-el-nino-is-different/#comment-849797
Hello Piotr,
I parsed through the cited article and have not identified a specific part thereof that might form a basis for the conclusion in the abstract that you have objected.
It seems to be indeed unclear how the authors of the article arrived at the conclusion that the heat stored in the deep sea can warm not only polar regions and/or sea regions wherein the sea surface temperature falls below the deep sea water temperature at least during winter seasons, but also the equatorial eastern Pacific.
If “EarthClimate” found this basis, I would highly appreciate their hint thereto.
Greetings
Tomáš
Mr. E. Climate: ” Explained here, starting 7 minutes in https://www.youtube.com/watch?v=Mqtt… ”
a link to a clip on Youtube proves nothing – I am sure that there are clips that starting x minutes in – show the the Earth is flat. Does not make it magically so. So if you have anything to say – say it in your own words. Here by:
1. proving the claim that in equatorial eastern Pacific “the deep ocean acts as a stove, continuously supplying heat to the ocean surface”
2. disproving the oceanographic knowledge from the last 100+ years that the opposite is true (the deep ocean there is much colder than the surface water and therefore can NOT act as a stove, but only as cooler)
3. disproving the vertical profiles of temperature from the literature I have referred to – that show the same as p.2 and thus challenge your stove claim) – namely: I have posted – which shows T at 500m is ~ 9C while the surface water shows at least 25C.
In case if the arithmetic wasn’t your strongest suit, 25> 9,. Thus you can’t HEAT 25C water by an upwelling of 9C water. Consequently, the deep water there can NOT “act as stove” to surface water, but only as its cooler.
Now, to maintain any pretense of your intellectual integrity – you have to succeed in all three points. But you can’t in ANY of the 3. Which means that you promote fruits of your staggering oceanographic and climatic ignorance. Ironic for somebody who chose such an ambitious handle as: “Earth Climate”. That’s as if somebody with IQ 50 – chose the handle “Genius”.
in Re to EarthClimate, 16 Jul 2026 at 8:53 AM,
https://www.realclimate.org/index.php/archives/2026/07/this-new-el-nino-is-different/#comment-849800
Dear Sir or Madam,
The video you referred to does not seem to explain the claim (that heat release from the deep ocean can warm surface layer in the equatorial eastern Pacific) from the abstract of the Ji-Hoon Oh et al article
https://www.nature.com/articles/s41558-024-01928-0
cited by you.
I think so because the video pertains to ENSO oscillations and speaks about heat accumulated in the layer above thermocline, in depths between 50 and 250 m, while the cited article speaks about the heat accumulated in the “deep ocean” and released after hypothetical decrease of CO2 radiative forcing to the level before the spike in this forcing that caused the said heat accumulation.
Can you comment?
Best regards
Tomáš
Tomas to “Earth Climate”: Dear Sir or Madam, The video you referred to does not seem to explain the claim that [deep heat release from the deep ocean can warm surface layer in the equatorial eastern Pacific. Can you comment?
Don’t hold you breath , Tomas. Your “Dear Sir or Madam” is a troll – so it did not read and/or comprehended the original paper it quoted. The troll is of the spaghetti-school of discussion”: if you throw enough spaghetti at the wall, some it will stick
—–
* please note that “spaghetti” is an euphemism here
From this troll’s production on RC, and the tendency for the pompous handles (“Earth Climate”) – it’s probably just a new persona of the Multi-troll, but who cares (other than admins if they wanted to exercise moderation).
A typical sealioning troll, picks up a subject that has been addressed in the past (here: the very basics of ENSO known since the last century) and floods the thread with multiple, lengthy posts, jammed with the AI definitions and AI-found references taken out of context to appear relevant to the subject (akin to random Google search of a phrase like “El Nino” or “ENSO”). Since the troll does not understand what it quoted – it does not answer question how is this relevant to the subject, but escapes forward with … multiple new posts and excerpts, claiming that they answer all the criticisms, but never able to show HOW.
“Earth Climate” is a doomer – seeding apathy among the public – the sky is falling so there is no point in reducing our use of fossil fuels, i.e. doomers present our actions as perfect-or-nothing proposition – as if the world with 400 ppm was as bad as one with 800 ppm.
And being a troll, it disrupts/hijacks the discussion by flooding the thread with AI slob – irrelevant or at best tangential to the original subject. And by “owning the RC” – discourages passer-by from staying on the site and learning something new (the too high troll-to-signal ratio).
E. Climate could be a paid shill for the fossil fuel interests, or could do it for free, being what Lenin called a “useful idiot of Russia” – one who for his own ideology or the need to build up his ego (“I am owning the RC”) – ends up playing straight into the hands of Russia which economy, ability to control the society and wage war on others, depends critically on the world buying their oil and gas.
But E. Climate’s motivation does not really matter – by their fruits, not their rationalizations of their actions, you shall know them.
Karsten V. Johansen : “ Nonetheless the IPCC continues to postulate that today’s CO2 levels can be found not further back than 3 myrs BP, 20 myrs later than Cui et al.”
Since you are attacking the integrity of the IPCC – _Quote_ the IPCC words on which you based your attack. Their words, not your rendition of them. Particularly if you missed the basis of their statement:
KVJ: “but what exactly they base this result upon seems unclear”
It’s not exactly a rocket science – the most reliable high-resolution information on the past Co2 is locked in the air bubbles trapped in ice, and the age of this ice, and hence its bubbles, is limited:
“ – continuous CO2 records reach back 800,000 years,
– continuous core drilling projects reached recently 1.2 million years [no Co2 profiles yet]
– discontinuous “blue ice” snapshot samples extend to 3 million years. ”
Before “3mln years” we don’t have even these ” discontinuous “blue ice” snapshots”, and the indirect proxies of CO2 are much less reliable. And that’s why climate science often say that Co2 is the highest in at least 800,000 yrs or in at least 2-3 mln years (i.e. the age of the less reliable, with more gaps, blue ice). And sorry, you can’t assume that the uncertainty is your friend
And that’s why IPCC does not assume that, and does not want to OVERSTATE its case – because if they listened to you, i.e if they ignored the uncertainty associated with the lack of ice trapped Co2 -and stated : “the highest CO2 in the last 23 or 26 mln years” – they would hand a weapon into the hands of the deniers:
If somebody in the future found a reliable record of CO2, anytime between the 3 and 26 mln years that were HIGHER than today’s value – all the hell would break loose:
the Deniers would point to this fact as a proof that the IPCC is ideologically-motivated alarmists, and if the IPCC stated untruth once – then we can’t believe ANYTHING they say, about the past, or about the future. And therefore we can burn as much fossil fuels as we want since you can’t trust IPCC
And this is how the Doomers end up in bed with the Deniers – you BOTH try to discredit IPCC and that you do it from different motivations – DOES NOT MATTER: by the fruits, not their motivations, you shall know them.
in Re to Piotr, 22 Jul 2026 at 9:26 AM,
https://www.realclimate.org/index.php/archives/2026/07/this-new-el-nino-is-different/#comment-849938
Hello Piotr,
As “EarthClimate” failed to respond, it is possible that your disdain is fully justified. It at least appears that they have cited something they have not read or understood and are reluctant to admit it.
I am, however, more interested in the Nature Climate Change article they have cited than in “EarthClimate” themselves.
The cited conclusion (“The surface ocean warming is pronounced over subpolar to polar regions and the equatorial eastern Pacific where oceans are weakly stratified to allow vigorous heat release from the deep ocean to the surface layer.”) sounds to me reasonably with respect to polar or subpolar regions, however, I have not grasped yet how the authors supported validity of this claim also for the equatorial eastern Pacific.
Greetings
Tomáš
Ken Towe, I am fully aware, that Paul N. Pearson in 2013 wrote a note about these themes, entitled “When was the CO2 last above 400 ppmv?” The conclusion in this note was, that there hasn’t been a stable CO2 level above 400 ppmv for the last 26 myrs.
A scientific article from 2020 points in the same direction: Cui et al.: “A 23 m.y. record of low atmospheric CO2″, Geology (2020) 48 (9): 888–892” https://pubs.geoscienceworld.org/gsa/geology/article/48/9/888/586769/A-23-m-y-record-of-low-atmospheric-CO2 .
From the abstract: “Here, we present a new CO2 record across the past 23 m.y. of Earth history based on the δ13C value of terrestrial C3 plant remains, using a method applicable to the entire ∼400 m.y. history of C3 photosynthesis on land. Across the past 23 m.y., CO2 likely ranged between ∼230 ppmv and 350 ppmv (68% confidence interval: ∼170–540 ppm). CO2 was found to be highest during the early and middle Miocene and likely below present-day levels during the middle Pliocene (84th percentile: ∼400 ppmv). These data suggest present-day CO2 (412 ppmv) exceeds the highest levels that Earth experienced at least since the Miocene, further highlighting the present-day disruption of long-established CO2 trends within Earth’s atmosphere.”
Nonetheless the IPCC continues to postulate that today’s CO2 levels can be found not further back than 3 myrs BP, 20 myrs later than Cui et al., but what exactly they base this result upon seems unclear. As is often the case with the IPCC “consensus”, the exact sources of it seem a bit dodgy: how was the concensus established, when most scientific results point to much older datings of naturally high CO2-levels? This is of the utmost importance, since it implicates that the current high and fast rising CO2 level is a much more serious and dangerous matter than the impression you get from the IPCC reports.
It seens to me that you don’t need to be Sherlock Holmes to sense a connection between this matter and *the fact that the IPCCs COPs still after more than forty years have never been able to agree upon the evident scientific fact that we need to cut fossil fuel use very fast to avoid very dangerous climate change.* The source of the COP/IPCCs unrealisticly optimistic conclusions are obviously very powerful fossil fuel capital lobbying groups and their denialist propaganda, not science. As concluded many years ago by James Hansen, Naomi Oreskes and many others.
Karsten V. Johansen: “ Nonetheless the IPCC continues to postulate that today’s CO2 levels can be found not further back than 3 myrs BP, 20 myrs later than Cui et al., but what exactly they base this result upon seems unclear. As is often the case with the IPCC “consensus”, the exact sources of it seem a bit dodgy: how was the concensus established, when most scientific results point to much older datings of naturally high CO2-levels?”
My answer to that claim got accidently posted _before_ your post. In short, your conspiracy theory (KVJ: “ you don’t need to be Sherlock Holmes to sense […] the fact that the IPCCs COPs still after more than forty years have never been able to agree upon the evident scientific fact that we need to cut fossil fuel use very fast</i") is based on your ignorance and arrogance:
– the reason why the IPCC may have said (you never quoted the original) that the CO2 wasn't as high in at least 3mln years – has to do with the fact that we don't have any direct information on Co2 from Co2 trapped in ice bubbles older than 3 mln years: (" discontinuous “blue ice” snapshot samples extend to 3 million years ” Before 3 mln years we no longer have direct direct measurements of Co2 in ice bubbles, but merely various indirect PROXIES, much less accurate and more sparse. A good scientist does not assume, like you do – that the uncertainty and not enough data are their friend:
P: “And that’s why IPCC does not assume that, and does not want to OVERSTATE its case – because if they listened to you, i.e if they ignored the uncertainty associated with the lack of ice trapped Co2 -and stated : “the highest CO2 in the last 23 or 26 mln years” – they would hand a weapon into the hands of the deniers:
If somebody in the future found a reliable record of CO2, anytime between the 3 and 26 mln years that were HIGHER than today’s value – all the hell would break loose”
====
Update: you don’t have wait “for the future” – 3 years _after_ your Cui et al., 2020 and their 23 mln yr,, Honisch et al 2023 shows that around 15 mln yers ago for several mln. years – Co2 was higher that it is today’s.
Even more recent Judd et al 2024 seems to shows higher than today Co2 – barely SEVERAL mln years ago.
With you lecturing IPCC on scientific literature on past CO2 – you are obviously aware of these more recent papers, right?
And if IPCC listened to Karsten V. Johansen and announced that Co2 “hasn’t been that high since 23 mln yrs ago” then the Deniers would point to these newer papers as a “proof” that the IPCC is ideologically-motivated alarmists. And if the IPCC stated untruth once (“23 mln years”) – then we can’t believe ANYTHING they say, about the past, or about the future. And therefore “we can burn as much fossil fuels as we want. because we simply can’t trust anything IPCC says”.
“And this is how the Doomers end up in bed with the Deniers – you BOTH try to discredit IPCC. That you do it from different motivations – DOES NOT MATTER: by the fruits, not their motivations, you shall know them.”
In other words – If you didn’t exist – the Deniers would have to invent you.
KT: “760 ppm is much higher than today’s value.”
Not sure what point is being attempted here, but there is a property called “hysteresis” which applies to many natural and engineered systems, by which critical values for state transitions may depend on the direction from which they are approached.
It’s very possible in principle that you need 760 ppm to initiate polar ice sheet formation, but much lower values to sustain them–and potentially much lower levels to transistion to an ice-free state as well.
Update: looking at the KVJ post to which KT replied, it seems that we have a case of apples and oranges being compared: the former appears to be talking about rate of change while the latter is attempting to rebut based on absolute value.
Ken Towe KVJ..You may have missed this?
Your patronizing comment to KVJ is based on your ignorance – The Nature’s paper you quote
” Eocene–Oligocene transition 33.5–34.0 million years ago Ice-sheet formation might have been triggered when atmospheric carbon dioxide levels fell below a critical threshold of ~750 p.p.m.v.760 ppm is much higher than today’s value.”
is irrelevant to study mentioning Eemian warming quoted by KVJ:
“Eem” is not “Eocene”, and the glaciation of Antarctica which took 7 million years, is a very different process than deglaciation of the Northern hemisphere glacial icesheets during ~15,000 of Eemian warming.
So KVJ miss nothing – it was you, Ken Towe, self-confidently lectured KVJ that he should compare apples and orangutans. Therefore, your post says nothing about KVJ, but a lot about you, Ken Towe.
KVJ..You may have missed this…it wasn’t posted earlier…
Nature 461, 1110-1113 (22 October 2009)
Atmospheric carbon dioxide through the Eocene–Oligocene climate transition
Paul N. Pearson, Gavin L. Foster, Bridget S. Wade
Geological and geochemical evidence indicates that the Antarctic ice sheet formed during the Eocene–Oligocene transition 33.5–34.0 million years ago. Modelling studies suggest that such ice-sheet formation might have been triggered when atmospheric carbon dioxide levels fell below a critical threshold of ~750 p.p.m.v. During maximum ice-sheet growth, pCO2 was between 450 and 1,500 p.p.m.v., with a central estimate of 760 p.p.m.v.
760 ppm is much higher than today’s value. And the Eocene plant life on land was lush while the carbonate plankton thrived..
KVJ: The CO2 emissions in the end permian 251,9 myrs ago were larger than ours for sure, but they took over 75000 years!
KT: 760 ppm is much higher than today’s value. And the Eocene plant life on land was lush while the carbonate plankton thrived..
MA: Oh, Ken, what makes you think Karsten missed that? The Eocene-Oligocene CO2 maximum took half a million years! What’s different about the globe, and the accelerating rate of increase, today? In any case, perhaps you missed “The enigma of Oligocene climate and global surface temperature evolution” (https://www.pnas.org/doi/abs/10.1073/pnas.2003914117. From the abstract (my bolding):
In this relatively low CO2 Oligocene world (∼300 to 700 ppm), warm climates similar to those of the late Eocene continued with only brief interruptions, while the Antarctic ice sheet waxed and waned. SSTs are spatially heterogenous, but generally support late Oligocene warming coincident with declining atmospheric CO2. This Oligocene warmth, especially at high latitudes, belies a simple relationship between climate and atmospheric CO2 and/or ocean gateways, and is only partially explained by current climate models. Although the dominant climate drivers of this enigmatic Oligocene world remain unclear, our results help fill a gap in understanding past Cenozoic climates and the way long-term climate sensitivity responded to varying background climate states.
IOW, keep it as simple as you can, but no simpler: it will never convincer pseudoskeptics anyway.
KT: 760 ppm is much higher than today’s value. And the Eocene plant life on land was lush while the carbonate plankton thrived..
Except that it was a … different life. Current “lush plant life” on land is adapted to 280 ppm, not to your 760ppm. And they had 100,000s or millions of years to evolve adaptations, not a few decades or centuries. And if you haven’t noticed, 33.5–34.0 million years ago, there were no humans nor even our ancestral species.
As for the carbonate marine organisms “thriving” – those again were different than those that thrive today in lower-Co2 seawater – the higher the CO2 the much more difficult survival of the organisms making their shells from the more soluble forms of carbonates – aragonite and high-Mg calcite – this include such an unimportant taxa as pteropods and coral reef-making corals and calcareous red-algae.
Ocean acidification from increased CO2 amplifies the damage of coral reefs caused already by bleaching due to increasing frequent ocean heatwave under higher CO2. Again – if the changes were spread over geological time-scale – reef-making corals could perhaps move into colder waters, or perhaps new species evolved to replace them although most likely will be a formation of a “reef gap” – periods of millions of years without reef-making aragonite corals, replaced with the non-reef making soft corals using calcite – with the resulting loss of the single most productive and supporting the highest diversity habitat on Earth
So much for your belief that the oceanic life will be “thriving” under current Co2 increase rate.
P.S. What are you doing for living, Ken? I ask because I am trying to establish the motivation for your posting activity here: are your financially benefitting fossil fuels, or are you what Lenin called a “useful idiot of Russia” and of other petro-states, whose regimes, wealth of their oligarchs, and ability to control their population and wage wars on others – depends on convincing the world to what you, Ken, promote here – that that the world with much higher Co2 (“760 ppm of CO2”) would have a “lush plant life” and “thriving” oceans. .
I’ve seen informed comment – Michelle L’Heureux – that SST in tropical Pacific relative to extant global SST e.g. NOAA’s RONI – rather than to average (past) ENSO zone temperatures – may be a better predictor of the strength of weather effects. I’m not so informed as can offer any judgement but it seemed to make sense.
That differences in SST are a major driver of wind and weather patterns seems kinda fundamental.
This was just posted..
The Strongest El Niño Ever
A new study finds shorter ENSO frequency, and broader modulation of the climate system. Excerpts from the pre-print..
Changes in El Niño–Southern Oscillation and global frequency entrainment
“declared already on June 11 by NOAA. This is both unusually early in the year”
Of the previous 10 El Nino declarations, 4 were earlier and 6 were later.
This one does not seem particularly unusual
Useful Bookmarks
Climate Uncensored
What Path is the Real World On?
James Hansen, Pushker Kharecha, Dylan Morgan, Jasen Vest
Climate Science, Awareness and Solutions (CSAS)
DATA
https://www.columbia.edu/~jeh1/Data/
El Nino & La Nina DATA
ENSO indices, upper-ocean temperature, and their relationship to global surface temperature.
Figures on this page
1. Recent ENSO and global temperature
2. Extended ENSO indices (1950–present)
3. ENSO and global temperature relationships
4. ENSO cycle comparisons: Nino3.4 SST, RONI, and upper 300 m
5. Pacific Decadal Oscillation (PDO)
https://www.columbia.edu/~jeh1/Data/ElNino-LaNina/
“Keeping the bastards Honest” (?)
I happily accept posting this is a waste of time overall beyond a slight peace of mind benefit.
June 12
An article in the Washington Post last week reported that “climate scientists” peg the odds as 27% that 2026 will be the record warmest year. Perhaps the author was unaware of our 30 April Substack post “2026 On Track for Warmest Year” or perhaps he does not consider us to be climate scientists worth acknowledging. In any case, this year provides a chance to learn something from contrary predictions. The Washington Post article refers to a projection of Zeke Hausfather on 2 June that there is a 26.6% chance of 2026 being the warmest year.
Zeke has provided enough information to allow a contrast with our approach.
Below we describe the basis for our prediction and our principal differences with Hausfather.
Based on this scientific evidence, we expect that when the horse race comes down the stretch, in November and December of this year, we will be riding a thoroughbred, a strong young horse, and Zeke will be atop a fading old nag. In any event, we will then be able to assess whether we have learned anything that helps young people define policies to create a bright future.
1)
As we described in our recent papers,[5],[6] the most important result is that climate sensitivity is significantly higher than the long-standing best estimate of 3°C for 2×CO2, a conclusion we can state with greater than 99% certainty.
2) The albedo reduction is so large that most of it must be due to a reduction of sunlight reflected by clouds, as the contributions from reduced sea ice cover and reduced human-made atmospheric aerosols are relatively small.[6] This implies that cloud changes are a strong, amplifying, climate feedback. If cloud changes were neutral (no net warming or cooling effect), climate sensitivity would be about 2.4°C for doubled carbon dioxide because water vapor and sea ice feedbacks roughly double the no-feedback climate sensitivity of 1.2°C.
3) The fact that only a 6 percent solar irradiance change is needed to cause snowball Earth implies that climate sensitivity is high, about 4-5°C for doubled carbon dioxide, and Earth system sensitivity (including ice sheet changes neglected in Charney’s sensitivity) is even higher.[14]
4) Sulfates produced by SO2 emissions are the principal anthropogenic aerosol, but it is unlikely that global aerosol climate forcing is proportional to SO2 emissions. Aerosol scientists describe the great uncertainty in the aerosol forcing in IPCC reports. The largest uncertainty is in the effect of aerosols on cloud formation and cloud properties.
and
Independently, we show that, among the three aerosol coolings (0, 0.5, 1 W/m2), the intermediate case (implying climate sensitivity 4.5°C for 2×CO2) provides the best representation of total temperature change for 1880-present.[6]
Then — A strong El Nino is about to begin. We have shown in prior posts that the heat anomaly in the upper 300 m of the equatorial Pacific provides an El Nino diagnostic with more favorable characteristics than the common Nino3.4 SST (sea surface temperature) index. The 300 m heat provides an earlier indication of an upcoming change of tropical climate and it is less affected by human-made global warming.
For the purpose of predicting temperature in the remainder of 2026, we note in Fig. 8 that global SST in 2026 has approximately “caught” the 2024 global SST in May (upper figure) and 2026 continues to be at least 0.1°C warmer than in 2023 (the last El Nino onset year). We expect that gap to be maintained, as the upcoming El Nino is at least as strong as the one in 2023. We note also that Earth’s energy imbalance for the last 15 months of data (January 2025 through March 2026) is 1.58 W/m2, even higher than the prior decade (Fig. 4). The year 2026 should already exceed the 2024 record, with higher temperatures to come in 2027.
and
Summary: the media are gobbling up and regurgitating an interpretation of global climate change that we believe is fundamentally flawed.
We have presented extensive independent evidence that climate sensitivity is 4-5°C for doubled CO2. The implications of our interpretation are great.
A secondary issue is the climate forcing caused by decreasing emissions from ships. We have presented evidence that ships are responsible for an increase of at least a few tenths of 1 W/m2 in the past decade. At least in this case, we can make a quantitative comparison with the IPCC estimate as Forster and Hausfather calculate 0.079 W/m2.[20] Observational data, in combination with improving aerosol-cloud modeling, should be able to resolve this difference. We believe that the larger effect that we estimate for ship aerosols is at least partially responsible for the sharp uptick in Earth’s energy imbalance and temperature shown in Figs. 4, 6 and 7.
[ ie. secondary issue, partially responsible, and NOT BLAMED FOR …. as incorrectly framed by Trenberth then concluding ]
It is hard to resolve the differences of opinion on the more important issue of climate sensitivity and global warming on the century timescale because the IPCC modeling approach and how it is used by Hausfather and others for their climate projections is foggy, i.e., not well defined. It seems to be based on the fog of model results produced by all climate models.
However, the projections produced are continually changing; such is the case for 2026 global temperature. How are these determined? If we are to gain knowledge from real-world climate “experiments,” such as that occurring this year, we need to understand the basis for the predictions.
https://jimehansen.substack.com/p/yes-2026-is-on-track-to-be-the-hottest
Therefore, Trenberth’s critique is a simplification. Hansen frames the 2023-24 temperature anomaly and the prediction for 2027 as the result of a synergistic effect: an El Niño event releasing heat, amplified by the recent global reduction in aerosol cooling (especially from shipping), the overall amplification of cloud feedbacks with all operating under a higher-than-expected climate sensitivity.
Hansen notes that changes in clouds act as a powerful amplifying feedback. The reduction in global aerosols not only removes direct cooling but also alters cloud properties. Increased background global warming too alters cloud properties. Resulting in a substantial darkening of the planet (reduced albedo) since 2015 simultaneously being amplified by the higher ECS above that accepted by the IPCC. .
The projection for a record +1.7°C in 2027 is based on this integrated framework, not aerosols nor IMO reductions alone.
The ‘Acid Test’ was Hansen’s expectation that temperatures would not fall much below +1.5°C following the 2023-24 El Niño . It was a deliberate ‘acid test’ of his theory now shown to be accurate. This prediction hinged on the persistent warming from both the loss of aerosol cooling and high climate sensitivity, amplified by cloud feedbacks, which he argued would prevent the typical post-El Niño cooling, coupled with the underlying growth of warming from total global emissions and ongoing land use changes.
Kevin Trenberth’s statement that Hansen “and others have blamed this on changes in aerosols” misrepresents Hansen’s position. In both his public communications and peer-reviewed work, Hansen presents global reductions in aerosols, the more recent IMO shipping changes, as only one critical aspect of a multi-factor explanation for recent warming, for the post 2010/2015 rapid acceleration and the looming super-el nino with predicted record 2026 and 2027 global temperatures and not the sole cause.
A lot of text above, sorry, but I wanted to empathize this particular section as well.
Hansen
2) The albedo reduction is so large that most of it must be due to a reduction of sunlight reflected by clouds, as the contributions from reduced sea ice cover and reduced human-made atmospheric aerosols are relatively small.[6] This implies that cloud changes are a strong, amplifying, climate feedback.
Whereas Trenberth, courtesy of Mal Adapted above says :
Kevin Trenberth – “The wider expanse of subsiding air into the subtropics increases sunshine and heating and is a positive feedback. Hansen and others have blamed this on changes in aerosols, but it is much more from changes in clouds and circulation.”
Hansen adds:
4) Sulfates produced by SO2 emissions are the principal anthropogenic aerosol, but it is unlikely that global aerosol climate forcing is proportional to SO2 emissions. Aerosol scientists describe the great uncertainty in the aerosol forcing in IPCC reports. The largest uncertainty is in the effect of aerosols on cloud formation and cloud properties.
That analysis has nothing at all to do with the recent IMO emissions reductions of SO2 emissions. Hansen has always been addressing the larger picture and the total lack of credible data supporting the modelling communities unfounded unproven assumptions of global aerosol forcing, cloud albedo forcing and the additional amplifying climate feedbacks.
I seriously question how well informed Trenberth and Hausfather are about the research analysis by Hansen’s team and the many other independent climate scientists.
Furthermore, in Trenberth’s reply to a commenter he offers a media article reference authored by himself dated July 2023. At the beginning of the rapid warming period 2023-2024-2025 when he and everyone else barely knew anything about it or how bad it would become. Let alone the coming El Nino responses or how much higher the long term warming rate had accelerated by 2025 — overriding prior assumed “step changes”..
source https://www.theclimatebrink.com/p/the-strongest-el-nino-ever/comment/293971896
Which for me, begs the question–has Trenberth learned anything new about El Ninos, the rapid spike in warming acceleration or what may have caused the massive unexpected Bananas of 2023-2024 El Nino period since his article of July 2023?
Hansen stating shipping emission changes is partially responsible does not suddenly make them totally responsible nor blamed for all recent warming acceleration or higher anomalies. And it is not what his papers contain either.
Reading Hansen’s output accurately, understanding it fully, and the peer-reviewed papers and recent articles by others since then, might help Trenberth update his knowledge? Hausfather and others too. Reader’s are advised to recognize the difference between fading reputations and quality science.
Hansen is not acting alone. There is a small army supporting his scientific work and funding it.
Apologies for any scientific semantic errors in my phrasing above, I completely defer to Hansen and his team for accuracy. Excuse the length, my small effort at trying to correct a small part of the ongoing disinformation on this topic which I find frustrating. .
KM: I happily accept posting this is a waste of time overall beyond a slight peace of mind benefit.
MS: It was useful for me. Thank you.
KM, a lot of interesting points, but I fail to find your references, fx. [6] etc. Where are they?
I think the strength of your approach is that you try to use the paleoclimatic data as calibration for climate models. On the other hand, as I often has pointed out here: the fundamental problem is that *we don’t find any example in our whole knowledge-base of global paleoclimate development of any rise in global tropospheric CO2, CH4 etc. content happening anywhere nearly as fast as that which has been going on – and even accelerating – in the last about 50 years. Not even close!
The main problem here is of course, that it’s only for the last around 200000 years or so (maybe more, maybe less? At least the last ice age) that we are able to rather precisely discern changes in CO2 etc. in such short timespans as a human lifetime, due to compressed airbubbles in the year-layered glacier ice in Greenland and Antarctica. Anyway we can probably conclude from what we know about the possible natural sources of CO2 etc. emissions in our modern and newer world, that it’s very unlikely that such extremely fast emissions as the industrial burning of fossil fuels in the last 50-100 years could ever have happened before, but we can’t be absolutely sure when we are tens or hundreds of millions of years back in time – the further back, the less sure we can be of course. What do we know for sure about exploding volcanoes, incoming meteorites etc. and their effects in the eocene, the cretaceous, the jurassic or even the permian, in such short timespans?
Anyway, we can only act based upon what we know. And as far as we know, there aren’t any periods in pre-industrial times with greenhouse gas emissions happening nearly as fast as in the last 100 years.
But how can we then be sure, that this shock of ours to the climate system won’t produce effects never seen before in paleoclimatic times? Of course we can’t. Here I think all the modelling discussions are overconfident, bording on hubris. I find it simply ridiculous to see predictions of sealevel rise in fifty years given in numbers down to one centimeter – plus/minus tens of centimeters. Anyone with the slightest knowledge of deglaciation processes since the last glacial maximum knows that this is nonsense, so why on Earth is this being done by the IPCC? Is it because someone want to give us all the impression of a certainty in our knowledge that doesn’t exist? To tell us to calm down? Why? Not very wise, history ought to tell us that much.
I think this is in many ways a result of the lingering “optimism of the will” from the early industrial age (unconsciously stemming from the by then, far before the scientific results of modern geology as condensed by Jeffrey S. Dukes in his paper “Burning buried sunshine. Human consumption of ancient solar energy”, (2003), were known, *seemingly* magical power of fossil fuels, which mankind since believed to be solely it’s own “productive force”.. In “Capital” Marx cites from Shakespeare a rich man travelling with six horses: “I feel as had I twentyfour legs”) – and a result of Bacon’s four idols https://sirbacon.org/4-idols/ –
All this has now been “developed” ad absurdum in the age of Hitler, Stalin, Trump, Putin, Musk, artificial “intelligence” (!) etc. … as discussed extensively by among others Pannekoek, Wittgenstein, Adorno, Bohr, Popper, Peter W. Zapffe, Arne Naess, McLuhan, Guenther Anders (“The Outdatedness of Human Beings” !! For Anders, the modern consumer has become ashamed of his own products. Never has this been more visible than with A”I”…), Jean Baudrillard (“This is not to say that the world becomes unreal, but rather that the faster and more comprehensively societies begin to bring reality together into one supposedly coherent picture, the more insecure and unstable it looks and the more fearful societies become” https://en.wikipedia.org/wiki/Jean_Baudrillard – Baudrillard critizises a worldview – the postmodern “hyperreality” – where our models tend to exterminate the reality. I think Baudrillard underestimated the degree to which mankind is bound to become awakened by the reality, sooner or later, but his main observations are very relevant. He writes that the postmodern consumer is “freely” ordered “to say yes to yes”, to be hyperpositive, Trump is a very clear example: everything he says is coming from a kind of totally unconscious and totally flat or even one-dimensional “landscape” of ever the same stupid commercial exaggerations, he speaks as if he has no sense whatsoever of any difference between his words/mind and the world outside his ego. The political tragedy of impotence and cowardy today is that no politician really seems to have the courage to be the little child in Andersen’s tale of the naked emperor. Maybe it has been made impossible by the media for any politician to take that role. This is the *spontaneous consumerist totalitarianism* represented by all politicians – the force behind all climate denialism, especially the “greenwashed”/”lukewarming” types, the most effective and “political” ones! Hidden in plain sight) etc.
KM, a lot of interesting points, but I fail to find your references, fx. [6] etc. Where are they?
You need to go to Hansen article via the link provided.
RE the strength of your approach is that you try to use the paleoclimatic data as calibration for climate models.
Not me, Hansen and others are doing the work, not me. You can address these question to Jim on his substack, he does reply at times,
Or dig into his papers articles then run the queries past a decent Ai APP – it might help.
You could them to compare x paper with y paper in a specific subject issue – or dump your whole comment into one.
these AI systems won’t be around for long KVJ , or be free for the advanced options, so take advantage while they’re there and you can still get the info you need. .
how to build a self-sufficient homestead is a good prompt … start with a tippi or yurt ?
What is unusual is that El Nino events tend to slightly bias wetter summers in the UK, but so far, summer 2026 has been very dry. Here in SE England, we have not had a drop of rain for the whole of July to-date, and 1 mm since the 22nd June. There is very little rain forecast through to the end of this month, it has been closer to a Mediterranean summer than a NW European one here.
I appreciate what James Hansen continues to contribute to the global warming dialogue. The IPCC seems to always err on the conservative side (understandably given its makeup and need for consensus). Hansen’s “voice in the wilderness” is a well-explained and thought-stimulating counterpoint. He deserves more recognition.
I don’t think comparing Hansen to the IPCC is fair. The IPCC is inherently a consensus effort–it cannot be more extreme than the most conservative elements it requires to agree. Hansen is performing a valuable counterpoint–more of an engineering judgment 80% WC. Both are needed, but what is needed even more is a public and an electorate that is educated enough to understand the critical role of both.
A Nuanced Rebuttal: The IPCC is a Process, Not the Arbiter of Scientific Truth
S.B. Ripman & Ray Ladbury,
With respect, I believe you have, like most people, bought into a “narrative” as if it were both scientifically and logically unassailable. The framing of Hansen versus the IPCC as a battle between an “extremist” and a “conservative” consensus fundamentally misses the core epistemological crisis at play.
As the great physicist Richard Feynman warned:
“It is a great deal easier to say that the other guy is wrong… than to find out what the real answer is. The first principle is that you must not fool yourself—and you are the easiest person to fool.”
Applying Feynman’s axiom to this debate reveals several critical logical fallacies in the standard defense of the IPCC:
The “Extreme” Fallacy: A non-conservative conclusion published in peer-reviewed literature does not, of itself, make that scientific conclusion “extreme” simply because it differs from a pre-existing baseline. Labeling scientific output as “extreme” is a subjective human judgment, not a scientifically derived metric. In physics, the truth is often non-intuitive; it is never determined by a vote.
The Bias of “Conservatism”: Always “erring on the conservative side” is not a scientific virtue; it is a systemic bias. Who decided scientifically that “conservatism” is more valid than the aggregate of the entire accumulated scientific output? Basic scientific principles—rooted in the philosophy of science—teach us that we must actively avoid subjective bias at all steps of the process. Injecting deliberate conservatism into a physical model is a policy choice, not a scientific one.
The Exclusionary “Consensus”: What is fundamentally unfair—and profoundly unscientific—is framing Hansen’s work and the many whose work supports his astute analysis and physics theories as unacceptable because it does not fit the subjective conclusions of a small cohort of public facing activist scientists who benefit reputationally and professionally from the IPCC and CMIP modelling process.
The Illusion of a Vote: This brings me to the fatal flaw in your characterization: you refer to the IPCC as a “consensus.” However, that is a misnomer. A true consensus requires a vote from the entire body of relevant scientists. Instead, we have a curated process where a small cohort of scientists subjectively decides that Hansen’s output—and the research of many others whose conclusions mirror his team’s—is summarily dismissed from consideration.
The IPCC is not a God; it is a habitual process on railroad tracks, repeating the same assumptions despite the outputs of CMIP6 and flawed theories regarding Net Zero. The science that gets excluded on an individual IPCC scientist’s whim is not genuinely included in an across-the-board consensus because scientists like Hansen never actually get a vote. Modelling is a Map; not the Reality.
The above are the core issues that should be addressed but are not. Instead, the narratives presented by the “IPCC Bandwagon” are accepted typically like here without thought, assumed to be scientifically based, when they are patently the result of subjective, biased human filtering. The question is not whether Hansen is right or the IPCC is conservative and therefore must be “more right”; the question is whether we are fooling ourselves about the integrity of the process itself.
What you were discussing without naming it was not the science or the scientific process, nor about any genuine consensus outcome by all concerned—but how people go about providing biased subjective opinions and judgments about things their institutional reputation and careers depend on—and then how it’s weaponized through public-facing rhetoric.
Do you think I am wrong about this? If so, how have I erred against the basic philosophy of science and it’s long held best practices?
Maru: As the great physicist Richard Feynman warned: “The first principle is that you must not fool yourself—and you are the easiest person to fool.”
Your lecturing others and attempt to bask in the authority of Richard Feynman, would have been more convincing, if you applied it yourself too. Otherwise it is “ do as I tell you, not as I do“.
I’ll pass. I’ve been advised not to engage with trolling comments. Besides my rule to never dialogue with someone who is committed to misunderstanding me and lacks basic respect for others.
A consensus does not require a vote–if it did, then there would be no scientific consensus. Indeed, scientific consensus represents a distinctly different kind of consensus than that of democratic consensus.
Science is NOT democratic. As Luis Alvarez said: Luis Alvarez famously stated: “There is no democracy in physics. We can’t say that some second-rate guy has as much right to opinion as Fermi”. This merely illustrates that there are some practitioners in every field of science who possess such deep insight that they tend to carry the day, even if some in the community privately favor a slightly different conclusion.
The type of consensus in the IPCC is neither democratic nor scientific. It represents the fact that unless its conclusions are above reproach, it will be attacked mercilessly. It is a policy-making consensus, driven by the need for very broad agreement–and that always produces a conservative viewpoint. (See for example the debate around the linear/zero-threshold debate in radiation safety).
RL: Your playing semantics about the meaning of the word “vote” and are running a political argument based on a narrative you believe in. Like others do.
Obviously climate scientists at the IPCCC do not run referendums and cast ballots on each Paper that is accepted, or what “theories/principles” are acceptable or not.
But they do have meetings, they do have different degrees of institutional power within the organization and among themselves. There is a hierarchy. Judgments are made, weighted and decided, be that within a small group, among a large group interacting or a single approved Author or a Coordinating Lead Author.
The word Vote was used metaphorically and that fact should be respected if you wish to interact. The meaning should have been clear to anyone up on the topic of how these judgments and decisions are made within the IPCC. Which you claim to be.
At some point Hansen’s work is rejected by a collective judgment where everyone authorized gets a sat, a right to Vote and have a say.
It does not ocurr from happenstance by a group of angles are dancing on a pin. People make decisions. Supposedly by agreement but also through seniority — inside a Black Box little different than a behind the curtain in Polling Booth,
People make real decisions, essentially they make a personal Vote on whether that science work and idea is acceptable or not — for a Consensus to be arrived at. One Scientist at a time.
However, believe whatever you wish. I am not going to argue about what you appear do not even want to understand. But if my explanation is helpful, maybe try again?
KM, regarding your responses to Ray Ladbury. So what? The IPCC hierarchical decision making process is conventional and typical of various organizations. If they had a vote on everything it would take forever with no guarantee you would get a more accurate outcome and a fair chance you would get a less accurate outcome. Being a critic is easy. Youre not articulating a convincing better alternative.
As many people have pointed out the difference between Hansens views and his opponents isnt that huge anyway. It may not be possible to fully resolve the differences. Because you cant put the planet in a lab and do a controlled experiment. We are all frustrated with the situation, but we have to be a bit accepting and philosophical about the situation. Regardless of who’s right the the warming situation is a bad environmental situation.
KM,
The scientific consensus is not any kind of vote or discussion. It is a consensus of EVIDENCE. When several lines of evidence all point to a specific conclusion, THAT is a scientific consensus. So your whole long post about the IPCC is irrelevant.
Barton Paul Levenson says
The scientific consensus is not any kind of vote or discussion. It is a consensus of EVIDENCE. When several lines of evidence all point to a specific conclusion, THAT is a scientific consensus. So your whole long post about the IPCC is irrelevant.
So you’re happy to just outright lie about the process? Or are you truly this naive and ignorant of the other side of the IPCC?
Allow me to show you how illogical (and ludicrous) your comment is. The evidence does not choose itself.
People arrive at judgments about the scientific output, about the science principles at work, about the data and what it means. The scientists discuss it at the IPCC and other fora — discuss it among people.
So why is that you saying the IPCC Consensus is not a discussion and doesn’t involve people making Judgments on the science output, on the Evidence? Those same people decide to “cast a ballot” (in their own mind) and they discuss it among themselves.
Eventually hey must arrive at a collective judgment one way or another. Is this good enough to include in this assessment? Yes or No. Which mirrors the basic function of a Vote.
It is a Vote — they simply don’t paper ballots or voting machines as part of this internal process of decision making. So, try to stop playing semantic games and hiding behind them. People make choices. Each person in the IPCC system who plays such a role chooses what is in or out. They argue about that. They arrive at a final “pseudo-consensus” where a hierarchy of preponderance makes final decisions.
That evidence in the research doesn’t do that. People do that. The people who are excluded from that system play no role. You and me. James Hansen and his team, do not get a say, do not get to argue their case, do not get a Vote at all.
Their opinion and judgments do not COUNT in this very selective isolated Black Box Voting Process.
Now, next comes where you again reply and you pretend you don’t understand what I was just stating about the practical reality of the IPCCC Consensus and how such a NON-Scientific-Consensus is arrived at.
By exclusion, and human selectivity, and who wields the greatest influence on others within the hierarchy black box system called IPCC Assessment Authors and Lead Authors. It has become not about the “veracity of the research” it’s has become who can argue more forcefully, and who has the institutional power to override others or browbeat them if necessary until they submit to “authority.”
Go read the 3 decades commentary of the whistle-blowers and complainants of this mislabeled “scientific process”. It’s not science it’s politics where no one gets an equal Vote, but “a Vote” is taken anyway.
iow dear fellow, there actually is no such a thing as a IPCC Consensus. It’s a myth and political tool to silence others in the public domain. A consensus to protect the consensus – or rather those who arrived at it. Oddly, it avoids all scrutiny, and exposure..
So far it has worked well, despite over 3 decades of pushback and minor exposures (rapidly shut down) by highly qualified climate scientists and physicists and statistical mathematicians, the mythology and flaws have persisted.
And here you are now defending this long term “manipulation” of the public by the “dysfunctional system.” You must be proud as a “scientist” doing that. So, well done, good job. We’ll put that on your gravestone as an epitaph. I can to emotive hyperbole content too.
Please don’t ever read the output of James Hansen and his team the cognitive dissonance will be crushing. :0)
James Hansen too presents a Consensus! You and a few others here simply choose to ignore it then dismiss it out of hand without ever understanding it. . You guys prefer Trolling instead.
If you ever do read Hansen’s output—really read it—you’ll find a consensus of evidence there too. The difference is, his consensus is built on physics, not on institutional gatekeeping. The fact that you dismiss it without engagement says everything about what kind of consensus you’re actually defending, and it’s not a scientific one.
KM: So you’re happy to just outright lie about the process?
BPL: So you’re happy you committed a string of murders?
Kobayashi Maru–or multi-troll or whoever. I have been doing science for over 40 years, So, actually, I do know what sorts of discussions and consensus building occur in different scientific forums. Voting does occur in some scientific venues–for example if a governing body is adopting a new standard. But that is not scientific consensus, as such.
Then there are the discussions, where, for example, panels of experts decide what is to be discussed in a text book or a report. The IPCC is closer to this–except that the panel of experts is much broader, and the pressure is to keep as many “critical representatives” as possible on board with the consensus. It is fine to criticize the result. However, there are no consensus documents out there that deviate significantly from the IPCC conclusions. These include statements by over 100 professional and honor societies of scientists–from the American Physical Society to the National Academy of Sciences to the Royal Society… Ultimately, the strength of these position papers and reports is that they represent broad consensus, making it harder to pit one set of experts against the others. The cost of that agreement is that the conclusions will not be as strong as the more strident members want.
Don’t like the result–persuade people you are right…because that is the type of document these are.
James Hansen’s output does not represent a consensus. It is original scientific work. It may be reflected in the consensus, but it is NOT any sort of consensus.
And then there is the question of scientific consensus. Scientific consensus is driven by the evidence. The evidence dictates what we can say is known and to what degree. It is a political process. That is inevitable when dealing with humans–it is human knowledge we are dealing with after all. So, some individuals with especially deep insight into the evidence may have outsized influence on the final product. The scientific consensus represents the most reliable summary of the state of our knowledge of a subject.
Unless you have actively participated in these processes, I rather doubt you have the insight to tell professional scientists what to think.
in Re to “Kobayashi Maru”, 24 Jul 2026 at 9:14 PM,
https://www.realclimate.org/index.php/archives/2026/07/this-new-el-nino-is-different/#comment-850013
Dear Sir or Madam,
I think that the novel Arrowsmith
https://en.wikipedia.org/wiki/Arrowsmith_(novel)
can be understood as a warning that people can very easily overestimate their results and/or ideas in view of perceived societal importance thereof.
I think that perceiving a discovery or another new idea as a potential salvation for mankind may act as a powerful impulse to become rather an advocate for a quick practical exploitation or implementation of that discovery or idea than to continue with its further and deeper critical exploration until the scope of its validity and/or the effects of its practical implementation become clear. It is a temptation that may be hard to resist.
For this reason, taking recommendations from “public facing activist scientists” with a caution may not be a bad idea. I am, however, afraid that Dr. James Hansen falls exactly into this “activist scientist” category.
Best regards
Tomáš
TK — Being a Pulitzer Prize winning author I’m sure Lewis must have been talented. I fail to recognize the relevance tgo the issues I was raising about Hansen and how the consensus is framed and generally accepted. Maybe there is a specific point you think is important?
Dr. James Hansen and his teams’ output can be read, reviewed and tested and analyzed. Their conclusions can be compared to others. He does not argue a consensus nor a seek a vote on his work, he argues for the physics and the data and his analysis. Public Criticisms of that by people who clearly — through their own words — do not understand the material and or have not in fact read it carefully, is not credible, nor a valid scientific criticism or argument against it.
Until they can honestly and fully address the actual science arguments the team are making then their hasty opinions are worthless. Surely?
It appears you have come in late and missed the critical points about the errors I addressed in the very beginning. James Hansen is nor running a popularity contest. If you are unaware of this, may I humbly direct you read what he has written and said in lectures and podcasts the last decade and more.
Otherwise you’re as guilty of misrepresentation (or worse) as Hausfather and Trenberth and now Nigel Jones are given your concluding comments. I suggest you revaluate your knowledge and thinking.
KM: “Public Criticisms of that by people who clearly — through their own words — do not understand the material and or have not in fact read it carefully, is not credible, nor a valid scientific criticism or argument against it.”
Who exactly has said they do not understand what Hansens material says, and have said they didnt read it carefully. Provide names, dates, sources and quotes of exactly what they said. Assertions made without evidence can be dismissed without evidence. Hitchens razor.
Even if you dig up a couple of people, maybe they dont understand his work because it doesnt make sense. Who knows.
Hansen has many critics. Show us in precise detail where their criticisms are wrong. Everything else is just mud slinging.
I quite like Hansens form of reasoning about the climate issues, but hes retracted or modified some of his earlier claims on sea level rise so hes made mistakes. So some scepticism of his current views is healthy.
KM: Dr. James Hansen and his teams’ output can be read, reviewed and tested and analyzed. Their conclusions can be compared to others. He does not argue a consensus nor a seek a vote on his work
BPL: Neither does anybody else. BTW, Hansen does support the scientific consensus on global warming and has argued for it. Again, your understanding of “scientific consensus” is flawed.
in Re to “Kobayashi Maru”, 27 Jul 2026 at 2:06 AM,
https://www.realclimate.org/index.php/archives/2026/07/this-new-el-nino-is-different/#comment-850079
Dear Sir or Madam,
I can be, of course, wrong, however, the parallel I see between Dr. Hansen and Martin Arrowsmith is the desperate feeling of utmost urgency of an action that ultimately compromises their scientific output.
Less could be sometimes more. Let us imagine that the goal of IPCC were a consensus about uncertainties and limitations of the present knowledge in climate science and its output were restricted to recommendations for further research, with the aim to fill the recognised gaps. This approach could perhaps look less ambitious on the first sight, but I think that it might be in fact more productive and helpful than their policy recommendations.
I think that especially with respect to policy recommendations, Dr. Hansen’s criticism of IPCC is often justified. Nevertheless, I am afraid that his own activities in this direction, like his advocacy for nuclear energy exploitation, may deserve a comparably harsh criticism.
Greetings
Tomáš
KM: “The Exclusionary “Consensus”: What is fundamentally unfair—and profoundly unscientific—is framing Hansen’s work and the many whose work supports his astute analysis and physics theories as unacceptable because it does not fit the subjective conclusions of a small cohort of public facing activist scientists who benefit reputationally and professionally from the IPCC and CMIP modelling process.”
The same accusations could be made that Hansen benefits professionally and reputationally from his own climate modelling that concludes climate sensitivity and SLR must be higher than the more conservative leaning scientists like Mann or Hausfather. Hansen might gain a certain cult following from people and a certain respect and notoriety he might relish.
So KMs comments are vacuous and his comments are also lacking in hard evidence that anyone has gained professional advancement presumably meaning pay rises or promotions.
Personally I doubt anyone is holding their views to seek or get a reputational or professional advantage and instead Hansen and his critics just disagree about things. Its the simplest explanation so anything like what KM proposes needs detailed proof. And there is none.
Subjective opinions and assertions someone’s comments are “vacuous” does not make it so.
I think it is a mistake to view the work of Hansen as antagonistic to the output of the IPCC. They are different beasts. The IPCC is NOT original science. It is a consensus document that allows conclusions to be stretched only to the point where one is just short of losing a critical constituent/constituency. Hansen’s work serves as a caveat–illustrating just how bad things could get if the uncertainties didn’t align perfectly. And it really doesn’t matter, as the policy makers are unwilling to accept even the watered-down version of climate science found in the IPCC summaries. THAT is where the breakdown is occurring, not with the good-faith efforts of the scientists working seriously on the problem.
RL – I think it is a mistake to view the work of Hansen as antagonistic to the output of the IPCC.
This must be from someone who has read Hansen’s commentary about his work compared to the IPCC. Hansen is clearly antagonistic about the IPCC the CMIP and their failures to address the the evidence, the known data, the actual physics, and the science correctly.
This is beyond obvious even by a casual reader who doesn’t comprehend the detailed physics involved. He is criticizing the IPCC in almost every article he presents for several years.
And WHY would Policy Makers act on the watered-down version of climate science found in the IPCC summaries?. When not acting would be the most rational thing to do, if it isn’t so bad after all. THat is a ludicrous illogical defense of the IPCC – and in fact supports Hansen’s criticisms to the Hilt – which permeates all his work — the IPCC the scientists in it are NOT telling the truth about climate change and how dangerously out of control the impacts already are
From their substack: https://jimehansen.substack.com/
One example, extracts: Warning! This “Colorful Chart” is Censored by IPCC
How effective is IPCC? Is IPCC expected to be a source of scientific advice for the United Nations? If so, how is it that the Secretary General continues to assert that it is still feasible to keep global warming from exceeding the 1.5°C limit?
Does IPCC operate under the rules of science? Our paper – because of its strong conclusions – faced and passed extensive peer-review. IPCC seems to believe that it has been granted special powers and does not need to follow the scientific method.
Does IPCC explain the core issues in a transparent fashion, understandable to policymakers? However, IPCC’s method for projecting future GHG forcing – “integrated assessment models (IAMs)” that produce the RCP scenarios – are dark boxes. We must, and will, produce more transparent projections that are more clearly related to feasible policy choices.
https://jimehansen.substack.com/p/warning-this-colorful-chart-is-censored
2nd example: Runaway Climate: The Point of No Return
It was my own fault, a self-inflicted error, which I did not recognize until I began to question conclusions of the Intergovernmental Panel on Climate Change (IPCC), specifically IPCC’s downplaying of the threat of sea level rise and shutdown of the overturning ocean circulation.
The danger of passing the point of no return is taboo with the United Nations Intergovernmental Panel on Climate Change (IPCC), the organization that we should expect to be most protective of the future of young people. This reticence of IPCC is a cause for concern, which deserves to be pointed out and vigorously debated. IPCC relies on models with millennial response times, even when driven by forcings that dwarf any experienced in Earth’s history.
The climate system’s delayed response provides time to take preventive actions, if the science is understood well enough to define effective policy actions.
https://jimehansen.substack.com/p/runaway-climate-the-point-of-no-return
3rd example July 23 – Beware Media Hype. It’s Not the El Nino!
James Hansen, Pushker Kharecha, Dylan Morgan and Jasen Vest
Beware the “surprise” record high being blamed on an extreme El Nino on top of global warming otherwise consistent with IPCC estimates. Instead, record warmth provides additional evidence of high climate sensitivity and increased net climate forcing in the past decade.
That result was almost foreordained by the IPCC approach to climate analysis, which places overwhelming emphasis on GCM (global climate model) simulations and interpretation of climate change in the past two centuries. IPCC reports implicitly involve GCM beauty contests, in which model simulations are compared with observed global temperature in the past 1-2 centuries.
Unfortunately, there was a fly in the ointment. IPCC’s overwhelming focus on GCMs and global warming of the past century resulted in one dominant constraint on the models: the need to obtain global warming of about the observed magnitude. However, there were two uncertain parameters: climate sensitivity and the unmeasured aerosol forcing.
several independent evaluations supporting climate sensitivity in the range 4-5°C for doubled CO2.[13] With such high climate sensitivity, the observed post-1970 warming rate implies the existence of a negative forcing stronger than assumed by IPCC et al.
https://jimehansen.substack.com/p/beware-media-hype-its-not-the-el
Conclusion: I think people who are now aware of the details, or who never read Hansen’s material, should be commenting about these matters until they have. Even then there’s no guarantee they have handle on what the issues are he raises and why. Or the ongoing ad hominem push back he and his team keep receiving from well known established climate scientists in the public domain who don’t know what he say either. Like Trenberth and Hausfather clearly do not by what they write.
KM, my comments are not subjective opinions. They are facts, as follows. Your assertions that Hansens critics gain professional and reputational advantage from IPCC climate modelling and the middle range projections, are evidence free and thus empty of value. Simply put they are mud slinging.
And I simply pointed out the fact that its possible to make the same assertions about Hanson. Whether he does or not doesnt interest me, that much. I look at the quality of scientific argument. You sling mud.
[ I’m unsure if my prior comment was processed correctly, the website locked up – apologies if this is a dbl up ]
RayL – I think it is a mistake to view the work of Hansen as antagonistic to the output of the IPCC.
This must be from someone who has NOT read Hansen’s commentary about his work compared to the IPCC. Hansen is clearly antagonistic about the IPCC the CMIP and what he considers their failures to address the evidence [ ie the published research papers and the Data] objectively, the known data, the actual physics, and the science correctly.
This is surely already beyond obvious even by a casual reader who doesn’t comprehend the detailed physics involved. He is criticizing the IPCC in almost every article he presents for several years.
And WHY would Policy Makers act on the watered-down version of climate science found in the IPCC summaries?. When not acting would be the most rational thing to do, if it isn’t so bad after all. THat is a ludicrous illogical defense of the IPCC – and in fact supports Hansen’s criticisms to the Hilt – which permeates all his work — the IPCC the scientists in it are NOT telling the truth about climate change and how dangerously out of control the impacts already are
From their substack: https://jimehansen.substack.com/
One example, extracts: Warning! This “Colorful Chart” is Censored by IPCC
How effective is IPCC? Is IPCC expected to be a source of scientific advice for the United Nations? If so, how is it that the Secretary General continues to assert that it is still feasible to keep global warming from exceeding the 1.5°C limit?
Does IPCC operate under the rules of science? Our paper – because of its strong conclusions – faced and passed extensive peer-review. IPCC seems to believe that it has been granted special powers and does not need to follow the scientific method.
Does IPCC explain the core issues in a transparent fashion, understandable to policymakers? However, IPCC’s method for projecting future GHG forcing – “integrated assessment models (IAMs)” that produce the RCP scenarios – are dark boxes. We must, and will, produce more transparent projections that are more clearly related to feasible policy choices.
https://jimehansen.substack.com/p/warning-this-colorful-chart-is-censored
2nd example: Runaway Climate: The Point of No Return
It was my own fault, a self-inflicted error, which I did not recognize until I began to question conclusions of the Intergovernmental Panel on Climate Change (IPCC), specifically IPCC’s downplaying of the threat of sea level rise and shutdown of the overturning ocean circulation.
The danger of passing the point of no return is taboo with the United Nations Intergovernmental Panel on Climate Change (IPCC), the organization that we should expect to be most protective of the future of young people. This reticence of IPCC is a cause for concern, which deserves to be pointed out and vigorously debated. IPCC relies on models with millennial response times, even when driven by forcings that dwarf any experienced in Earth’s history.
The climate system’s delayed response provides time to take preventive actions, if the science is understood well enough to define effective policy actions.
https://jimehansen.substack.com/p/runaway-climate-the-point-of-no-return
3rd example July 23 – Beware Media Hype. It’s Not the El Nino!
James Hansen, Pushker Kharecha, Dylan Morgan and Jasen Vest
Beware the “surprise” record high being blamed on an extreme El Nino on top of global warming otherwise consistent with IPCC estimates. Instead, record warmth provides additional evidence of high climate sensitivity and increased net climate forcing in the past decade.
That result was almost foreordained by the IPCC approach to climate analysis, which places overwhelming emphasis on GCM (global climate model) simulations and interpretation of climate change in the past two centuries. IPCC reports implicitly involve GCM beauty contests, in which model simulations are compared with observed global temperature in the past 1-2 centuries.
Unfortunately, there was a fly in the ointment. IPCC’s overwhelming focus on GCMs and global warming of the past century resulted in one dominant constraint on the models: the need to obtain global warming of about the observed magnitude. However, there were two uncertain parameters: climate sensitivity and the unmeasured aerosol forcing.
several independent evaluations supporting climate sensitivity in the range 4-5°C for doubled CO2.[13] With such high climate sensitivity, the observed post-1970 warming rate implies the existence of a negative forcing stronger than assumed by IPCC et al.
https://jimehansen.substack.com/p/beware-media-hype-its-not-the-el
Conclusion: I think people who are now aware of the details, or who never read Hansen’s material, should be commenting about these matters until they have. Even then there’s no guarantee they have handle on what the issues are he raises and why. Or the ongoing ad hominem push back he and his team keep receiving from well known established climate scientists in the public domain who don’t know what he say either. Like Trenberth and Hausfather clearly do not by what they write.
People will hold to their positions of course. I can’t see me adding anything more is worth the effort. Apply your best judgment.
Nigelj, again you provided no facts only subjective opinion. Which I dismiss out of hand. The #1 comment is irrational. You have not provided one useful accurate fact. The rest is arrogant trolling laden with subjective opinionated judgments absent any factual basis or usefulness. You are a six gun mudslinger. That’s my scientific opinion. An everyday emotional troll on the internet, and not a very good one at that. I’ve zero interest in your and others inflammatory nonsense.
So, you disagree. That’s no big deal, it’s nothing. Most people either shout or surrender. I do neither. If you think my information is wrong, do better. By all means launch a logical argument!
KM: “And WHY would Policy Makers act on the watered-down version of climate science found in the IPCC summaries?. When not acting would be the most rational thing to do, if it isn’t so bad after all. THat is a ludicrous illogical defense of the IPCC – and in fact supports Hansen’s criticisms to the Hilt – which permeates all his work — the IPCC the scientists in it are NOT telling the truth about climate change and how dangerously out of control the impacts already are”
The IPCC worst case for sea level rise is 2 metres per century while Hansens is 3 metres per century. Given that governments and many of the peoples arent hugely alarmed by 2 metres enough to take rapid action, its hard to see why that would change at 3 metres. Its the same story for other projections.
I would have thought 2 or 3 metres is deeply concerning and demands action and obviously you are the same but clearly not everyone is.
And while the IPPCs views are frustratingly conservative they are also grounded in solid science and widely backed. Hansens projections push the limits of what’s feasible and make a lot of assumptions. You need people like that but if the IPPC adopted his projections it would be way easier for the denialists to attack his views, and that would also erode motivation for more robust mitigation. You are not taking that sufficiently into account. Science is conservative for some good reasons.
Rather than worrying too much how bad climate change could get or the precise value of climate sensitivity it may be better to acknowledge they are all bad and encourage solutions, such as renewables on the wider benefits so not just climate related, but sustainability, low cost., a solution to peak oil etc, etc. The same would apply to degrowth solutions.
Perhaps the forest fires in Europe will be a wake up call. They are very present as opposed to theoretical projections.
KM: the IPCC the scientists in it are NOT telling the truth about climate change
BPL: Says who? You?
The imputation of deliberate lying on the part of the IPCC is itself a lie. Stop bearing false witness, KM.
BPL: “The imputation of deliberate lying on the part of the IPCC is itself a lie. Stop bearing false witness, KM.”
That presumes that Multi-troll is here in search of the truth and not for ego aggrandization – compensating that lack of achievements in its life by dumping on the IPCC scientists who have done something with their lives. The lower the object of its scorn, the higher Multi-troll appears in comparison.
The same desperate need to make their life meaningful as that of the anti-vaxers, HIV is not causing AIDS and/or can be cured by sex with a a virgin (or the blood of the albino), flat-earthers, 9-11 and the Moon-landing amateurs experts.
” … what is needed even more is a public and an electorate that is educated enough to understand the critical role of both.”
AGREED.
“It is a great deal easier to say that the other guy is wrong… than to find out what the real answer is. The first principle is that you must not fool yourself—and you are the easiest person to fool.”
AGREED.
” … the fatal flaw in your characterization: you refer to the IPCC as a “consensus.”
AGREED.
S.B. Ripman to a Doomer troll: : “AGREED”. “AGREED”. “AGREED.”
Emphatically agreeing with the points of a troll, who wrote to …. agree with you, is kind of circular, don’t you think?
Wouldn’t it be intellectually more productive if you instead addressed the reply to you by somebody who helds a different viewpoint than you (here: Ray Ladbury), to see whose argument holds better – Ray’s or yours/doomer troll’s ?
That of course assuming that you are a real person asking questions to get other people perspective and test your opinions against those of others, and NOT just another puppet of the doomer troll, created to provide illusion of a support for his doomer’s production on this website.
I guess, the proof will be in the pudding – in your future posts.
S.B. Ripman
Thanks.
Best option is to ignore the Piotr. He’s always like this. Biased subjective thoughtless and raging all over the place. The loudest voices in this thread are the ones most afraid of silence. Because silence is where real questions live — and questions are the only thing that threaten their narratives.
We have nothing to learn from people who already ‘know with certainty’ I’m wrong about everything an have to rage about it. They aren’t real scientists. They’re political activists.
KM: “The loudest voices in this thread are the ones most afraid of silence. ”
That would have to include KM himself, given the huge volume of words KM has posted on this thread. And hes posted huge volumes of words on other threads, and also going back years using different names. And many of them are inflammatory. So very loud by any definition. The irony is priceless.
– S.B. Ripman to the troll “Kobayashi Maru” : “AGREED”. “AGREED”. “AGREED.”
– Piotr: Emphatically agreeing with the points of a troll, who wrote to …. agree with you, is kind of circular, don’t you think? Wouldn’t it be intellectually more productive if you instead you replied to somebody who holds a different viewpoint than you (here: Ray Ladbury) ?
– Maru: to S.B. Ripman “ Thanks. Best option is to ignore the Piotr.”
Grooming another supporter, Mr. Maru?
KM: Best option is to ignore the Piotr. He’s always like this.
BPL: He doesn’t suffer fools gladly, that’s for sure.
Most people either shout or surrender. I do neither. If you think my information is wrong, do better. By all means launch a logical argument! But it is obvious you have nothing substantive to say here. Another only here for tribal trolling and inflammatory nonsense.
Well have at it. It’s nothing to do with me, so I’ll just ignore you instead. How easy is that?
BPL: He doesn’t suffer fools gladly, that’s for sure.
Thanks, Barton. So were the people I admire – anti-totalitarian intellectuals, like Bulgakov or Polish poet, Zbigniew Herbert; or the fierce, unyielding intellects like Hitchens (toutes proportions gardées …).
And while I enjoying letting hot air out of the overinflated egos, there is also a more serious purpose to it – climate fools can be more consequential than ramblings of a garden variety ones – they help tyrannies like Russia, Saudi Arabia, UAE, Iran to finance wars, terrorism and oppression of own people, and help them to promote apathy toward the existential threat to our civilization and 1000s of species posed by AGW:
– deniers by: “nothing to worry about”, “anything but carbon”
– doomers by: “too late, nothing can be done now, because its “all or nothing” (as if the world with 450ppm was as bad as one with 900 ppm).
So – a bit of fun and the public service at the same time
“the Piotr” ( thank you, Multi-troll, for “the” ;-) )
My recently published paper (in Discover Atmosphere, Springer Nature) reveals that El Nino events are expected to be more frequent. This also means that climatic extremes are expected be more intense and frequent as well
https://link.springer.com/article/10.1007/s44292-026-00077-7
Nabil,
I’m getting a lot out of your paper. Very interesting. Looks significant assuming everything adds up cn be confirmed. I’ll ask a few questions in good time. Thanks for sharing it.
Hi Kobayashi Maru,
Thanks so much for the note! I’m glad you’re finding the paper interesting. Yes, the work does answer pressing questions. I’d welcome any questions or feedback whenever you’re ready.
Hello again Nabil,
I’d really like to know more about your work. I’m not a climate scientist and my math isn’t up to standard either, but I have followed the science for a very long time. ENSO has always been a curiosity for me, and for others as well. It has traditionally been framed as simply the largest contributor to “natural variation” in interannual temperature swings—in other words, “there’s really nothing to see here” as far as climate science goes. So we’ll just extract this ENSO-forced temperature variation from the raw data, and then ignore it completely.
One issue that has never gone away is that ENSO physics has never been properly represented or explained in models, including the CMIP system. They simply can’t integrate ENSO at all—beyond “it just happens when it happens.” On top of that, a number of other factors are typically minimized as being of no importance.
2023–2024 finally exposed those weaknesses like nothing before. On the surface, reading your paper indicates it might have answers previously unavailable, and it’s those aspects I’d like to explore further by putting some questions to you. The 2015–2016 El Niño raised many questions for me that have never been addressed by climate science—yet.
The posting system here is very slow; it takes a couple of days for a comment to appear, and a few more days before any response appears. It might take a couple of weeks of back-and-forth to dialogue effectively. I hope you can do this, but if not, that’s quite understandable too.
I have taken a summary look over your other recent papers, and if I recall correctly, you’ve now retired? My questions may get more detailed as we go, but to start, could you tell me what you saw, or became aware of, that first triggered your intuition that something might be worth exploring about the ENSO pattern—which led to your paper?
Some background may be in order here: RealClimate is often a bastion of “consensus science,” where anything that challenges the prevailing CMIP/self-sustaining oscillator paradigm gets shouted down as “unsupported speculation.” The predominant commentary here is directed toward “paradigm protection,” and not open-ended good science inquiry. Therefore, anything you say will be viewed skeptically by default here.
That was the case when, 10–15 years ago, I and others independently floated the idea that there was more going on with ENSO than met the eye, and suggested the logical possibility that continued warming should impact ENSO in extent and periodicity. No one was curious.
There are two key issues that are not properly addressed using physics in the literature. They’re simply assumed as unexplained causes, then put aside. Your paper appears to address those, but we can get to that later.
If we get another significant El Niño in 2026–27, it will be strong evidence that the external forcing mechanism is real. The standard self-sustaining model would predict less frequent events as the system equilibrates. The external forcing model predicts more frequent and larger events.
This is a testable distinction. That’s what makes this paper valuable—it makes predictions that can be falsified.
This is a welcome attempt to resolve the thermodynamic inconsistency in the self-sustaining oscillator model. The identification of hemispheric warming asymmetry as an external energy source is a significant conceptual advance.
The paper’s prediction—that faster warming leads to more frequent and larger El Niños—matches the post-2015/16 and 2023/24 patterns (and, in my view, even the 1997–98 El Niño events). This is exactly what a couple of us argued on RealClimate and elsewhere back around 2016, and we were dismissed at the time. The data in your paper may have borne out our much earlier intuition.
The paper doesn’t fully explain why the Atlantic and Indian Oceans don’t show similar behavior. The Pacific’s unique size and wind configuration are likely factors, but this deserves explicit treatment. Also, the “low spot” mechanism needs independent verification—does differential thermal expansion actually create a measurable depression? These issues can be explored later.
This is a valuable hypothesis that deserves serious testing, not dismissal. If the 2026–27 El Niño materializes as predicted, it will be strong support for this framework. I’m keeping an open mind and want to follow the data—not the internal “consensus” politics.
The resistance we faced on RealClimate in 2016—being told that ENSO is “self-sustaining,” an irrelevant “natural variation” not connected to global warming, and that global warming wouldn’t change its behavior—now looks like a failure of imagination, not a failure of physics. This paper shows that the thermodynamic argument was always there; it just wasn’t being considered because it didn’t fit the CMIP consensus.
To summarize my main questions for now:
What first triggered your intuition about ENSO and the hemispheric asymmetry mechanism?
How do you see the Pacific’s uniqueness relative to the Atlantic and Indian Oceans in this framework?
Is the “low spot” mechanism testable with current observational data (e.g., sea level anomalies)?
Looking forward to your input here, Nabil.
KM said:
This is Nabiil Swedan’s work from circa 2013 onwards:
“This is a nonsense. There is no greenhouse gas effect; it is a fiction.”
https://judithcurry.com/2013/07/25/arctic-time-bomb/
I doubt we are dealing with a good faith scientific researcher in the context of Swedan. But, go ahead and knock yourself out.
Thank you, KM, and RealClimate for hosting this discussion. Here are my answers to your questions:
1) What first triggered your intuition about ENSO and the hemispheric asymmetry mechanism?
Reply: The trigger was seasonal hemispheric warming asymmetry, the resulting large fluctuations in thermohaline and poleward heat transport, and subsequent tropical cyclone formation (see reference 4, Swedan, 2020). I realized that El Niño formation operates on the same principle, but over a longer period. Halting the trade winds must cause a dissipation of potential energy, similar to the fluid dynamics of a water, air, or steam hammer in practical engineering applications.
2) How do you see the Pacific’s uniqueness relative to the Atlantic and Indian Oceans in this framework?
Reply: While all three tropical basins accumulate warm water in a similar fashion, the Pacific is unique due to its geography. The landmasses of Central and South America act as a barrier that pools and holds the warm water when the trade winds subside.
3) Is the “low spot” mechanism testable with current observational data (e.g., sea level anomalies)?
Reply: Yes, the tropical “low spot” is observable in seasonal sea-level variations, though it is more challenging to detect within ENSO cycles. For context, the sea-level difference between the Pacific and Atlantic Oceans was measured at nearly 20 cm during the construction of the Panama Canal. Since then, a hemispheric warming asymmetry of approximately 0.3°C may have decreased that baseline difference by about 0.5 cm.
End of reply.
Kobayashi Maru “ Hello again Nabil, I’d really like to know more about your work.”
Paul Pukite: “This is Nabil Swedan’s work from circa 2013 onwards:
“This is a nonsense. There is no greenhouse gas effect; it is a fiction.”
Good catch, Paul. Now, let’s see what doomer KM would do with his new denier friend. After all, the Doomism is based on the greenhouse effect being real AND so massive that it spells the DOOM of the human civilization.
Came for the questioning of the climate models, stayed for Nabil Swedan’s greenhouse effect denial? ;-)
PS. Other pearls of Nabil Swedan’s wisdom.
– Nabil Swedan’s endorsement of “Drill, baby, drill”:
“Models are missing the potential energy of the atmosphere in the energy equation, which is 50% of the energy exchange with the earth. There is no way that they can make correct projections unless it is fixed. Until then, and in the absence of correct numbers, I think we should continue to drill.” Nabil Swedan, hosted by Judith Curry’s website
– Nabils Swedan’s take-down of … James Hansen:
“ Again, the work presented in this paper is based on a climate computer model that
has incorrect physics. The energy balance of these climate models is based on the
radiative forcing approach of the so called greenhouse gas effect. This effect is a fiction
and the radiative approach violates the laws of thermodynamics. Colder atmospheric
air “slabs” cannot radiate energy to warmer air “slabs” or surface.” (c) Nabil Swedan
“ Hello again Nabil, I’d really like to know more about your work.” Kobayashi Maru
Be careful, Koba, what you wish for …
in Re to Nabil Swedan, 8 Aug 2026 at 10:40 PM,
https://www.realclimate.org/index.php/archives/2026/07/this-new-el-nino-is-different/#comment-850340
Dear Nabil,
Thank you for your comment additionally explaining your opinion that stronger solar radiation absorption in higher latitudes in comparison to equator causes warm water accumulation in “tropical basins” by creating a “low spot” along the equator due to relatively higher thermal expansion of water in higher latitudes. As you write in your article, “This is because global warming is not evenly spread across the hydrosphere; tropical basins warm less than the global average. Therefore, sea water thermal expansion is least in these basins. As a result, they have become low areas, where heat from warm water accumulates.”
It appears that this view arises from your older article “Parameterization of energy cycles between the hemispheres”
https://pmc.ncbi.nlm.nih.gov/articles/PMC10364954/ ,
however, in none of these contributions, I could identify a clear explanation how this mechanism converts into ENSO oscillations.
In this respect, I would like to remind you of my questions raised already in my comment of 11 Aug 2026 at 2:17 PM,
https://www.realclimate.org/index.php/archives/2026/07/this-new-el-nino-is-different/#comment-850388
namely, in which part your present article explains
(i) a mechanism by which the observed atmospheric and oceanic heat transport across the equator, with a clear annual periodicity, transforms into temporally irregular ENSO cycles, and
(ii) how the asserted heat engine (allegedly working between the hemispheres) gradually storages heat in the Pacific during the La Nina phases, to stop this activity (and let the stored heat release) during the El Nino phases.
Could you comment?
Thank you in advance and best regards
Tomáš
P.S.
To be honest, I am not sure that your assumption (that the warm water somehow slides “downhill” from higher latitudes towards the equator due to some gravitational potential created by its thermal expansion) is justified. Have you considered that despite of the assumed irregular thermal expansion, the mass distribution defining the gravitational potential would have remained basically unchanged?
In other words, I am afraid that if the observed “low spot” is indeed caused by the latitudinal differences in water thermal expansion as you seem to assume, there will be no gravitational driving force for any water flow to the “low spot”, because the ocean surface deformed by the differences in thermal expansion will still represent an equipotential surface.
Nigelj says:
“His el nino paper talks about anthropogenic influences. Those dont have to be influences that cause an enhanced greenhouse effect. He could be talking about completely different anthropogenic influences and causal mechanisms. Judging by his other recent research, he thinks global warming is caused by burning fuel heating up the atmosphere directly. Thats anthropogenic.
Its really simple. I asked him to show us a paper demonstrating he has changed his mind. So far he hasn’t. Alternatively he can clarify whether he now accepts the greenhouse effect, and that humans are warming the climate by increasing the greenhouse effect. I’ll wait.”
Reply to Nigelj: I have learned that it is counterproductive to engage in informal debates unsupported by formal text. Therefore, my reply to your question is to read my published paper on the subject: https://www.mdpi.com/1099-4300/25/1/72
NS, I don’t have time to read your published paper in full, and the technicalities look like they would be above my pay grade. So again I’m asking you a question: Can you clarify to me whether you now 1) accept there is a greenhouse effect as its normally described by NASA for example, and 2) you accept that humans are warming the climate by increasing the greenhouse effect and that 3) this effect is at least a dominant or major part of the warming trend?
Those are simple yes / no questions. Im just trying to establish some legitimate clarity. Theres is no reason to refuse to answer, unless you are trying to be evasive. Im not interested in an informal debate. Just asking a simple, normal, polite question.
In Re to Nabil Swedan, 12 Aug 2026 at 6:18 PM,
https://www.realclimate.org/index.php/archives/2026/07/this-new-el-nino-is-different/#comment-850410
and 14 Aug 2026 at 2:23 AM,
https://www.realclimate.org/index.php/archives/2026/07/this-new-el-nino-is-different/#comment-850442
Dear Nabil,
First, thank you for your correction that Earth can be indeed considered as a closed thermodynamic system. I have erroneously used the term “closed” instead of the term “isolated”, I apologize.
Let us now look in detail at your article “Thermodynamic Analysis of Climate Change”,
https://www.mdpi.com/1099-4300/25/1/72
that Nigel assigned as “primary published paper outlining (your) alternative model”. Personally, I see his view as accurate, even though you are correct that the wording “alternative science” does not occur throughout your text.
In the article, you refer to your earlier works treating photosynthesis as a heat engine and explore your hypothesis that the cumulative “excess” heat released during industrial era by carbon oxidation to carbon dioxide (by fossil fuel combustion and deforestation, with a correction considering photosynthesis acceleration), on one hand, warms sea surface and increases sea level by ice thawing and by water thermal expansion, and, on the other hand, is somehow “rejected” to the stratosphere, thereby causing its cooling. This hypothesis does not consider any radiative energy exchange and can thus be indeed seen as an “alternative” to present climate science.
This view is also supported by your Chapter 6 “Discussion and Conclusions”, wherein you compare radiative forcing calculated using your theory with the observed value and conclude:
“.. the calculated radiative forcing by Equation (14) is 2.57 Wm−2, .. and the observed radiative
forcing by IPCC is 2.64 Wm−2 as discussed in the Introduction. They are in good agreement,
which confirms the equivalence between radiative and thermodynamic methodologies.”
I think that it is not important if we see your theory as an “alternative” or, like you, as an “equivalent” to the current climate science theory. Let us rather look closer at some details of your work and check if they fit together as good as it looks at first sight.
As I already mentioned in my previous comment, I have been very skeptical about your core assumption that Earth can be treated as an isolated system, wherein a selected layer, namely the sea surface and the air thereabove, stores the heat released by carbon oxidation without any dissipation and/or radiative losses thereof. I therefore looked on your sample calculation of the “sea air temperature rise” according to equation (17) that provides the value 0.06 K as follows:
dTS = 2.53 × 1021 × 0.0119/(4.86 × 10 17 × 1 000) = 0.060 ◦C
Please note that in this equation, the term 4.86 × 10 17 kg is annual global sum of precipitation assigned in equation (17) as „gamma“ and that by dividing it by 0.0119 which stands for air humidity at saturation with sea water (in kg water per kg dry air), we should obtain the summary mass Ma of the air heated by absorbing the previously calculated heat 2.53 × 10²¹ J. By doing so, we obtain Ma = 4 × 10¹⁹ kg, eight times more than the entire mass of Earth’s atmosphere. This is a clear discrepancy suggesting that some of the assumptions used in your theory may be incorrect.
Furthermore, turning my attention to your calculation of the radiative forcing caused by 100 ppm CO2 concentration increase in Earth’s atmosphere during the 255-year time span between 1750 and 2005, I noted that the time put into calculation formula is 1 year instead of 255. I therefore suppose that the correct value of the radiative forcing calculated according to your theory as the cumulative heat of carbon oxidation in isolated Earth system between 1750 and 2005 should be 0.01 W/m2 instead of 2.57 W/m2, whereby the originally perceived good fit of your theory with observation disappears.
I am afraid that these discrepancies cast doubts not only on the validity of your conclusions but also on the quality of the feedback provided by peer review process successfully passed by your article. I therefore think that the entire article might deserve your thorough review and rethink that should include even the basic assumptions underlying your theory.
Best regards
Tomáš
Tomáš Kalisz says:
“I am afraid that these discrepancies cast doubts not only on the validity of your conclusions but also on the quality of the feedback provided by peer review process successfully passed by your article. I therefore think that the entire article might deserve your thorough review and rethink that should include even the basic assumptions underlying your theory.”
Reply to Tomáš Kalisz:
No, Sir. The sample calculations are correct. You should pay attention to the units. What you calculated, MA, is not the atmospheric air mass, it is air circulation, kg/yr. This means, in a year, there are about eight turn overs of the atmospheric air mass.
Please take a closer look at the sample calculations, they are for the period of time between 2010 and 2020. They are per decade, not one year.
Therefore, the radiative forcing and thermodynamic methodologies give the same results. This should not be a surprise, because any radiative model has an equivalent thermodynamic one. That’s why the Stefan-Boltzmann law formula can be derived from basic thermodynamic relationships.
Swedan points to his paper: https://www.mdpi.com/1099-4300/25/1/72
OMG, this guy claims to be a chemical engineer? This paper is all sleight-of-hand tautological argumentation. He claims that heat released by burning CO2 is enough to explain the warming … true for a transient interval but never considers that the Earth eventually RADIATES away the excess heat and only the emitted CO2 stabilized in the atmosphere is providing the long-term mechanism for the warming. The idea of this kind of enduring catalyst (both the CO2 catalytic persistent and catalyzing more H2O) generating the actual response should be a no-brainer to a real chemical engineer, because that’s the kind of analysis they do for a living.
Well, I took a look at the abstract. You’re talking about chemical energy when the greenhouse effect is a radiative process. How your paper got through peer review escapes me.
Tomáš Kalisz says:
“I am afraid that these discrepancies cast doubts not only on the validity of your conclusions but also on the quality of the feedback provided by peer review process successfully passed by your article. I therefore think that the entire article might deserve your thorough review and rethink that should include even the basic assumptions underlying your theory.”
Reply to Tomáš Kalisz:
No, Sir. There are no discrepancies, please pay attention to the units of measurement. Ma is not the atmospheric air mass, it is air circulation, measured in kg/year. Therefore, there are nearly eight turn overs of the atmospheric air mass in one year.
Also, the calculations are conducted for the period of time between 2010 and 2020, or per decade. They are not on an annual basis.
With these clarifications, the radiative forcing of greenhouse gases and thermodynamic methodology give the same results. This should not be a surprise, because the Stefan-Boltzmann law formula can be derived from basic thermodynamic relationships.
in Re to Nabil Swedan, 15 Aug 2026 at 1:00 AM,
https://www.realclimate.org/index.php/archives/2026/07/this-new-el-nino-is-different/#comment-850473
Dear Nabil,
Thank you for your response, however, I still do not understand your explanation.
If you supposed that entire Earth’s atmosphere must eight times recirculate in contact with the sea surface to absorb the “Ocean share of heat = dQS/2 = 2.53 × 10²¹ J” considered in your calculation example, I would expect that its temperature rise should be 0.48 K instead of the calculated 0.06 K, simply because it is any time still the same Earth’s atmosphere that must, step-by-step, absorb the entire 2.53 × 10²¹ J in these eight consecutive steps, without being allowed to anyhow cool meanwhile.
Although I noted the “sea surface temperature rise” dTs calculated from line 13 of your Table 1 as the difference between years 2010 and 2020 would indeed give 0.06 K, it remains totally unclear how the listed values, or differences thereof, can arise from your equation (17).
Moreover, you reply completely omitted the obvious error in your calculation of the “radiative forcing” that should correctly give 0.01 W/m2 instead of 2.57 W/m2. I think that already in view of this error alone, your assertions “The sample calculations are correct. You should pay attention to the units.” sound quite bold.
Best regards
Tomáš
Nigel to Nabil Swedan: “ Can you clarify to me whether you now 1) accept there is a greenhouse effect”
Apparently no – unless he retracted his 2020 paper in .Acta Ecologica Sinica in which he writes:
“When the green matter is cleared, it decomposes, oxidizes, and releases to the climate the heat of carbon conversion to carbon dioxide.” And “the heat released [from burning fossil fuels) is gained by the climate”
So according to N. Swedan – the only meaningful way in which production of CO2 affects climate is the … expelling of the thermodynamic “heat of carbon conversion to carbon dioxide”, i.e. he STILL TREATS the greenhouse effect as “a fiction”,
Ergo, nothing has changed since he called greenhouse effect “it is a fiction”, “incorrect physics”, and contrary to the laws of thermodynamics.
And being supposedly a Doctor Engineer in Chemical Engineering yous hould have known better – you should have done what any half-decent first-year student of science or engineering would do – an elementary scale analysis, a back-of-the-envelope calculation to check whether the proposed process has sufficient magnitude to explain what we measure:
– Total accumulation of CO2 in atm. per year: ~ 18 Gt of Co2 /yr = 4*10^14 mol of CO2
– Gibbs free energy of oxidation of C to Co2 = -394,4 kJ/mol
Multiplied, they give us 1.6*10^29 J/yr.
Now let’s divide it by the 510 mln km2 * 365.25*24*3600 sec/yr = 5.07*10^29 m^2 sec/yr
Ta-daaam: the average warming of the Earth due to heat of conversion of C to CO2 is = 3*10^-10 W/m2
For a comparison = the current radiative forcing of the greenhouse gasses (= human-made increase in GH effect) according to NOAA is about 3.5W/m2. I.e. That’s 10 BILLION TIMES MORE than your effect, Doctor Engineer Nabil Swedon!
The reviewers didn’t pick up on your climate calculation, perhaps it was outside of their area of expertise (is this the reason why you chose to submit this paper to a Chinese ecological journal instead of a primary climatogical journal ?), but shouldn’t Doctor Engineer, to make sure that you do not make sure that you damn right BEFORE you tried to discredit climate modelling and James Hansen in particular ????: I quote:
“ Again, the work presented in [James Hansen’s et al. ] paper is based on a climate computer model that has incorrect physics . The energy balance of these climate models is based on the radiative forcing approach of the so called greenhouse gas effect. This effect is a fiction and the radiative approach violates the laws of thermodynamics ”
Nabil Swedan
Arrogance is annoying even in people in geniuses being right. You, Mister, arrogantly dismiss an entire field of science (climate modelling) and an important member of that community (James Hansen), and you do it based on YOUR OWN IGNORNACE and on your inability to even consider that if everybody in the field does something opposite to you – maybe its not all of them, but you, who are wrong.
“The first principle is that you must not fool yourself—and you are the easiest person to fool.“
in Re to Piotr, 17 Aug 2026 at 12:52 PM,
https://www.realclimate.org/index.php/archives/2026/07/this-new-el-nino-is-different/#comment-850523
Hello Piotr,
4*10^14 mol CO2 multiplied by 0.4 MJ/mol gives 1.6*10^20 J/yr, not 1.6*10^29 J/yr.
Accordingly, 1.6*10^20 J/yr is 5,07*10^12 W and the corresponding radiative forcing is about 0.01 W/m^2.
Greetings
Tomáš
Piotr says:
“No, Sir, and this is your ignorance. Chapter 8 of IPCC AR6 gives radiative forcing in W/m2 units. “Energy” would have the units of “Joules”, not “Watts”.
Reply: Piotr, you should read Chapter 8 of IPCC AR6 attentively, then you know what I mean. Look, if the radiative forcing of 2.65 w/m2 was a power term, then the average amount of ocean heat gained would be 5.30 x 1024 joules for the entire period of 250 years, which is 10 to 100 times greater than the observed heat gained by the ocean based on the literature published in the last twenty years. This is of course impossible. The same heat would have increased the temperature of the ocean mixed layer by about 40 degrees centigrade, which has not happened.
Nabil Swedan, repeated posts: “ Piotr, you should read Chapter 8 of IPCC AR6 attentively ”
Radiative forcing has units of W/m2. Watts are ALWAYS units of Power, NEVER as you claim the units “energy”, But since you assume your infallibility – put your money where your mouth is and QUOTE that part of Chapter 8 of IPCC AR6 says the opposite. And isn’t it strange – that you challenge the physics by claiming that Watts are unit of energy – with a vague reference to a single document (IPCC AR6), the very document that keeps talking about “greenhouse effect” that you called “a fiction”, and “radiative approach” that you called “incorrect physics, violating the laws of thermodynamics”.
Then we have your other intellectual achievements – you multiply W/m2 by time, and still get W/m2 as a result ;-), A veritable physical miracle! I quote:
=====
Nabil Swedan: “Time is always associated with radiative forcing, such as 0.05 w/m2 annually, 0.1 w/m2 per decade, or 2.65 w/m2 for the entire global warming period”
NOBODY, other than perhaps the Napoleon from the next bed over, “associates” things like you. Your “association” has as much sense as saying that because my car goes at the moment 50 km/h, then it goes “ 438,000 km/h annually, 4 ,380,000 km/h per decade and 87,000,000 km/h over 200 years That’s Mach 71,000. And they were telling me that my car may be underpowered … ;-)
========
Nabil Swedan “Look, if the radiative forcing of 2.65 w/m2 was a power term, then the average amount of ocean heat gained would be 5.30 x 1024 joules for the entire period of 250 years,”
Wrong AGAIN – the energy imbalance resulting from 2.65 w/m2 – warms the Earth surface and atmosphere. Their increased temperature, according to Stefan-Boltzmann law INCREASES amount of IR radiated out. Therefore, MOST of these 2.65 w/m2 does not heat up deeper layers of the ocean, but is radiated into the space, as a part of the radiative approach which you dismissed as “ incorrect physics” “violating the laws of thermodynamics” (c) Nabil Swedan, Atmos. Chem. Phys. Discuss., 15, C5268–C5269, 2015.
That you are incapable to understand any of the above, incapable to consider that you are not infallible, and incapable to own up you to your arrogant ignorant claims – says all we need to know about you and your scientific integrity.
Garbage in, Nabil Swedan’s claims and publications out.
Tomáš Kalisz says:
https://www.realclimate.org/index.php/archives/2026/07/this-new-el-nino-is-different/#comment-850498
Reply: please see answers in these following comments:
https://www.realclimate.org/index.php/archives/2026/07/this-new-el-nino-is-different/#comment-850458
https://www.realclimate.org/index.php/archives/2026/07/this-new-el-nino-is-different/#comment-850504
As acknowledged in the paper, there is room for improvement, meaning any additional explanations of the phenomenon may potentially improve our understanding of warm water dynamics.
in Re to Nabil Swedan, 16 Aug 2026 at 7:04 PM,
https://www.realclimate.org/index.php/archives/2026/07/this-new-el-nino-is-different/#comment-850513
Dear Nabil,
Thank you for your response. It appears that you rely on your older publications
“Parameterization of energy cycles between the hemispheres”,
https://journals.sagepub.com/doi/pdf/10.1177/0036850420922773
and “Calculation of Open Water Evaporation as a Climate Parameter”
https://content.scirp.org/pdf/jwarp_2018081616323722.pdf ,
wherein you seem to ascribe the observed 0.2 m sea level difference on both sides of the Panama isthmus to the stronger solar heat absorption by oceans of the Southern Hemisphere in comparison with seas and oceans of the Northern Hemisphere.
It appears, however, that this is merely your speculation, because oceanography seems to explain this phenomenon partly as a result of differences in salinity and partly rather as a effect of oceanic currents than a cause thereof. Although you have not attempted to anyhow disprove the established theory in any of the above cited publications, it appears that you simply take your conclusions made therein as proven and your starting (in my opinion still highly controversial) assumption as a sufficient basis for your present “explanation”:
“Regarding the 20 cm difference between the Pacific and Atlantic, this is the hydraulic driving force of water flow at surface from south to north, similar to river flow.”
I admit that reading your articles is difficult and that I might have misinterpreted them, however, if you wish to convince your readers that you are right, you should be as clear as possible and provide also detailed explanations why the established theories are incorrect. I am afraid that so far, you fail in both directions.
Best regards
Tomáš
Tomáš Kalisz says:
The unit of radiative forcing (W/m2) suggests that radiative forcing characterizes a power flux – a sum of power divided by the area through which this power flows.
Reply: No, Sir, and this is your confusion. Chapter 8 of IPCC AR6 is clear, radiative forcing is not a power term, it is an energy term. Time is always associated with radiative forcing, such as 0.05 w/m2 annually, 0.1 w/m2 per decade, or 2.65 w/m2 for the entire global warming period. So your 2.57 w/m2 is an energy for the entire period, where as 0.01 w/m2 is power of one year. You are not comparing an apple to an apple.
NS: “Chapter 8 of IPCC AR6 is clear, radiative forcing is not a power term, it is an energy term.”
American Meteorological Society glossary of meteorology:
radiative forcing: “In radiation, the net flux of radiation into or out of a system.”
flux: “The time rate of transport of some quantity, often used in reference to the flow of matter and energy in the atmosphere.”
Nabil Swedan: “ No, Sir, and this is your confusion. Chapter 8 of IPCC AR6 is clear, radiative forcing is not a power term, it is an energy term”
No, Sir, and this is your ignorance. Chapter 8 of IPCC AR6 gives radiative forcing in W/m2 units. “Energy” would have the units of “Joules”, not “Watts”.
Nabil Swedan: “Time is always associated with radiative forcing, such as 0.05 w/m2 annually, 0.1 w/m2 per decade, or 2.65 w/m2 for the entire global warming period”
NOBODY, other then perhaps the Napoleon from the next bed over, “associates” things like you. Your “association” has as much sense as saying that because my car goes at the moment 50 km/h, then it goes “ 438,000 km/h annually, 4 ,380,000 km/h per decade and 87,000,000 km/h over 200 years That’s Mach 71,000. And they were telling me that my car may be underpowered … ;-)
So the question is – will you request the retraction of ALL your published papers that are based on your claim that source of global warming is the reaction heat of C oxidized to CO2?
Will you also request a withdrawal of your published criticism (Atmos. Chem. Phys. Discuss., 15, C5268–C5269, 2015) of James Hansen, where you disparaged his wor, as based on “incorrect physics”, and “violating the laws of thermodynamics”?
After all: “Professional and academic standards rely on official written and published work ” (c) Nabil Swedan
P.S. Once this is done – perhaps an apology to the greenhouse effect for calling it hurtful names (“the so-called” and “a fiction“) may be in order?
In Re to Nabil Swedan, 24 Aug 2026 at 5:28 PM,
https://www.realclimate.org/index.php/archives/2026/07/this-new-el-nino-is-different/#comment-850638
Dear Nabil,
Thank you for your response.
First, I must admit that I am somewhat surprised by your assumption that radiative forcing is an energy. If so, I would rather expect that it will be quantified in Joules than in Watts per square meter. Could you specify the pages / paragraphs of the Chapter 8 of IPCC AR6 that support your interpretation?
As regards your 2023 article “Thermodynamic Analysis of Climate Change” in the journal “Entropy”
https://www.mdpi.com/1099-4300/25/1/72 ,
on page 14 of your text, you wrote
“Through 2005, the concentration of carbon dioxide in the atmosphere increased by 99.91 ppmv. The total heat exchanged with the surface between 1750 and 2005 is equal to 7.07 × 1019 × 99.91/0.17 = 4.16 × 10²² J, Equation (14). The equivalent radiative forcing is 4.16 × 10²²/(5.14 × 1014 × 3.15 × 107 ) = 2.57 W m−2 . The quantities in the denominator, 5.14 × 10¹⁴ and 3.15 × 10⁷ , are the area of the surface of the earth, m2 , and the number of seconds in one year, respectively.”
I would like to explain that originally, I understood this paragraph conventionally, the way that in accordance with your equation (14) , you calculated anthropogenic heat 4.16 × 10²² J released into atmosphere as enthalpy of carbon dioxide formation during the period 255 years (from 1750 to 2005). Then, you obtained your (not “my”) value of the equivalent radiative forcing 2.57 W m−2 by dividing this heat (assumed to accumulate in Earth’s atmosphere for 255 years) by Earth’s surface area and (to my surprise) by the number of seconds in ONE year only.
The reason why I objected that there is a calculation error and that you forgot dividing your result by 255 years to obtain the correct value 0.01 W m−2 is the conventional physical definition of power as an energy released or consumed during a certain time span divided by the length of this time span. In other words, if you suppose that your energy of carbon combustion accumulated for 255 years, then the respective power should be obtained by dividing this energy by the time span of 255 years.
It appears, however, that in accordance with your understanding to the definition of radiative forcing in the Chapter 8 of IPCC AR6, you assume that for a certain given “energy content of the climate system”, various radiative forcings can be calculated by dividing this energy by duration of an arbitrarily chosen time span. Based on your calculation example, you seem to assume that the radiative forcing for year 2005 can be indeed calculated as the energy accumulated till the end of the year 2005 divided by duration of the year 2005. On the other hand, in your last comment, you assert that “2.57 w/m2 is an energy for the entire period, whereas 0.01 w/m2 is power of one year” what sounds to me still totally confusing.
In a summary, it remains still unclear what you meant by the “radiative forcing” that you calculated in your calculation example. Therefore, I would like to ask you for another, more detailed calculation example with respect to the “radiative forcing”, as well as for a clarification which parts of the Chapter 8 of IPCC AR6 served as your inspiration.
Best regards
Tomáš
Piotr says:
“No, Sir, and this is your ignorance. Chapter 8 of IPCC AR6 gives radiative forcing in W/m2 units. “Energy” would have the units of “Joules”, not “Watts”.”
Reply: you should read Chapter 8 of IPCC AR6 attentively. The IPCC AR6 Context: In IPCC Assessment Reports, radiative forcing is explicitly defined relative to a baseline year (typically 1750) to quantify the total cumulative perturbation to the Earth’s energy balance over that entire multi-century period. Radiative forcing 2.7 W/m2 value is a time-integrated energy term representing a cumulative perturbation over the entire industrial era, meaning it cannot be used as a real-time, annual power input to calculate immediate surface layer warming.
If the 2.7 W/m2 were relative to 2026 and not to 1750 as you state, then it’s a power term, and there would be a massive energy that goes to the ocean mixed layer annually, 4.4 E24 joules annually, enough to raise the temperature of the ocean mixed layer by 0.3 degrees centigrade every year, which is not observed. Then where does this massive amount of heat goes? It will be hard to explain based on your interpretation of radiative forcing.
Piotr says:
“No, Sir, and this is your ignorance. Chapter 8 of IPCC AR6 gives radiative forcing in W/m2 units. “Energy” would have the units of “Joules”, not “Watts”.”
Reply: you should read Chapter 8 of IPCC AR6 attentively. The IPCC AR6 Context: In IPCC Assessment Reports, radiative forcing is explicitly defined relative to a baseline year (typically 1750) to quantify the total cumulative perturbation to the Earth’s energy balance over that entire multi-century period. Radiative forcing 2.7 W/m2 value is a time-integrated energy term representing a cumulative perturbation over the entire industrial era, meaning it cannot be used as a real-time, annual power input to calculate immediate surface layer warming.
If the 2.7 W/m2 were a power term as you state, then it is relative to 2026 and not to 1750, and there would be a massive energy that goes to the ocean mixed layer annually, 4.4 E22 joules annually, enough to raise the temperature of the ocean mixed layer by 0.3 degrees centigrade every year, which is not observed. Then where does this massive amount of heat goes? It will be hard to explain based on your interpretation of radiative forcing.
in Re to Nabil Swedan, 28 Aug 2026 at 10:35 PM,
https://www.realclimate.org/index.php/archives/2026/07/this-new-el-nino-is-different/#comment-850747
Dear Nabil,
Thank you for your comment. It reveals that you fail to differentiate radiative forcing and Earth Energy Imbalance (EEI).
1) Both terms fit with the real situation of Earth absorbing radiative energy from the Sun and emitting infrared radiation to the space, and this way having a tendency towards establishing a steady state, commonly known under inaccurate name “radiative equilibrium”.
2) Personally, I see the common usage of thie term “radiative equilibrium”
as quite unfortunate, because it may suggest some relationship with a thermodynamic equilibrium. Notion of a such relationship would be, however, false because Earth is not an isolated system, wherein we could apply simple laws of classical thermodynamics.
3) This inapplicability of the approaches of classical thermodynamics is also in a fundamental conflict with the core assumption of your article “Thermodynamic Analysis of Climate Change”,
https://pmc.ncbi.nlm.nih.gov/articles/PMC9857689/pdf/entropy-25-00072.pdf
that Earth could have accumulated the “excess” heat created by humanity during industrial era by fossil fuel combustion and that the observed global warming could have resulted from this accumulated heat.
4) I noted that on 29 Aug 2026 at 10:46 PM,
https://www.realclimate.org/index.php/archives/2026/07/this-new-el-nino-is-different/#comment-850767
Piotr already tried to explain to you that the cumulative radiative forcing from greenhouse effect of CO2 (and other greenhouse gases) that accumulated in Earth’s atmosphere during the industrial era combines with other positive and negative forcings and feedbacks to yield the actual EEI. It appears that for a quite long period of the industrial era, the EEI resulting from this combination was almost zero or only slightly positive. According to
https://pmc.ncbi.nlm.nih.gov/articles/PMC11671437/ ,
the current Earth Energy Imbalance (EEI) derived from NASA’s CERES satellite observations for the last decade is approximately 1.0 ± 0.2 W/m², and it appears that this value does decently fit with observed ocean heating (“ocean heat content”, OHC) measured by Argo buoys.
5) These observed EEI and OHC values, on the other hand, are two orders of magnitude higher than the EEI (and/or OHC) calculated for the last decade from your theory which assumes that the EEI can be calculated from the “excess” heat created by humanity during this decade by fossil fuel combustion (and supposed by you to somehow magically accumulate in Earth).
6) I hope that if you knew these elementary facts, you would have never written your article and thus could have prevented reputation damage to the journal “Entropy” (and to you) caused by its publication.
Best regards
Tomáš
Piotr says:
– Total accumulation of CO2 in atm. per year: ~ 18 Gt of Co2 /yr = 4*10^14 mol of CO2
Reply: why did you use only one year for the calculations and not the entire anthropgenic emission time of nearly 200 years? When you level this emission time for both methodologies, you will find that heat production and radiative forcing are equal.
in Re to Nabil Swedan, 23 Aug 2026 at 10:36 AM,
https://www.realclimate.org/index.php/archives/2026/07/this-new-el-nino-is-different/#comment-850592
Dear Nabil,
The unit of radiative forcing (W/m2) suggests that radiative forcing characterizes a power flux – a sum of power divided by the area through which this power flows.
Power is an energy consumed or released for one second. If Piotr or anyone else will follow your recommendation and will consider the entire fossil fuel consumption during the industrial era, he will have to divide more mols CO2 with more seconds (corresponding to entire industrial era duration) and thus will arrive at very similar result as he already arrived.
So would you, if you in your 2023 article correctly divided the combustion heat (that you supposed to accumulate in Earth during the considered 255 years of fossil fuel burning) by the time span of 255 years expressed in seconds. Instead, you divided this fictive accumulated heat by duration of just 1 year and thus obtained your erroneous 2.57 W/m2 that allegedly support your “theory”.
If you cannot recognize this elementary calculation error in your article, please be so kind and further contribute rather to “Entropy” (and/or similarly generous journals that do not care about such embarrassing “details”) than to this discussion forum.
Best regards
Tomáš
Nabil Sweden presumes the following:
“entire anthropgenic emission time of nearly 200 years … heat production” = cumulative energy
“radiative forcing” = instantaneous power
You claimed to have a degree in chemical engineering, arguably the most challenging and difficult engineering degree to obtain?
Piotr: “Total accumulation of CO2 in atm. per year: ~ 18 Gt of Co2 /yr = 4*10^14 mol of CO2
Nabil Swedan. why did you use only one year for the calculations and not the entire anthropgenic emission time of nearly 200 years? When you level this emission time for both methodologies, you will find that heat production and radiative forcing are equal.
Because, as a Doctor in Chemical Engineering, you know that once you released 394,4 kJ/mol from oxidation of of 1 mol of C to Co2 , you CAN’T release that heat again and again – once you became CO2, there is no more energy to be released from its oxidation.
This is in CONTRAST with radiative approach, in which the molecules of Co2 in the air continue to warm the atmosphere, year after year after year, until they are removed. Thus to calculate the radiative forcing of GHGs, we calculate the extra GH effect from the surplus of GHGs their the preindustrial concentration.
And this effect is currently = about 3 W/m2, while your production of oxidation heat = 0.01 W/m2. 0.01W/m2 is NOT “the same” as 3 W/m2. Hence your “proof” that two very different mechanism, are “equivalent” falls apart.
Therefore, ALL the calculations and conclusions in all your papers that were based on your belief the so-called greenhouse effect is a fiction“, “ the radiative approach violates the laws of thermodynamics.“, and/or that the Earth’s warming can be explained by the heat of oxidation ALONE – are all massively wrong and as such SHOULD BE RETRACTED IMMEDIATELY. according to the rule: Garbage in, garbage out.
As you have said yourself: “ Professional and academic standards rely on official written and published work” [(c) Nabil Swedan.] So what’s your next move, Nabil?
Reply to Nabil Swedan in various places on energy and power
For example here Nabil Swedan says 24 Aug 2026 at 5:28 PM
Tomáš Kalisz says: The unit of radiative forcing (W/m2) suggests that radiative forcing characterizes a power flux – a sum of power divided by the area through which this power flows.
Reply: No, Sir, and this is your confusion. Chapter 8 of IPCC AR6 is clear, radiative forcing is not a power term, it is an energy term. Time is always associated with radiative forcing, such as 0.05 w/m2 annually, 0.1 w/m2 per decade, or 2.65 w/m2 for the entire global warming period. So your 2.57 w/m2 is an energy for the entire period, where as 0.01 w/m2 is power of one year. You are not comparing an apple to an apple.
—————————————–
Hi Nabil,
I’m uncertain why but there seems to be a confusion being triggered by one misunderstanding; or contradiction that you are relying on. Which is then skewing subsequent matters about forcing power and energy concepts. Unlike others
I do not consider a mistake a character flaw; but simply a mistake. That’s easy and common to all. .
Chapter 8 of the IPCC Sixth Assessment Report (AR6) does not state that radiative forcing is an energy term instead of a power term.
In fact, the premise is scientifically inverted, and the report structure differs from your description.. Chapter Structure of IPCC AR6In IPCC AR6 (Working Group I), radiative forcing and the Earth’s energy budget are evaluated and defined in Chapter 7 (“The Earth’s Energy Budget, Climate Feedbacks, and Climate Sensitivity”). Chapter 8 of AR6 is actually dedicated to “Water Cycle Changes”.
See – Chapter 7 (“The Earth’s Energy Budget, Climate Feedbacks, and Climate Sensitivity”)
https://lib.icimod.org/records/npaw6-nkg09
Note: It was Chapter 8 of the previous report (AR5) that covered radiative forcing.
Radiative Forcing is a Power Term, Not an Energy Term
According to the official IPCC AR6 Glossary and Chapter 7, radiative forcing (RF) is formally defined as:”…the change in the net, downward minus upward, radiative flux (expressed in Wm-2) due to a change in an external driver of climate change…”
Physically, this unit breaks down as follows:
Watt (W): A unit of power, defined as one Joule of energy per second (J/s.)
Wm-2: Power per unit area (also known as radiant flux density).
Because radiative forcing measures the rate at which energy is being added to or removed from the climate system per second over a given area, it is strictly a power flux term.
A pure energy term would be measured simply in Joules (J) or Joules per square meter (Jm-2).
Why the Confusion Can Occur
The semantic confusion usually happens because radiative forcing is frequently described as a metric to evaluate the Earth’s “energy balance” or “energy budget.” While it dictates whether the Earth is accumulating or losing thermal energy, the value itself represents the flow rate of that energy (power), not a static quantity of accumulated energy.
The semanticas and jargon used within Climate Science repeatedly causes confusion among the most intelligent eye for detail people on the planet. Why? Because it is not linguistically logical to how human minds develop. Scientists minds are reprogrammed at university over many years. The rest of the world continues to operate on common sense and foundational metaphor thought.
Such as positive forcing is bad; and negative force is good, when it comes to climate heating. These confusions permeate all of climate science. Few climate scientists (or activists) are capable of explaining these issues well while displaying a constant superior impatience Exceptions prove the rule.
But they are fantastic at projecting unfounded intentions on everyone else, and dishing out personal indignation and insults instead of politely explaining the problems that arise in understanding thousands of pages of IPCC Jargon and incoherent semantics.
So good luck with working this out and correcting whatever it is that has tripped you up here. I hope the above assists. Cheers
KM: “Chapter 8 of the IPCC Sixth Assessment Report (AR6) does not state that radiative forcing is an energy term instead of a power term……..The semantic confusion usually happens because radiative forcing is frequently described as a metric to evaluate the Earth’s “energy balance” or “energy budget.” While it dictates whether the Earth is accumulating or losing thermal energy, the value itself represents the flow rate of that energy (power), not a static quantity of accumulated energy.”
Yes this semantic confusion could be true for the general public, but Swedan has an engineering degree! He of all people should know that watts per m2 is a power term!
Ko0bayasji Multitroll: “Unlike others – I do not consider a mistake a character flaw; but simply a mistake. ”
How …. uncharacteristically magnanimous of you, given the multiple serious character flaws you have been finding in your opponents, whose mistakes you _couldn’t_ prove.
Alas, the mistake on which Swedan based his attacks on science – accusing Hansen and others of using “incorrect physics”, “violating the laws of thermodynamics” and calling “the so-called greenhouse effect – a fiction” , the mistake which is at the base of most of his publications, the mistake he repeatedly refused to acknowledge as such, instead lecturing the critics of his claim on being wrong – is no longer some innocent mistake anybody could make.
That says quite a bit about the character and intellectual integrity. By their fruits you shall know them.
Thank you, KM, for your elegant explanation and the correction regarding AR5 vs AR6.
https://www.realclimate.org/index.php/archives/2026/07/this-new-el-nino-is-different/#comment-850791
I completely agree that the standard definition of radiative forcing can easily trap even experts in the field. At the end of the day, the numbers are what matter—and treating 2.7 W/m² as raw, instantaneous surface power definitely makes the surface look way too hot on paper.
Nabil Swedan says 1 Sep 2026 at 3:01 PM
Thank you, Nabil. The least I could do.
When confronted with people who conflate a scientific / observational arguments and disagreements about what is real and what isn’t into some distorted version of a personal ad hominem attack against science and scientists, when it is not, should tell you something about engaging with people with deep seated “character flaws” and a total lack of “science nous”-the things they accuse you of. :-)
“Et tu, Brute?”
And yes, Nabil, it doesn’t get any better than that here. “Don’t feed the trolls.”
Have good day.
Nabil Swedan: Thank you, KM, for your elegant explanation
To each his own. ;-)
N.Swedan I completely agree that the standard definition of radiative forcing can easily trap even experts in the field.
Even the experts from grade 5, elementary school, are not trapped by it, since they know that W=J/s are a rate (power) and not an amount (of energy). Thus YOU are the ONLY “expert in the field” who insists that Watts are units of energy and not power. Even Kobayashi Multitroll knows you are wrong – he just blames your ignorance not on you, but on his nemesis – the IPCC.
N. Swedan “ At the end of the day, the numbers are what matter [in 2.7 W/m² ] ” –
No, at the end of the day – it’s the units that matter – without them, in physics, numbers mean nothing. Wrong units in – garbage out. See your publications for examples.
N Swedan: “ treating 2.7 W/m² as raw, instantaneous surface power ”
Watts ARE the SI units of power: W=J/s. And you can’t multiply W/m2 by time AND still get “W/m2” as a result. as you did in your:
====== Nabil Swedan: “Time is always associated with radiative forcing, such as 0.05 w/m2 annually, 0.1 w/m2 per decade, or 2.65 w/m2 for the entire global warming period”
Piotr: “Your “association” has as much sense as saying that because my car goes at the moment 50 km/h, then it goes “ 438,000 km/h annually, 4 ,380,000 km/h per decade, and 87,000,000 km/h over 200 years. That’s Mach 71,000. And they were telling me that my car may be underpowered …
====================
Nabil Swedan: 2.7 W/m² makes the surface look way too hot on paper.
Only to Nabil Swedan who believes that ALL energy from multiplying 2.7 W/m² by 250 years …. stays on the surface and NONE of it is radiated into space in the form of outgoing radiation. The same Swedan who chastised publicly James Hansen for “incorrect physics”, for using “radiative approach” which according to the said expert “violates the laws of thermodynamics”, and for talking about “the so-called greenhouse effect. It is a fiction” [(c) for all: Nabil Swedan]
Are these claims also the fault of the IPCC, Mr. Kobayashi ?
– Nabil Swedan: “No, Sir, and this is your confusion. Chapter 8 of IPCC AR6 is clear, [W/m2] is not a power term, it is an energy term”.
– Piotr: “QUOTE that part of Chapter 8 of IPCC AR6 that says that Watts are “not a power term, it is an energy term”.
– Nabil couldn’t, so … KM joined in, to blame the ignorance and hutzpah of N. Swedan on … the IPCC, implying that Swedan is “ among the most intelligent eye for detail people on the planet” supposedly confused by IPCC
– Nabil agreed, implied that he is an “expert in the filed”, and thanked KM for blaming _his_ (Nabil’s) ignorant claims on … the IPCC.
-KM returned the favour: “ Thank you, Nabil. The least I could do. […] and yes, Nabil, “Don’t feed the trolls.”
which comes from the mouth of … the first troll of RC, who has posted thousands (?) of ,often walls-of-text, posts. from behind many dozens of names, … ;-)
But thank you for showing your priorities, Mr. Kobayashi – to get at your RC opponents and at the IPCC, you are willing to throw your personal hero James Hansen under the bus – your Nabil Swedan DISMISSED the work of James Hansen as based on his “ incorrect physics” and “ violating the laws of thermodynamics” (c) Nabil Swedan, Atmos. Chem. Phys. Discuss., 15, C5268–C5269, 2015, and who calls and treats the very mechanism of your proselytized Climate Doom – the “ so-called greenhouse effect ” – as “a fiction “.
In other words, you, Mr. “Kobayashi”, are willing to jump into bed with anybody and anything, as long it helps your ego against your RC critics and the IPCC.
What a sad, sad, life you must have.
Almost zero content from the Nabil Swedan paper. Like Willis Eschenbach’s recent “peer-reviewed” paper, it is a tunable back-solved analysis that uses data that is not independent from the measurement being interpreted. This is a troubling trend in this class of papers. May do a PubPeer takedown here.
PP: May do a PubPeer takedown here.
Please don’t. Do it on PubPeer and leave it there. Your regular commentary is painful enough Paul.
Especially when 1) you cannot explain your outlier theory 2) have zero data or analysis to support it. 3) are incapable of submitting a research paper for the first step of a peer-review process, let alone managing to get your “work” Published in either a tier-1 or a tier-10 pub.
The fact is Paul. If anyone was seeking insights into ENSO, you are the last port of call. Enough of your waffle which is equivalent to Piotr and a Tomas trolling / sea loin commentary here.
I’m interested in what Nabil Swedan says about his published research paper — not your handwaving. I have a number of questions to put when I can get around to it. Meanwhile, please do the world of science forums a favor through your silence. And have a lovely day.
Kobayashi Maru demands:
“Please don’t”
Too late anyways, but you aren’t the one to tell me what I can or cannot do with respect to PubPeer.
So if you are up to it and not a coward, take your support of the Nabil Swedan paper here:
https://pubpeer.com/publications/398D8BF9028B5861D1340E02AB7911
– Paul Pukite: “May do a PubPeer takedown here.”
– Kobayashi Multi=troll: “Please don’t. Do it on PubPeer and leave it there. Your regular commentary is painful enough Paul.
– Paul Pukite: “Too late anyways, but you aren’t the one to tell me what I can or cannot do with respect to PubPeer.”
To be fair, I don’t think Multitroll was telling you “what you can or cannot do on PubPeer”. It was telling you not to bring your PubPeer stuff to RealClimate. Hence: its: “ Do it on PubPeer and leave it there“.
That said, it’s rich – since it implies that the troll believes that ITS mass production on RC is eagerly awaited, and a delight to read. Talk about a troll lecturing an opponent on the speck in his eye, and completely oblivious to the plank in troll’s own.
Paul learn how not to cherry-pick to the point of destroying the context in the process of protecting your internalized Biases.
PP: May do a PubPeer takedown here.
MK: Please don’t. Do it on PubPeer and leave it there.
That is either a lack of logical competence or the intentional manipulation of readers here? Which is it?
I looked – I moved on. There’s no interest by others on your pubpeer post either — that’s normal. No natural variation there. It’s Paulk speaking to the Void.
When I said that I may do a PubPeer takedown here, it was in the context with respect to the paper, i.e. a vernacular or colloquial expression. It’s sad that you have to twist my intent. Really, why would I do it in this forum, when a PubPeer review has teeth and has the potential for getting the paper retracted?
Paul Pukite says:
“This is Nabiil Swedan’s work from circa 2013 onwards:
“This is a nonsense. There is no greenhouse gas effect; it is a fiction.”
https://judithcurry.com/2013/07/25/arctic-time-bomb/
I doubt we are dealing with a good faith scientific researcher in the context of Swedan. But, go ahead and knock yourself out.”
Paul: Professional and academic standards rely on official written and published work rather than conversational or outdated comments to ensure fairness and accuracy.
Nabil Swedan, in defense of his denier opinions written and published on the Internet.
: Professional and academic standards rely on official written and published work rather than conversational or outdated comments to ensure fairness and accuracy.
The intellectual integrity of a scientist depends on the ability to admit it if you erred in your past public pronouncements, and to honestly apologize for the arrogant dismissal of other people’s written and published work, if you based your attack on your own ignorance and your presumption of being smarter than the climate scientists, whose published work you disparaged.
Case in point: Nabil Swedan’s attack on climate modelling in general, and on James Hansen’s work in particular, written and published in
==== <a href= "https://acp.copernicus.org/preprints/15/C5268/2015/acpd-15-C5268-2015-print.pdf",
Atmos. Chem. Phys. Discuss., 15, C5268–C5269, 2015, http://www.atmos-chem-phys-discuss.net/15/C5268/2015/: ==============
“Interactive comment on “Ice melt, sea level rise and superstorms: evidence from paleoclimate data, climate modeling, and modern observations that 2 ◦C global warming is highly dangerous” by J. Hansen et al.”
Author: N. Swedan, nabilswedan@yahoo.com Received and published: 27 July 2015
Again, the work presented in this paper is based on a climate computer model that
has incorrect physics. .The energy balance of these climate models is based on the radiative forcing approach of the so called greenhouse gas effect. This effect is a fiction
and the radiative approach violates the laws of thermodynamics . Colder atmospheric air “slabs” cannot radiate energy to warmer air “slabs” or surface.
Nabil Swedan ”
=================
So what are you saying now – that you, Nabil Swedan, who wrote and published the above, are not responsible for your public comments, and that you were not making arrogant claims discrediting ALL climate modelling using radiative forcing, and J. Hansen’s work in particular, based on your ….ignorance of the subject ? And now you dfenecd these arrognat, ignorant public claims as … “comments to ensure fairness and accuracy” ???? Whau.
Ladies and Gentlemen – Nabil Swedan!
P.S. Since you have disowned your own public comments and your arrogant attacks on others just because of the medium you used in these attacks (written and published on Internet) – why should we care about ANYTHING you write and publish on this website now?
P.P.S. If you didn’t want to be held accountable for you previous arrogant and ignorant claims, you should have used a made-up name, like, “Kobayashi Maru”, and pretend that it wasn’t you.
Paul Pukite says: “This is Nabiil Swedan’s work from circa 2013 onwards:
“This is a nonsense. There is no greenhouse gas effect; it is a fiction.”
Nabil Swedan said : “Paul: Professional and academic standards rely on official written and published work rather than conversational or outdated comments to ensure fairness and accuracy.”
Nigel: ” Out of curiosity, I asked an AI to summarise Swedans written work and list his research and provide some commentary on the research, which confirms what PP said and suggests his comments denying the greenhouse effect are far from outdated. as below:”
Summary of his research: Swedan attributes warming to the direct heat of carbon conversion, deforestation, and industrial thermal waste—while dismissing standard greenhouse gas radiation physics—his theories place him entirely outside the mainstream scientific consensus.
Swedan, N. (2022). “Thermodynamic Analysis of Climate Change.” Published in Entropy, 25(1), 72.
Significance: This is his primary published paper outlining his alternative model. It argues that carbon dioxide emissions return chemical energy to Earth’s surface as heat (via fossil fuels and deforestation minus surface greening) rather than using standard radiative forcing methodology.
Swedan, N. (2020). “Parameterization of energy cycles between the hemispheres.” Published in Science Progress, 103(2).
Significance: Focuses on thermodynamic hemispheric imbalances and attributes changes in tropical cyclone frequency to mechanical energy cycles between the hemispheres rather than atmospheric warming trends.
Swedan, N. (2019). “On the carbon cycle and its interactions with the biosphere.” Published in Russian Journal of Earth Sciences, 19.
Significance: Sets up his early mathematical arguments that interactions between the carbon cycle, human activity, and the biosphere can be mapped strictly through traditional macroscopic engineering thermodynamic equations.
Swedan, N. (2026). “Anthropogenic and Natural Forcings as Functions of Emission Time.” Available via ResearchGate Preprint.
Significance: Argues that current climate modeling holds a high degree of uncertainty because it misses “emission time” as an independent variable, attempting to mathematically dismiss natural variability for long-term projections.
Nigelj: “He’s probably hoping someone would list his research and give his junk science publicity. I don’t care. Its more important to expose his junk science. He certainly had KM fooled but that wouldn’t be hard. Of course if Swedan considers those papers outdated and has newer papers or writings that the AI missed , and which express quite different findings, perhaps he could enlighten us?
Paul Pukite says: “This is Nabiil Swedan’s work from circa 2013 onwards:
“This is a nonsense. There is no greenhouse gas effect; it is a fiction.”
Nabil Swedan said : “Paul: Professional and academic standards rely on official written and published work rather than conversational or outdated comments to ensure fairness and accuracy.”
Nigel says: ” Out of curiosity, I asked an AI to summarise Swedans written work and list his research and provide some commentary on the research, which confirms what PP said and suggests his comments denying the greenhouse effect are far from outdated. as below:”
Summary of his research: Swedan attributes warming to the direct heat of carbon conversion, deforestation, and industrial thermal waste—while dismissing standard greenhouse gas radiation physics—his theories place him entirely outside the mainstream scientific consensus.
Swedan, N. (2022). “Thermodynamic Analysis of Climate Change.” Published in Entropy, 25(1), 72.
Significance: This is his primary published paper outlining his alternative model. It argues that carbon dioxide emissions return chemical energy to Earth’s surface as heat (via fossil fuels and deforestation minus surface greening) rather than using standard radiative forcing methodology.
Swedan, N. (2020). “Parameterization of energy cycles between the hemispheres.” Published in Science Progress, 103(2).
Significance: Focuses on thermodynamic hemispheric imbalances and attributes changes in tropical cyclone frequency to mechanical energy cycles between the hemispheres rather than atmospheric warming trends.
Swedan, N. (2019). “On the carbon cycle and its interactions with the biosphere.” Published in Russian Journal of Earth Sciences, 19.
Significance: Sets up his early mathematical arguments that interactions between the carbon cycle, human activity, and the biosphere can be mapped strictly through traditional macroscopic engineering thermodynamic equations.
Swedan, N. (2026). “Anthropogenic and Natural Forcings as Functions of Emission Time.” Available via ResearchGate Preprint.
Significance: Argues that current climate modeling holds a high degree of uncertainty because it misses “emission time” as an independent variable, attempting to mathematically dismiss natural variability for long-term projections.
Nigelj: “He’s probably hoping someone would list his research and give his junk science publicity. I don’t care. Its more important to expose his junk science. He certainly had KM fooled but that wouldn’t be hard. Of course if Swedan considers those papers outdated and has newer papers or writings that the AI missed , and which express quite different findings, perhaps he could enlighten us all?
Nigelj says 11 Aug 2026 at 4:10 PM
Paul Pukite says: “This is Nabiil Swedan’s work from circa 2013 onwards:
“This is a nonsense. There is no greenhouse gas effect; it is a fiction.”
Nigel: ”” —his theories place him entirely outside the mainstream scientific consensus. ”
KM : An apostate is a person who has completely given up or rejected their religious faith, a political party, or a specific cause they once believed in and supported.
Nigel Jones is an admitted climate science denying Apostate. Nigel Jones changed his mind and beliefs about the topic long ago.
Should I deploy my own AI to track down his public comments which were anti-global warming, his disbelief in climate science formerly held by Nigel Jones before 2013 and re-post them here too?
Do people change their opinions about things Nigel Jones?
And will Nigel Jones and Paul Pukite and Piotr xxxxxx CA retract their ad hominem attacks, their gratuitous innuendos and admit the topic being discussed here was Nabil Swedan’s peer reviewed paper published in 2026 ?
Of course they will not. Performative tribal anti-denier drama is what maintains this forum now.
It should be obvious to anyone professional enough to read Nabil’s paper that it contains nothing contrary to the basic science of AGW and it’s impacts. There is no evidence in the paper’s abstract or description that suggests he rejects established climate science norms or the reality of anthropogenic global warming
What the Paper Actually Argues
The paper’s central argument seems to be a proposal of a new physical mechanism for ENSO, rather than a denial of climate change:
Challenging Established Theory: It critiques the traditional view of ENSO as a “self-sustaining system,” arguing it’s thermodynamically unrealistic because it lacks an external energy source. This is a scientific argument about the physics of ENSO, not a denial of global warming.
Acknowledging External Forcing: The paper explicitly states that the “external energy source” is the “hemispheric asymmetry in sea surface warming”. This directly links the ENSO mechanism to a global warming trend.
Connecting to Anthropogenic Warming: The paper’s core prediction is that as this hemispheric warming imbalance intensifies, the frequency of El Niño events and related climate extremes will increase. This is a prediction of future impacts consistent with mainstream climate projections.
In fact, the paper appears to align with established climate science. The abstract explicitly acknowledges a human role by stating that the intensifying “hemispheric imbalance in surface warming” is a trend that “may potentially be attributed to anthropogenic influences” and says this “warrants further investigation”
Genuine science philosophy and methodology proponents would not be making the unfounded claims allegations made by others above. They be addressing the Data and Reasoning within the published paper itself.
in Re to Nigelj, 11 Aug 2026 at 4:10 PM,
https://www.realclimate.org/index.php/archives/2026/07/this-new-el-nino-is-different/#comment-850391
Hello Nigel,
I read the “primary published paper outlining his alternative model” and the sheer absurdity of its publication in a “scientific” journal inspired me to the following AI prompt:
“Would you call extreme examples of junk science published in journals pretending seriousness, e.g. a relatively recent article
https://pmc.ncbi.nlm.nih.gov/articles/PMC9857689/pdf/entropy-25-00072.pdf
treating Earth as a closed system in terms of classical thermodynamics (and on this basis deriving a “scientific” disproval of current climate science) that – despite of this fundamental flaw – was not recognized by referee(s) and editor(s) of the publishing journal “Entropy” as total bullshit, “pataphysics”?”
Two checked AI engines admitted that this label might work as a satirical metaphor, however, they also add following warnings:
“While the comparison is poetic, there is one major difference in intent:
– True Pataphysics requires self-awareness. Alfred Jarry and his followers knew they were engaging in a brilliant, satirical joke to mock human arrogance and scientific dogmatism.
– Junk science lacks irony. The authors of ideologically driven or fundamentally flawed climate papers usually take themselves entirely seriously. Their goal is not artistic satire, but to manufacture doubt or exploit cracks in the commercialized scientific publishing system.”
“Calling it “‘pataphysics” actually gives the author and journal too much credit—it implies a level of witty, self-aware artistic performance that simply isn’t present.”
I encourage you to run a similar prompt on any decent AI tool yourself and enjoy the provided analysis (or analyses) in its (their) entirety.
Greetings
Tomáš
Hello Tomáš Kalisz,
I have read the paper again, and there is no mention of “alternative science.” There is only a thermodynamic methodology equivalent to the concept of radiative forcing. In fact, the paper demonstrates this equivalence based on both theory and observations.
With all due respect, the Earth exchanges only energy with the surrounding outer space, while the exchange of matter is negligible. Therefore, by definition, the Earth is a closed thermodynamic system.
Multitroll, “Kobayashi Maru”:
will Nigel Jones and Paul Pukite and Piotr xxxxxx CA retract their ad hominem attacks, their gratuitous innuendos and admit the topic being discussed here was Nabil Swedan’s peer reviewed paper published in 2026 ?
Maybe your topic. We, on the other hand, are interested in the scientific integrity of the author. And for a very practical reason – if he can’t bring himself to admit of being wrong in the past, even in such an OBVIOUSLY WRONG attacks on Hansen and climate modelling (“ has incorrect physics” “the so called greenhouse gas effect is a fiction”,
“the radiative approach violates the laws of thermodynamics”) then how can we trust ANYTHING that comes from his mouth, particularly if his fallacies may not be AS OBVIOUS as in his attacks on Hansen. If a tree bore poisonous fruit in the past, would you reach for the fruit next year, hoping the tree changed its nature?
And why would we care about anything he posts on Real Climate about his 2026 paper – when he takes NO responsibility for ANYTHING he has posted publicly on Internet – defending his attempts to discredit Hansen and climate model, he based on his staggering ignorance, as supposedly done, wait for it. “to ensure fairness and accuracy ;-)
And implying that his Internet attacks on Hansen were merely “ conversational” and as such INCONSEQUENTIAL – because he takes responsibility ONLY for his “ published [in scientific journals] work“.
So why waste time on the guy posts on RC, when takes no responsibility for his words on RC?
P.S. I suggested he should used have YOUR way to avoid responsibility for earlier opinions – posting under made-up, and constantly changing, name.
KM: “Should I deploy my own AI to track down his public comments which were anti-global warming, his disbelief in climate science formerly held by Nigel Jones before 2013 and re-post them here too?”
You can if you want. I was sceptical about anthropogenic climate change for a short period, but I cant remember when exactly, maybe around 2000. I’ve mentioned it a couple of times possibly on this website. You can waste time looking with an AI if you want. Youre good at wasting time. The thing is I accepted we are warming the climate through an enhanced greenhouse effect a long time ago.
KM: “And will Nigel Jones and Paul Pukite and Piotr xxxxxx CA retract their ad hominem attacks, ”
No because there weren’t any by me. Show me where disparaged Swedan on the basis of his qualifications. That will be amusing because I never mentioned them. I think he has an engineering degree but Im not sure.
KM: “The abstract (Swedans paper on el nino) explicitly acknowledges a human role by stating that the intensifying “hemispheric imbalance in surface warming” is a trend that “may potentially be attributed to anthropogenic influences” and says this “warrants further investigation””
So what? That proves nothing. Swedan claimed theres no such thing as the greenhouse effect. We showed you ample proof of that in research papers, And some are quite recent.
His el nino paper talks about anthropogenic influences. Those dont have to be influences that cause an enhanced greenhouse effect. He could be talking about completely different anthropogenic influences and causal mechanisms. Judging by his other recent research, he thinks global warming is caused by burning fuel heating up the atmosphere directly. Thats anthropogenic.
Its really simple. I asked him to show us a paper demonstrating he has changed his mind. So far he hasn’t. Alternatively he can clarify whether he now accepts the greenhouse effect, and that humans are warming the climate by increasing the greenhouse effect. I’ll wait.
KM says:
This is rich. hemispheric asymmetry in sea surface warming is also known as seasons. It is well known that ENSO has a seasonal lock. This paper goes back to 1994
Tziperman, E., Stone, L., Cane, M. A., & Jarosh, H. (1994). El Niño–Southern Oscillation as a frequency-locked response to the seasonal cycle. Journal of Climate, 7(12), 2035–2048.
more recent:
Stuecker, M. F., Timmermann, A., Rebert, S., Chikamoto, Y., Widlansky, M. E., Ziese, A., … & Jin, F.-F. (2013). Annual ENSO phase locking and the combination tone hypothesis. Nature Geoscience, 6(12), 1075–1079.
Tziperman et al. demonstrated that the seasonal cycle acts as an external periodic forcing that entrains (frequency-locks) the inherently irregular ENSO oscillator. This proved the seasonal cycle is a necessary causal component for explaining why ENSO events consistently peak during boreal winter. The concept is that a nonlinear resonance between the ocean-atmosphere coupled mode and the annual harmonic, provides the physical mechanism linking seasonality to ENSO dynamics.
Swedan can only train his model to follow at best 2 cycles of ENSO at a time, which is pretty pathetic. These are his charts — likely cherry-picked to focus on short intervals
https://imagizer.imageshack.com/img924/3222/SxCsqK.jpg
The missing piece is if it was ONLY a seasonal cycle that synchronized ENSO, then we should be able to predict ENSO more reliably.
Alas, another synchronizing feature is at play, which is not yet established as consensus. My idea is that tidal forces play a role here. A tidal hypothesis is not an alternative to Tziperman/Stuecker, but as the complementary forcing required to close the predictability gap. Any tidally-induced vertical mixing modulates the thermocline depth and heat content, effectively altering the background state upon which the seasonal cycle acts.
Brandolini’s Law may apply to Swedan’s paper as well — “The amount of energy needed to refute BS is an order of magnitude bigger than to produce it.” He has so many layers of tautological claims, likely produced by AI, which hide the fact of how empty his claims are. Ultimately, Swedan’s “hemispheric asymmetry” is defined by the phenomenon it claims to explain.
Nabil Swedan: “there is no mention of “alternative science.” There is only a thermodynamic methodology equivalent to the concept of radiative forcing.
So you published a methodology that is equivalent to the very concept that you yourself attacked as “violating the laws of thermodynamics” and producing effect that … “is a fiction”?
See:
========Atmos. Chem. Phys. Discuss., 15, C5268–C5269, 2015 ======================
” [Hansen’s] climate model is based on the radiative forcing approach of the so called greenhouse gas effect. This effect is a fiction and the radiative approach violates the laws of thermodynamics”
Nabil Swedan
=============================================================================
And if you really can explain things without balancing the radiation budget – how is your “exchange energy with the surrounding outer space” supposed to work?
You can’t exchange the energy associated with the matter since “the exchange of matter is negligible”, and the radiative fluxes are not needed in your alternative explanation, so – HOW?
Nabil Swedan: “ I have read the paper again, and there is no mention of “alternative science.””
That’s like reading a paragraph from Sky News:
====
“In a 2002 New York Magazine interview, Donald Trump described Jeffrey Epstein as a “terrific guy” who was “a lot of fun to be with”. He famously added: “It is even said that he likes beautiful women as much as I do, and many of them are on the younger side””
===
and defending Trump that at the time he knew nothing about Epstein being a pedophile, because “ in these quotes Trump does not use the word “pedophile” .”
If you question climate science for using “incorrect physics.”, call “the so called greenhouse gas effect – a fiction” and say that climate science using the radiative budgets “violates the laws of thermodynamics” – and then you propose your solution that is presumably free of these problems – then you do offer “alternative science”, whether you use the phrase “alternative science.” or not.
A rose by any other name would smell as sweet…
in Re to Nabil Swedan, 1 Aug 2026 at 3:16 PM,
https://www.realclimate.org/index.php/archives/2026/07/this-new-el-nino-is-different/#comment-850231
Dear Sir,
I summarized my doubts about your article in the following prompt for the AI engine Gemini Thinking:
“Could you read the attached pdf file and assess if the article provides a physically consistent explanation how the observed atmospheric and oceanic heat transport across the equator, with a clear annual periodicity, transforms into temporally irregular ENSO cycles?
To me, it remains furthermore completely unclear, even after reading the article twice, how the asserted heat engine allegedly working between the hemispheres gradually storages heat in the Pacific during the La Nina phases, to stop this activity (and let the storaged heat release) during the El Nino phases. Is there any clear explanation for this mechanism that I have missed in the attached text?”
I am not going to spoil this website with the entire analysis provided by the machine. Its conclusion, however, reads:
“You did not miss any hidden mechanism in the text. The paper dismisses established ocean-atmosphere coupled dynamics and replaces them with a 1D mechanical spring-damper equation applied to atmospheric air mass. It achieves a visual match with historical ONI data not through a physically self-consistent heat engine, but by parameterizing and curve-fitting an empirical sinusoidal decay function to observed multi-year dates.”
In this respect, it appears that the AI engine did a better job and provided more valuable feedback than both the referee who recommended your article for publication in the Discover Atmosphere journal as well as their editor who approved it.
Please consider that a subscription for any decent AI model might save you the effort and money invested into preparation of such poor-quality articles and prevent you from reputation damages caused by their publication.
Best regards
Tomáš
I’m also an engineer dabbling in climate science way above my pay grade (which is currently sitting at zero in disability/retirement)
I guess I didn’t do too badly. Grok praised my own amateur model where I linearly regress and remove modal oscillations from SST as innovative and promising (paraphrased).
Then again, it was Grok ;-/
Maybe I can convince Gemini to continue my investigation past my own boundaries. That might be a productive use of AI and faster than learning PostGreSQL/Octave.
Somehow though I think I’ll end up paying for hallucinations at some point. Psilocybin gets me there faster and with more fun.
Plus it’s supposed to cure depression instead of talking me into killing myself for being such a failure.
What’s the vote? All in favor of psilocybin, say…wooooow.
CFMIP participation is rapidly closing. Perhaps mid August if I read the home page. Perhaps early September if I read the registration page. Either way, soon.
The attribution of the recent energy imbalance trend is unsettled and I expect the panel blocks, open-floor question periods, and any attached workshops may teach a great deal. The first CMIP7 DECK diagnostics should be circulating by then (October.) It is the floor debates that instruct. Not settled outputs or summaries, which teach little or nothing at all. Hearing the objections and the resulting informed arguments is another matter entirely.
I can’t travel to Taipei but could follow some of CFMIP 2026 remotely, either by live stream or by recordings made available afterward. Either would serve equally; I’ve no need for promptness. Months of delay is fine. (I’m also willing to pay a full registration fee, if needed, and I’m hoping for venue mixer output and not the laptop microphone at the podium for audio.)
I am retired now but these kinds of arguments have been among my more valued experiences over my own working life. And I’m still trying to maintain a modest learning pace.
Anyone here know how this goal may be approached for the upcoming CFMIP 2026 in Taipai?
Just a follow-up on my comment about CFMIP 2026 in Taipei. Reading it back I feel it may have left the impression I’m looking more towards venues than is true. (That venue holds promise. Don’t get me wrong on that!) I’m less about venues per se and more about debate formats I sorely miss in retirement: sustained adversarial exchange on proposed hypotheses.
A good model example, if it helps, was a session at the 2014 AAAS annual meeting where Dr. Jennifer Francis presented on her ideas about the jet stream. But I can no longer travel, so I’m looking for long format; 90+ minutes and even hours, if it comes to that. And positions put into the fire of debate. That heat is where I learn. Fifteen-minute talks with three minutes of questions do not get me there.
An example from this site (makes me wistful) is Ringberg15. A week at Schloss Ringberg with folks from different lines of thought — presentations and moderated discussions. Nic Lewis and James Annan with Dessler, Forster, Gregory, Sherwood, Mauritsen, & Zelinka. The discussions are long gone, so far as I can tell, and are sorely missed. Slides, board photographs, and a report is available. But that isn’t how I learn from others. I learn by seeing *how* my betters think about the world. Not how they conclude.
(Gavin Schmidt ran Climate Sensitivity Week here while the workshop was underway [1]. And I believe there may have been a suggestion from Annan at the time that video conferencing may enable wider access without the travel.)
What had sparked my earlier comment was thinking about CFMIP 2026 and the first CMIP7 DECK diagnostics circulating around this autumn. I saw that CFMIP asked, during the Fast Track consultation, that the abrupt CO2 runs go to a minimum of 300 years rather than 150, reasoning past ECS quantification into the pattern effect and the temperature dependence of feedbacks. That request is now the DECK text in Dunne et al. I wrote immediately. But perhaps a little too quickly.
To add, then:
Has anything moved this last decade on Annan’s suggestion in 2015 to make wider video access happen? For example, Stevens convened a group at the same castle this March on hypotheses for the growing TOA imbalance. And I just can’t find anything exposing engaged debates that I believe took place.
That is the kind of thing to watch unfolding, hearing active minds engaged and thinking about the world, than left merely to read about it later as “conclusions sans process-getting-there.”
So, to broaden the earlier comment, is there anything between now and mid-2027 that is both long-form adversarial on climate sensitivity and open in some form I may reach as a viewer-only?
—
[1] G. Schmidt, “Climate Sensitivity Week,” RealClimate, 23 March 2015.
https://www.realclimate.org/index.php/archives/2015/03/climate-sensitivity-week/
JK : It is the floor debates that instruct.
aka how consensus is arrived at. among small isolated pockets of players who get inside the room talk and decide – ie Vote on what is acceptable and what is not. Then the sausage factory does it’s work. A couple of years later the CMIP7 informs what’s included in the AR7 another consensus boondoggle of a few elite invitees.
Rinse repeat.
This is only one way to “spin it”. There are others. Zeke spins it very well. He’s one of the elite invitees. A professional corporatist with real “skin” in the game. ie owns a share of the corporation doing “paid work” in the field of “climate science marketing and projects”. call it what you will. Anyone can look this up for confirmation of what it is, or isn’t. Don’t believe me or dismiss me without looking first hand. Google / AI may well be “evil” but it still works, for now.
JK : It is the floor debates that instruct.
KM: aka how consensus is arrived at. among small isolated pockets of players who get inside the room talk and decide – ie Vote on what is acceptable and what is not. Then the sausage factory does it’s work. A couple of years later the CMIP7 informs what’s included in the AR7 another consensus boondoggle of a few elite invitees.
BPL: No, that is not how the scientific consensus works. It is NOT a vote. The scientific consensus arises when many lines of evidence all point to the same conclusion. No one ever took a vote on the heliocentric model, or the theory of evolution, or quantum mechanics.
Stop spreading misinformation.
So according to KM, Zeke has skin in the game. So does James Hansen, according to an AI:
“Although James Hansen does not hold any personal commercial stakes or equity investments in companies that profit from climate technologies, he does earn income from academic employment, book royalties, legal consulting, and speaking engagements tied directly to his work as a climate scientist. ”
So Hansen has skin in the game as well. Although its not on level of holding shares in a company, its definitely skin in the game. But people generally have to divulge financial interests if they become a conflict of interest. So I wouldn’t be worried too much about ether person.
Decisions in our society are often make by small groups experts, and this appears to trouble you (?).
Decisions are made by small groups of experts because they are the most qualified and it is efficient. You seem to propose wide public involvement in decision making processes, by having a vote on everything. That would make the whole IPPC process incredibly time consuming. It would grind to a halt. And with numerous unqualified people involved outcomes may be worse.
The problem with decisions made by small groups of experts is potential group think and dismissal of valid public concerns. We counter this with the democratic political system which means the most important decisions in society are made by governments and we can choose what parties are in government. There are sometimes public referendums for key issues. But you cant do that for everything, because you would need hundreds of referendums every day so its not practical. Our society would grind to a halt.
You appear to be concerned that Hansen isnt involved in the consensus decision making (?). But presumably theres nothing stopping him volunteering his time to be involved in the IPCC process. And his studies will be scrutinsed by the IPCC anyway.
You seem to be suggesting that small cabal of scientists like ZH and MM meet to decide “important things” (?) Wheres your evidence for that?
I think you may be reading too much into things. In any group of experts there will be like minded people and others on the fringes. It doesn’t necessarily mean those on the fringes are being deliberately excluded. or badly treated. I don’t see that you have shown Hansen is being deliberately excluded. The mainstream just don’t accept all of his views. And they are not obliged to. They may ultimately be proven wrong, and Hansen proven right, but people will disagree and you cant change that. Disagreement is not corruption of process.
A real world comparison of human and AI online support
Yesterday I signed up for an AI-Pro subscription to Google’s Gemini LLM. The cost in Norway is 259 NOK per month, which is also what I pay for my ChatGPT subscription.. 259 NOK is about $25. ChatGPT has been very useful, and now I want to compare the two systems.
Like ChatGPT, Gemini can run as a web app in my Safari or Chrome browser, or as a standalone native app in macOS. I downloaded and installed the native macOS app, started the app, and logged in. I had already bought the subscription at google.com. I wanted to be sure I was getting the AI-Pro subscription I had paid for, so I searched through all the settings of the app to find account details. It wasn’t there.
I then asked Gemini how I could find my account details, but I didn’t explain why. Gemini told me how I could do it in the web Gemini in my browser.. Gemini said that the native macOS app had been stripped of all nonessential functionality to make it as efficient as possible.
So I logged in to Gemini in my browser and found the account details using the instructions that the native Gemini had provided. In the browser, Gemini was indeed giving me the service I had paid for. But that didn’t prove the native Gemini app was providing the same level of service. They are separate processes.
So, since I was already logged in to Google in the browser, I opened a realtime help chat with the Gemini support team. It appeared at first that I was connected with a real person. By then I had used the native Gemini app for about an hour, and I had the suspicion that it was using the free Google AI level of Gemini, which I had been using quite a lot. I explained to the help guy that I wanted to verify that my native Gemini app running on magOS was giving me the AI-Pro level of service that I had just paid for. I explained that the account details are nowhere to be found in the native Gemini app.
The help guy said “Thank you for using Google products. How can I help you?” So I cut and paste the explanation I had already entered. He said, “Let’s see if we can figure this out. Can you send me a screenshot of the issue?”
I said, “I can’t send you a screenshot of the issue, because the issue is it is not on the screen.”
He said, “I understand, but I really need you to send me a screenshot of the issue.”
I said, “No, you don’t understand. I can’t send a screenshot of the issue because the issue is not on the screen.”
He asked for a screenshot again. I said, “Are you a real person, or are you AI?”
There was a long pause. Then he said, “I am a real person.”
So I made a screenshot of the Gemini app window and sent it to him. After another pause, he said, “Thank you for sending that screenshot.” I knew that he knew that the screenshot was useless. He then read me the exact same instructions the Gemini app had given me earlier for viewing my account details in the Gemini web app. I explained I had already done that, and the web app is indeed using the correct subscription level, but that gives me little confidence that the native app is using the same level of service because it appears that the native app is NOT giving me that level of service.
The pause went on too long, so I terminated the help session and di what I should have done in the first place. I went back to the native Gemini app and explained to Gemini why I wanted to see my account details in the app. Gemini said, almost without hesitation, “There are two ways you can verify that the app is giving you the correct level of service…”
Long story short, it instructed me to look at the right end of the box where I enter the text. There I would find the name of the AI model being used. I was to click on that name and see the list of all the models that were available to me. I did that and saw that it was currently using the version 3.5 of the Flash model, which is a step above the free service model, but way below the Pro model. I also saw that version 3.1 of the Pro model was available to me.
I reported this to Gemini and Gemini said, “That proves you are getting the AI-Pro service you paid for.”
It took all of 30 seconds to get my answer. I asked Gemini why the support guy didn’t tell me to look there. Gemini explained that the support guys are trained to follow a script and to stick with the script no matter what.
I told Gemini I had asked the support guy if he was a real person or AI. Gemini sympathized and said, “It’s ironic, isn’t it?”
El Nino is very old (The El Nino/La Nina Chronicles – 6)
RELOCATING my reply to Nabil Swedan 8 Aug 2026 at 10:40 PM
https://www.realclimate.org/index.php/archives/2026/07/this-new-el-nino-is-different/#comment-850340
… away from the noise.
Nabil, thank you for your reply. I want to make sure I understand the ‘low spot’ correctly in regards to your Pt 3.
Reading your paper, my understanding was that the “low spot” is a north-south phenomenon: the Southern Hemisphere warms faster, expands more, and the tropical Pacific becomes a relative depression between the two bulging hemispheres. This was the primary forcing in the ENSO cycle your paper alluded to.
Hemispheric warming asymmetry affects these gradients—warming changes the baseline sea-level difference from north to south. The low spot creates a sea-level gradient (predominantly in the South Pacific region) that increases with warming, affecting ocean heat content and movements.
The warm water piles up in the western Pacific (Indonesia) due to trade winds. This is the standard ENSO setup—when winds weaken, the warm water sloshes eastward and piles up against Central/South America (the barrier). This is the typical piling up of an El Niño event that’s well documented.
But in your reply, you mention the Pacific-Atlantic sea-level difference (~20 cm at Panama Canal) and how hemispheric asymmetry might have decreased it by ~0.5 cm. That seems like an east-west hemisphere gradient, not north-south.
So my question is: Are these two different phenomena? Or is the “low spot” a combination of both? I want to make sure I’m following the physics correctly.
And to be clear, my original question 3) was: Is the “low spot” mechanism testable with current observational data (e.g., sea level anomalies)?
I’m interested in knowing whether the data exists that records the actual sea levels within the ENSO equatorial region of the South Pacific—showing that the sea-level “low spot” exists and follows the asymmetrical pattern you describe in your paper, and that it mirrors the arrival of an El Niño event.
Maybe I have that wrong—please clarify. My assumption from your paper was that one could predict the imminent arrival of an ENSO event based on shifts in sea level asymmetry, and potentially also predict the extent of a coming El Niño based on how “extreme” the “low point” was likely to be.
Thanks—looking forward to your reply.
Sorry KM for missing your comment. Your understanding is generally correct, but I would like to clarify my reply in point 3.
The low spot visible in seasonal variation is caused by latitudinal temperature gradient at the hemispherical level. High latitudes warm faster than low latitudes, and this applies to both hemispheres, Also, this is true for global warming. Therefore, equatorial basin thermal expansions are least and they become low spots.
In the case of seasonal variation, the low spot is temporary and reversible every season. However, climate change should create a permanent low spot in the tropics, where warm water accumulates with time.
Regarding the 20 cm difference between the Pacific and Atlantic, this is the hydraulic driving force of water flow at surface from south to north, similar to river flow. The uneven warming between the hemispheres has decreased the driving force by nearly 0.5 cm or 3 percent, meaning that the flow of warm water (solar heat in origin) from south to north has decreased by the same percent. This has nothing to do with tropical low spots. It is an overall reduction in hydraulic driving force and warm water flow from the large surface area of the southern hemisphere to that of the northern hemisphere. This reduction in warm water flow that accumulates as heat in the tropics. The heat is solar energy anomaly, external energy, that drives ENSO.
However, the order of magnitude of the permanent low spot is of the same order of magnitude of the reduction in driving force, 0.5 cm or smaller. I provided this information for those readers interested in deep evaluation of the phenomenon. When completely analyzed, warm water accumulation in the permanent low spot has sufficient hydraulic head and time to accumulate in the tropics.
Please let me know if more clarifications are needed
Someone else will have to respond via PubPeer criticism to the Swedan paper as the moderator is not allowing me to counter his response to my original comment. The rejected comment is reproduced here:
https://github.com/orgs/azimuth-project/discussions/26
Nabil Swedan has a history of publishing these absurdly argued papers and the only way to curb his output is to force publishers to retract or not publish them. It’s unfortunate that my comment is not allowed while his rubbish stands.
Nabil Swedan says 14 Aug 2026 at 1:52 PM
Nabil, thank you again for the clarification—but I need to be clear. I asked three specific questions:
Is there sea-level data showing the “low spot” exists in the equatorial South Pacific?
Does the low spot follow the asymmetrical warming pattern and precede El Niño events?
Can we predict El Niño timing or intensity from shifts in this low spot?
Your response did not answer any of these. Instead, you restated the theoretical mechanism (high latitudes warm faster ‘forces’ equatorial basins become low spots). Introduced a separate phenomenon (Pacific-Atlantic sea-level gradient, driven by north-south flow) that’s indeterminate. And again you described what should happen, without citing any observations that it does happen.
The Pacific-Atlantic gradient is interesting, but it’s not what I asked about. I asked about the equatorial South Pacific “low spot”. The mechanism your paper hinges on as the storage location for the external heat that drives ENSO.
My concern is this: Your paper presents a physically ‘plausible mechanism.’ But it does not appear to provide the observational evidence needed to confirm that the “low spot” actually exists, that it accumulates heat over time, or that changes in it precede ENSO events. Or even that it has sufficient force to generate ENSO events.
This matters because without that data, the mechanism remains an interesting hypothesis and not yet a tested one. The thermodynamic argument is compelling, but it needs empirical support to move from plausible to established. I’d need to see the data to be convinced.
Given the data doesn’t appear to exist, I’m no longer interested in pursuing this line of inquiry.
Thanks for engaging.
Hello KM,
Thank you for the comments. They are good subjects for research papers.
(1) “Is there sea-level data showing the “low spot” exists in the equatorial South Pacific?”
Reply: for seasonal variation, data is available. What researchers will find that seasonal sea level barely fluctuate in the southern and tropical oceans, but it fluctuates wildly in the northern hemisphere. This is a visible low spot in sea level.
Unfortunately, we cannot measure the small low spot caused by global warming, but we see it during every El Nino event. A good book on the subject is reference 1. Caviedes (2001) describes how El Nino heat evolves in the equatorial basins: “warm water travels on ocean surface like a slick of oil.” It travels eastward when trade winds weaken or substantially degraded. This description is a sign of low spot, that simply cannot be contested.
(2) “Does the low spot follow the asymmetrical warming pattern and precede El Niño events?”
Reply: I have no answer for this question at this time.
(3) “Can we predict El Niño timing or intensity from shifts in this low spot?”
Reply: El Niño timing and intensity can be reasonably predicted by knowing the trend of the difference in marine temperature between the hemispheres.
The theoretical analysis of the low spot caused by global warming show that it is low enough to drive the flow of warm water to the tropics on time.
End of reply
in Re to Nabil Swedan, 16 Aug 2026 at 12:34 PM,
https://www.realclimate.org/index.php/archives/2026/07/this-new-el-nino-is-different/#comment-850504
Dear Swedan,
If “The theoretical analysis of the low spot caused by global warming show that it is low enough to drive the flow of warm water to the tropics on time.”,
can we see it?
Best regards
Tomáš
A note on the conversation here.
I’ve noticed a pattern in this thread. I asked Nabil specific questions about his mechanism and the supporting data. Instead of engaging with those questions in good faith—instead of focusing on the actual content being discussed—both Nabil and I have been mislabeled, dismissed, ridiculed, and personally attacked over nothing at all.
That’s not how scientific discussions usually work.
Science inquiry is supposed to be about asking hard questions. It’s about seeking out the evidence, observations, and data. And it’s about testing hypotheses—especially the uncomfortable ones.
I did not reject nor dismiss Nabil’s paper out of hand because I didn’t understand it at first or didn’t believe it. Instead, I asked pointed questions about it. I was testing it. I read it in full. I followed the logic. I asked where the data is. That’s what honest inquiry is supposed to look like. That’s all that needed to be done.
The rest of what’s happening here and on Pubpeer has felt like unnecessary, emotionally driven fluff to me.
If the paper holds up, great. If it doesn’t, we learn something. Either way, the process is healthy. What’s not healthy is dismissing questions and published papers as “denial” just because they challenge a consensus or a preferred narrative.
I’m here to engage with the science. I refuse to belong to any tribe or gang because I am not on anyone’s side. If anything I’m on the side of evidence and where it naturally leads.
KM frowns on the discussion regarding Swedan’s multiple papers because it is too harsh. Simple fix — prompt your facorite LLM (ChatGPT, Claude, Gemini, etc) to evaluate any Swedan paper and watch how it responds. Warning: it’s not flattering to Swedan.
” Kobayashi Maru” : Instead of engaging with those questions in good faith
Come again? You, Multi-troll, who posted on RC under dozens of different names, a guy notorious for not answering even direct questions from others and routinely dismissing falsifiable arguemnets as ad-hominem attacks – you lecture _us_ on “engaging in good faith”. Good one!
As for your Nabil Swedan – the papers are only as credible as their authors. By their fruits you shall know them
” The work [ of J. Hansen et al.] is based on a climate computer model that has incorrect physics.. The so-called greenhouse gas effect is a fiction. The radiative approach violates the laws of thermodynamics.” Nabil Swedan
Or see Swedan’s 2020 paper in … Acta Ecologica Sinica https://www.sciencedirect.com/science/article/pii/S1872203219302641
I must say – this is the most cringeworthy piece of scientific writing I have ever seen:
– at the basis of Swedan’s “analysis” is a staggering ignorance – Swedan claims that Earth is warming by the “heat of carbon conversion to carbon dioxide”, while a simple calculations on the back of the envelope (see my parallel post) shows that this heat of “conversion” is 10 BILLION TIMES TOO SMALL to explain the current warming
– then there are bizarre “results” based on the … loose correlation between variables that are only only indirectly related [population size and deforestation rate] – leading Swedan to predict Earth population to approach 14.5 billion by the year 2100”
Most demographers, including the UN Population Division, projects it NOt at 14.5 billion, but around 10 billion (the growth rate has been dropping since early 1960s and there is no reason to assume that from now on it … will stay constant at its pre-2020 levels.
– and based on these “results” – come the Earth-shattering conclusions of the type:
“ Warming of the surface and population growth are thus processes that depend on land clearing and conversion into farmland. If deforestation increases, the size of the farmland increases, population size increases, and the surface accumulates heat and vice versa.
Gee, Nabil. nobody saw this coming,
And after discovering that “greenhouse effect is a fiction”, Hansen’s climate model “has incorrect physics” and the radiative budget ” violates the laws of thermodynamics”, and disproving projections of modern demography – our Chemical Engineer took a shining to ENSO, using his chemical engineering understanding of oceanography and vocabulary to …. invent the wheel,
as a triangle-shape made of wood, while physical oceanographers have been zooming on their circular wheels with inflated tires for decades.
By their fruits you shall know them. And if you can’t see that your Nabil Swedan is a Hochstapler, so vain that he thinks that as a chemical engineer – he has been able to see what generations of climate scientists, oceanographers and demographers failed, and if you demand that we ignore his previous ignorant and arrogant publications and public comments he never owned up to – that’s not on him, but on you, KM.
in Re to Piotr, 17 Aug 2026 at 11:25 PM,
https://www.realclimate.org/index.php/archives/2026/07/this-new-el-nino-is-different/#comment-850527
Hello Piotr,
“Kobayashi Maru” a week ago, 12 Aug 2026 at 7:55 PM,
https://www.realclimate.org/index.php/archives/2026/07/this-new-el-nino-is-different/#comment-850419 :
“About https://pmc.ncbi.nlm.nih.gov/articles/PMC9857689/pdf/entropy-25-00072.pdf or https://doi.org/10.3390/e25010072 Author Swedan, N.H. 2022
Direct Answer: No, This Is Not “Climate Science Denial”
Based on my reading of the full paper, it does not deny climate science. In fact, it:
Explicitly accepts that the Earth is warming
Explicitly accepts that human activity (fossil fuels, deforestation) is the primary driver
Attempts to quantify the warming and its impacts (temperature rise, sea level rise, stratospheric cooling)
Uses the IPCC’s own data for comparison and validation
This is not denial. It’s a heterodox scientific proposal — a challenge to the mechanism (radiative forcing vs. thermodynamic forcing), not to the reality of anthropogenic warming.”
It is funny to compare this vigorous defence of Nabil Swedan’s fundamental 2023 article (that is in its entirety based on an absurd assumption that Earth can be treated as an isolated thermodynamic system) with KM’s significantly less enthusiastic comment on Nabil’s response to KM’s own questions directed to Nabil’s recent article about ENSO.
See “Kobayashi Maru”, 15 Aug 2026 at 8:25 PM,
https://www.realclimate.org/index.php/archives/2026/07/this-new-el-nino-is-different/#comment-850489 :
“Nabil, thank you again for the clarification—but I need to be clear. I asked three specific questions:
Is there sea-level data showing the “low spot” exists in the equatorial South Pacific?
Does the low spot follow the asymmetrical warming pattern and precede El Niño events?
Can we predict El Niño timing or intensity from shifts in this low spot?
Your response did not answer any of these. Instead, you restated the theoretical mechanism (high latitudes warm faster ‘forces’ equatorial basins become low spots). Introduced a separate phenomenon (Pacific-Atlantic sea-level gradient, driven by north-south flow) that’s indeterminate. And again you described what should happen, without citing any observations that it does happen. … Given the data doesn’t appear to exist, I’m no longer interested in pursuing this line of inquiry.”
A quick end of a romance :-)
Greetings
Tomáš
Tomáš Kalisz says 19 Aug, quoting K. Maru about Nabil Swedan:
K. Maru: Direct Answer: No, This Is Not “Climate Science Denial ”
it could be instructive to analyze the mechanism of manipulations by N. Maru so one can inoculate oneself against them:
1. Confirmation bias -“you don’t look a gifted horse in the mouth” – so as long as it could be spun as discrediting of IPCC/Climate science – K. Maru had no problems with Swedan’s claims that “the so-called greenhouse effect is a fiction” and radiative forcing “violates the laws of thermodynamics”
2. Moving the goal posts – in the span of couple of lines K. Maru changed “the Science Climate denial” into a … small subset of it – the denial of the anthropogenic warming”
– and that implied that ALL climate models used by climate science are “violate the laws of thermodynamics”, and “use incorrect physics” – and the central explanation of the observation – the greenhouse effect is “a fiction” – is NOT a Climate Science denial.:
K. Maru: This is not denial. It’s a heterodox scientific proposal — a challenge to the mechanism (radiative forcing vs. thermodynamic forcing), not to the reality of anthropogenic warming.”
Note also the use of words:
– “ proposal ” – a word suggesting being open to falsification – to describe the guy who staked his reputation on dismissing all (non-crackpot) climate models as “using incorrect physics”, “violating the laws of thermodynamics”, and a “fiction”.
– “ scientific” – to give the veneer of respectability to the arrogant, ignorant, claims of Nabil Swedan
– “ heterodox ” – thus bravely opposing the scientific Orthodoxy – the despised by K. Maru IPCC and its consensus reports
Tomas: ” It is funny to compare this vigorous defence of Nabil Swedan’s fundamental 2023 article (that is in its entirety based on an absurd assumption that Earth can be treated as an isolated thermodynamic system) with KM’s significantly less enthusiastic comment on Nabil’s response to KM’s own questions directed to Nabil’s recent article about ENSO. A quick end of a romance :-)”
that romance was always one-sided – K. Maru never loved Nabil, but merely used him – Nabil’s ENSO paper – even if had been correct – would have been about meteorology and physical oceanography – with hardly any implications to the IPCC and Consensus. So maru Jettisoned that paper to concentrate on Nabil’s papers that can be used to discredit IPCC and the hated Consensus, as
-“ using incorrect physics”
– “ violating the laws of thermodynamics”
– the “ so-called greenhouse effect [which] is a fiction …”
(c) for all three quotes – Nabil Swedan.
“ Some of them want to use you, Nabil..
“Kobayashi Maru” says : RELOCATING my reply to Nabil Swedan 8 Aug 2026 at 10:40 PM… away from the noise.
WHY? Proving with Swedan’s own words that you are in bed with an extreme climate change denier,
who went after the very person with whose authority you try to associate yourself – J. Hansen –
is …. TOO MUCH NOISE for you?
If you dismissed our posts before reading them – let me quote:
==== <a href = "https://acp.copernicus.org/preprints/15/C5268/2015/acpd-15-C5268-2015-print.pdf"
Atmos. Chem. Phys. Discuss., 15, C5268–C5269, 2015
“Interactive comment on “Ice melt, sea level rise and superstorms: evidence from paleoclimate data, climate modeling, and modern observations that 2 ◦C global warming is highly dangerous” by J. Hansen et al.”
Author: N. Swedan, nabilswedan@yahoo.com Received and published: 27 July 2015
Again, the work [ of J. Hansen et al.] presented in this paper is based on a climate computer model that has incorrect physics.. The energy balance of these climate models is based on the radiative forcing approach of the so called greenhouse gas effect. This effect is a fiction, and the radiative approach violates the laws of thermodynamics. Colder atmospheric air “slabs” cannot radiate energy to warmer air “slabs” or surface.
Nabil Swedan ”
=================
So, the guy says that Hansen’s results and his conclusion ” that 2 ◦C global warming is highly dangerous” are based on “ incorrect physics“, that ” the so called [sic] greenhouse gas effect is a fiction“, and that all computer climate models including radiative transfer of energy ” violate the laws of thermodynamics”…
Doesn’t THIS go against … everything you against the thousands of your posts posted from under dozens of names over the many years? And you are taking Swedan’s “work” and Swedan’s understanding of climate – OVER those of Hansen ???
I guess we could have foreseen it, when you started openly defending/minimizing Trumps actions on climate: demanding that people on RC stop “foolishly blaming Trump” (c) “Kobayashi Maru”
Hoo boy! How to say, “I like to invoke thermodynamics without actually understanding anything about it” in a (slightly) less obvious fashion.
Tomáš Kalisz says
12 Aug 2026 at 8:33 AM
It appears to me on the surface after investigating the assertions by Tomas, and Nigelj, that several people here need to develop an improved scientific objectivity and learn how to ask their AIs less biased prompts.
About https://pmc.ncbi.nlm.nih.gov/articles/PMC9857689/pdf/entropy-25-00072.pdf or https://doi.org/10.3390/e25010072 Author Swedan, N.H. 2022
Direct Answer: No, This Is Not “Climate Science Denial”
Based on my reading of the full paper, it does not deny climate science. In fact, it:
Explicitly accepts that the Earth is warming
Explicitly accepts that human activity (fossil fuels, deforestation) is the primary driver
Attempts to quantify the warming and its impacts (temperature rise, sea level rise, stratospheric cooling)
Uses the IPCC’s own data for comparison and validation
This is not denial. It’s a heterodox scientific proposal — a challenge to the mechanism (radiative forcing vs. thermodynamic forcing), not to the reality of anthropogenic warming.
KM, what a load of garbage. Never accused Swedan of denialism or climate science denialism in some very general sense, only that hes in denial about the greenhouse effect which he clearly is, judging by the paper you quote. However people typically use the term denialist or climate science denialist to denote scepticism about the greenhouse effect and whether we are increasing that effect. Its shorthand. Maybe ask your precious pedantic AI about all that.
Multitroll “Kobayashi Maru” defends Nabil Swedan, assuring us that he is no denier.
Let’s see: Atmos. Chem. Phys. Discuss., 15, C5268–C5269, 2015 “Interactive comment on “Ice melt, sea level rise and superstorms: evidence from paleoclimate data, climate modeling, and modern observations that 2 ◦C global warming is highly dangerous” by J. Hansen et al.” Author: N. Swedan, nabilswedan@yahoo.com Received and published: 27 July 2015
“ Again, the work [ of J. Hansen et al.] presented in this paper is based on a climate computer model that has incorrect physics.. The energy balance of these climate models is based on the radiative forcing approach of the so called greenhouse gas effect. This effect is a fiction, and the radiative approach violates the laws of thermodynamics. Colder atmospheric air “slabs” cannot radiate energy to warmer air “slabs” or surface ” (c) Nabil Swedan
But sure., Mr. Maru – N. Swedan who tried to discredit J. Hansen by claiming that
– Hansen’s paper was “ based on a climate computer model that has incorrect physics“,
– that ” the so called [sic] greenhouse gas effect is a fiction“,
– and that all climate science models that include radiative transfer of energy violate the laws of thermodynamics ”…
and who promoted fossil fuel use, because climate science is fatally flawed: “ Models are missing the potential energy of the atmosphere in the energy equation, which is 50% of the energy exchange with the earth. There is no way that they can make correct projections unless it is fixed. Until then, and in the absence of correct numbers, I think we should continue to drill.”
(c) Nabil Swedan
and most importantly for the current moment who has NOT come clean about being wrong then, quite the contrary – who has just DEFENDED his above attacks on the validity of climate models and his calling the greenhouse effect – a “fiction” , as done ….” to ensure fairness and accuracy”
But sure – he can in no way be considered a denier of the greenhouse effect or a denier of the climate science validity….
Then again – Swedan’s defense comes from the mouth of the same Multi-troll who for the rhetorical advantage and therefore to gratify his ego – was perfectly OK with whitewashing Trump:
“stop […] foolishly blaming Trump” (c) “Kobayashi Maru”
By the people they defend you shall know them.
The Real Problem?
Global warming hasn’t been solved after 30-40 years of consensus science. That’s a real problem. But instead of asking:
“Why haven’t we solved this?”
“What are we missing?”
“Are there alternative mechanisms worth exploring?”
“What data are we still missing?”
“Why is Warming rate accelerating now?”
“What kind of global systems solutions will actually work?”
“Are today’s climate institutions and capitalist-political-economic systems fit for purpose?”
…they’re hunting accused heretics.
It’s easier to burn a dissenter at the stake than to admit the consensus might be incomplete.
I’m not buying it. I reject that approach. Science is supposed to ask hard questions, not police orthodoxy.
The “Heretic Burning” metaphor is perfect. It’s not an exaggeration. The foolish impulse is ancient:
“We don’t know why the crops are failing. But we know it’s the witch’s fault.”
Today:
“We don’t know why the models aren’t matching observations. But we know it’s the denier’s fault.”
Same fragile psychology. Same failure to ask the hard questions.
KM: Global warming hasn’t been solved after 30-40 years of consensus science. That’s a real problem.
MS: No, KM, we have solved global warming. We know what it is; we know the causes, and we know how to end it.
We have begun ending it. You point out that we aren’t doing a good job of it yet, but we have solved it, and we have begun to end it.
KM: I’m not buying it. I reject that approach. Science is supposed to ask hard questions, not police orthodoxy.
MS: What is your plan for solving global warming?
Thanks Martin,
I already answered your question/s. Your commentary here and on the other thread are confirming the thesis and work of Jennifer and many others.
Chanting to the choir: the dialogical failure of antithetical climate change blogs
Jennifer Metcalfe https://jcom.sissa.it/issue/77/info/
I’ll leave the last word to you.
KM: I already answered your question/s.
MS: I don’t think you did, but if you did, you weren’t responding to me directly, so I probably didn’t see your answers.
KM: I’ll leave the last word to you.
MS: The paper you linked is very long, so I didn’t read all of it. The author chose to compare two blogs (sic), Skeptical Science and JoNova. The author claims these two blogs (sic) are antithetical. The entire paper was about comparing commenters on Skeptical Science and commenters on JoNova.
But the two websites are not really comparable for any reason other than comparing their commenters. Consider Google AI’s analysis:
Skeptical Science and JoNova operate on entirely different publishing models and editorial standards.
Looking at the internal structure of how they produce and curate content highlights why a direct comparison can be misleading:
1. Multi-Author Research vs. Solo Political Blog
Skeptical Science is an institutional entity. Articles are written by a global team of authors, edited by peers, and the platform actively engages in original citizen science (such as publishing their own peer-reviewed consensus papers like Cook et al., 2013).
JoNova is a personal diary. The content is driven almost exclusively by Joanne Nova’s personal perspectives. It does not have an editorial board or a team of scientific contributors vetting the material.
2. Literature Aggregator vs. Commentary Site
Skeptical Science acts as an active science aggregator. The site features structural databases, exhaustive lists of newly published peer-reviewed climate research, and systematic breakdowns of primary literature.
JoNova is a culture and policy commentary blog. It focuses heavily on economic critiques, Australian politics, anti-renewables commentary, and energy grid debates rather than aggregating or dissecting newly published primary scientific literature.
The Academic Reason They Are Compared
The only reason these two sites appear in the same sentence is due to outside media researchers and sociologists, not because of their intrinsic structures.
When academic studies analyze “climate change polarization on the internet,” they use Skeptical Science to represent the pro-consensus viewpoint and JoNova to represent the skeptic viewpoint because both are high-traffic, mid-2000s Australian blogs with highly active comment sections.
From a purely operational standpoint, however, Skeptical Science functions as a heavily sourced, crowdsourced library database, whereas JoNova is a traditional, single-author political opinion column.
—
MS: Implicit in the linked paper, it seems to me, is that the two antithetical views have equal value. They don’t. Global warming is real; global warming really is caused by burning fossil fuels and bad land use practices, and global warming really is bad for the human race.
But I guess the author’s point is that climate scientists should be spending hours every day in the comment threads refuting myths and lies, because, as she says in her introduction, blogs like RealClimate are an effective way to distribute science.
But climate scientists don’t have hours a day to spend arguing with rubes saying the same wrong things over and over and over again.
OTOH, we now have AI agents that could handle that task magnificently. Let’s build a ChatGPT agent whose task is to respond to each comment with pro and con views based on science and economics results that are peer-reviewed.
Multi-troll KM to Martin Smith: I already answered your question/s.
sometime, somewhere, in one of the tens? hundreds? of your previous long-winded posts? And you put the onus of reading those, in search of that “answer/s” , on the reader, not on the guy who wrote it – thus knows exactly where these “answer/s” are?
Multi-troll: Your commentary [confirms] the thesis and work of Jennifer and many others.
Those who can defend their claims do that themselves. Those who can’t – appeal to authority – assure us that this defense is … somewhere in the work of … other presumably authoritative people (in “ the thesis and work of Jennifer and many others.“).
Multi=troll: I’ll leave the last word to you.
How magnanimous of you. In reality, the “ I’ll leave the last word to you ” does the opposite – signals to the reader in your favour – that you COULD successfully falsify ANY argument Martin could possibly come up with, but given his intellectual inferiority, you won’t waste more of your time on him. Thus whatever he comes up with for his “last word”, will just confirm that it was you who won. And he doesn’t – then it means he couldn’t come up with anything. Damned, whichever he chooses. Or as my mother used to say – “ if not a curse spell, then diarrhea“.
KM: “The Real Problem? Global warming hasn’t been solved after 30-40 years of consensus science. That’s a real problem. But instead of asking:“Why haven’t we solved this?…..”
No. Firstly as MS points out we have solved global warming in the sense we know whats causing it and how to fix the problem.
Secondly hundreds of people have asked why we haven’t made faster progress mitigating the climate problem, and millions of words have been written on why. In short some of the reasons are: 1)people are worried about the costs of mitigating the problem and are flooded with disinformation exaggerating the costs so they resist changing their lifestyles or supporting things like carbon taxes. 2) Our minds are organised to prioritise short term threats like a terrorist attack, as opposed to long term threats like climate change even although they may be more serious threats. 3) Changing energy systems is hard work and 4) The consensus science is continually undermined by a massive misinformation campaign.
But none of that makes the conventional strategies of renewables or EVs wrong. In fact they are gaining traction despite the resistance. The alternatives like degrowth have been promoted as well. Even the IPCC recommends people reduce their energy use. But clearly these meet much stronger public resistance than renewables. We know this as per capita energy use hasn’t fallen globally.
KM: “It’s easier to burn a dissenter at the stake than to admit the consensus might be incomplete.”
No. The person being criticised is N Swedan who appears to deny the greenhouse effect exists. There’s a strong consensus in the scientific community that the greenhouse effect is real. But nobody here claims that the consensus is 100% complete on everything. So KMs statement is a strawman.
But theres a strong consensus on the climate fundamentals. Refer:
https://en.wikipedia.org/wiki/Scientific_consensus_on_climate_change
I have to say I find KMs comments incredibly confused and almost deliberately manipulative.
Link to the NOAA CPC ENSO Diagnostic Discussion of 13 August 2026:
https://www.cpc.ncep.noaa.gov/products/analysis_monitoring/enso_advisory/ensodisc.pdf
The subsurface temperature anomalies are conspicuous.
E. Burke: “The subsurface temperature anomalies are conspicuous.”
conspicuous compared to 1991-2020 avg. baseline (that includes temps. from El Nino years, normal years and La Nina years)
However, to this thread (“This new El Niño is different”) more relevant is – are they are more conspicuous than during previous El Ninos.
In the linked ENSO discussion see the following item –
Figure 3. Area-averaged upper-ocean (0-300m) temperature anomaly (°C) in the equatorial
Pacific (5°N-5°S, 180º-100ºW). The temperature anomaly is computed as the departure from the
1991-2020 base period pentad means. Data: GODAS.
https://www.cpc.ncep.noaa.gov/products/analysis_monitoring/enso_update/heat-last-year-hr.png
Readers might well consider keeping in mind Hansen’s team analysis ::
Super-Duper El Nino – James Hansen, Pushker Kharecha, Dylan Morgan and Jasen Vest
Apr 15, 2026
There are inherent limitations on predictability caused by chaotic aspects of atmosphere and ocean dynamics, but that cannot account for the huge range among models. It is common to look at the range of model results and treat this as if it were a probability distribution for the real world. It is not. It is simply the fog of results from all models – the good, the bad, and the ugly – and a rather fruitless comparison. What is needed is analysis of the effect of key processes in the better models. Well observed and analyzed events, such as the upcoming El Nino, provide an opportunity to test simulation of key processes.
Second, we showed in our earlier communications[3],[4] that the Nino3.4 (sea surface temperature anomaly in an equatorial strip in the Pacific) is an inferior predictor and measure of El Ninos. The heat content of the upper 300 m of the equatorial Pacific (Fig. 1) is a better measure of El Nino strength; for example, it correctly has the 1997-98 El Nino as the strongest El Nino in the past 50 years, while the Nino3.4 index has the 2015-16 El Nino as stronger. Moreover, the 300 m temperature anomalies are correlated with global temperature change almost as well (53%) as the Nino3.4 index is correlated with global temperature (58%), and the 300 m temperature provides a 4-month longer lead time in its prediction of global temperature change. It is reasonable that the 300 m heat anomaly provides a good indication of future global temperature change and climate change because heat released from this tropical ocean reservoir drives the global warming that occurs with the El Nino.
The 300 m temperature already assures that we will have an El Nino in 2026-27. The March average of the 300 m temperature anomaly exceeds +1°C. At that point, it is consistent with either a Super El Nino (Fig. 2a) or an ordinary El Nino (Fig. 2b). However, in the first week of April, the 300 m anomaly reaches +1.6°C (Fig. 3). This increasing heat anomaly is a result of the reinforcing Kelvin wave (Fig. 4, left) traveling from west to east (see the discussion in our prior El Nino post[4]). This Kelvin wave was boosted by recent westerly wind anomalies (Fig. 4, right).
https://jimehansen.substack.com/p/super-duper-el-nino
and
Beware Media Hype. It’s Not the El Nino! (yet) James Hansen, Pushker Kharecha, Dylan Morgan, Jasen Vest
23 July 2026
Beware the “surprise” record high being blamed on an extreme El Nino on top of global warming otherwise consistent with IPCC estimates. Instead, record warmth provides additional evidence of high climate sensitivity and increased net climate forcing in the past decade.
Fig. 2. Equatorial Pacific upper 300 m (0.16°N-0.16°S) temperature vs time and longitude.
The budding 2026-27 El Nino, lower right of Fig.2, is compared with the other strong El Ninos (1982-83, 1997-98, 2015-16) in the period with good upper ocean data. We need several more months of data to assess how strong the current El Nino is relative to the other strong El Ninos, but it will be difficult for it to match the strength of the 1997-98 El Nino. The current El Nino seems to be emerging from a warmer western Pacific Ocean. The tropical ocean mixed layer is much thinner than 300 m, yet is it possible that accelerated global warming in the past decade and tropical storms have warmed the upper 300 m in the Western Pacific? Is the rapid return of El Nino, just 3 years after the 2023-24 El Nino, related to increased warmth in the Western Pacific?
https://jimehansen.substack.com/p/beware-media-hype-its-not-the-el
Belated reply to Paul Pukite (@whut) says 5 Aug 2026 at 5:10 AM and his PubPeer comment on Nabil’s paper.
In my view, Pukite’s proposed tests are logically flawed and would not demonstrate what he claims they would. Here’s why, in plain terms:
The “Before/After” Test:
“Calibrate on Pacific data before 1997, then predict the 1997 event.”
The Problem: The model is still being tested against data from the same system (the Pacific) — just split by time.
Why It’s Circular: It assumes the parameters are time-invariant. But if the forcing (hemispheric warming asymmetry) is changing over time — as Nabil’s paper explicitly argues — then the parameters should change. Fixing them artificially would guarantee failure and prove nothing about the underlying physics.
The Indian Ocean “Fix”:
“Calibrate on Indian Ocean data, then apply it to the Pacific to predict ENSO.”
The Problem: The Indian Ocean doesn’t have ENSO. Calibrating there would just produce a model that predicts normal Indian Ocean conditions. Applying it to the Pacific would just predict normal Pacific conditions.
Why It’s Circular: This doesn’t test the physical mechanism. It’s a test of whether a model calibrated to one ocean’s “normal” state can reproduce another ocean’s “normal” state. That’s a test of basic physics, not of Nabil’s specific ENSO mechanism.
The Deeper Issue:
The Indian Ocean test fails because it begs the question: “If hemispheric warming asymmetry is the global driver of ENSO, why doesn’t the Indian Ocean have ENSO?”
This is the critical point. If Nabil’s mechanism is correct, it should operate in any ocean. The fact that the Indian Ocean doesn’t have ENSO means either:
1. The mechanism is incomplete (needs Pacific-specific factors).
2. The mechanism is not the primary driver.
The Indian Ocean test would only confirm that the Indian Ocean is not the Pacific. It wouldn’t test Nabil’s physical mechanism at all.
What a Proper Test Would Look Like:
In my view, a meaningful test of Nabil’s mechanism would need to:
1. Derive coefficients independently — from physical constants or independent observations, not from the ENSO record itself.
2. Make a blind prediction — using fixed parameters, predict a future ENSO event before it happens, with no reference to that event’s timing in the calibration.
3. Compare to a null model — show that Nabil’s mechanism outperforms a generic damped oscillator with the same number of free parameters.
None of these are what Pukite proposed. Pukite’s “suggested test” is not a meaningful test of independence. It’s a distraction. And the Indian Ocean “fix” doesn’t fix it.
Meanwhile, as I’m about to show in another comment, we don’t even have the physical data required for Nabil’s theory to be tested properly.
“None of these are what Pukite proposed. Pukite’s “suggested test” is not a meaningful test of independence. “
My PubPeer comment on the Swedan paper covers 2 out of the 3 tests Your second suggestion is idealistic — i.e. that models can only be validated on future (i.e. untainted) data. The AI revolution would not have happened if this was required. Most training models are cross-validated on historical data.
I’ll repeat what I said then:
In my view, Pukite’s proposed tests are logically flawed and would not demonstrate what he claims they would. Here’s why, in plain terms:
The “Before/After” Test:
“Calibrate on Pacific data before 1997, then predict the 1997 event.”
The Problem: The model is still being tested against data from the same system (the Pacific) — just split by time.
Why It’s Circular: It assumes the parameters are time-invariant. But if the forcing (hemispheric warming asymmetry) is changing over time — as Nabil’s paper explicitly argues — then the parameters should change. Fixing them artificially would guarantee failure and prove nothing about the underlying physics.
The Indian Ocean “Fix”:
“Calibrate on Indian Ocean data, then apply it to the Pacific to predict ENSO.”
The Problem: The Indian Ocean doesn’t have ENSO. Calibrating there would just produce a model that predicts normal Indian Ocean conditions. Applying it to the Pacific would just predict normal Pacific conditions.
Why It’s Circular: This doesn’t test the physical mechanism. It’s a test of whether a model calibrated to one ocean’s “normal” state can reproduce another ocean’s “normal” state. That’s a test of basic physics, not of Nabil’s specific ENSO mechanism.
[end quote]
I could rephrase that for additional clarity but Martin Smith might have a meltdown over that, so it’s my verbatim prior comment.
Everything else you threw around at others here Paul was emotive cheap ad hominem attacks and other fallacies unrelated to the substance. Your haughty PubPeer comment is a distraction over nothing. I showed how Nabil’s paper lacks data and the physical mechanism he claims exists.
– KM 23 Aug. “ I’ll repeat what I said. In my view, Pukite’s proposed tests are logically flawed”
– the same KM, earlier post: Making comments online is easy. My opinion, right or wrong, doesn’t rate much if at all.
So … why do you insist on _repeating_ something if it “doesn’t rate much if at all”?
I created an El Niño tracker in April. Back then a peak above +2.5 °C — the magnitude of 1997 and 2015 — was the most extreme step on my scale, and it read 25%.
https://thelongswell.com/elnino/
This morning I had to add a new step at +4.0 °C.
Three of the five forecast models now put a peak that high at better than even.
For scale: the strongest El Niño ever measured peaked at +2.59 °C. That was 2015-16, not 1997.
That +2.5 line now reads 99%.
Do you remember this by James Hansen?
18 DECEMBER 2025
Global Temperature in 2025, 2026, 2027
Abstract.
Global temperature in 2025 declined 0.1°C from its El Nino-spurred maximum in 2024, making 2025 the second warmest year. The 2023-2025 mean is +1.5°C relative to 1880-1920. The 12-month running-mean temperature should decline for the next few months, reaching a minimum about +1.4°C.
Later in 2026, we expect the 12-month running-mean temperature to begin to rise, as dynamical models show development of an El Nino.
We project a global temperature record of +1.7°C in 2027, which will provide further confirmation of the recent global warming acceleration.
Global temperature of +1.47°C in 2025 relative to 1880-1920 is the 2nd highest in the period of instrumental data, about 0.1°C cooler than the 2024 record high (Fig. 1) in the GISS (Goddard Institute for Space Studies) analysis.[1] (We assume the remainder of this month will be about 0.1°C cooler than the same period in 2024; this uncertainty in the exact December temperature has imperceptible effect on the 2025 temperature in Fig. 1). The 3-year (2023-2025) temperature is +1.5°C relative to 1880-1920. We will provide details on the geographical and temporal temperature change in a communication in early 2026.
Two years ago (29 March 2024) we projected that global warming in the then-ongoing El Nino would rise much more than in prior El Ninos, raising global temperature to at least +1.6°C, and that temperature after the El Nino would fall only to +1.4°C (see Fig. 2). (Expectation of unusual warming was based on realization that a long-term global cooling effect of aerosols had recently shifted to warming, as we will discuss further in an upcoming post.)
Consistent with this prior projection, we expect a minimum 12-month running-mean temperature of about +1.4°C to be reached in the first half of 2026, after which global temperature should begin a rise that will continue into 2027, reaching a new record high, as discussed below.
El Nino status. The tropical Pacific Ocean is presently in its cool La Nina phase, but there is evidence in numerous models that it will shift into the El Nino phase in 2026. …………….
https://jimehansen.substack.com/p/global-temperature-in-2025-2026-2027
Kobe Maru: “Do you remember this by James Hansen?
” We project a global temperature record of +1.7°C in 2027″
Wouldn’t his be the same James Hansen your friend Nabil Swedan dismissed for using models “having incorrect physics “, “the so called greenhouse gas effect is a fiction”, and using radiative forcing approach which “violates the laws of thermodynamics”?
As in:
=====
Again, the work [ of J. Hansen et al.] presented in this paper is based on a climate computer model that has incorrect physics.. The energy balance of these climate models is based on the radiative forcing approach of the so called greenhouse gas effect. This effect is a fiction, and the radiative approach violates the laws of thermodynamics. Colder atmospheric air “slabs” cannot radiate energy to warmer air “slabs” or surface ” (c) Nabil Swedan
================
If you believe that Nabil Swedan is a credible author, and knows what he is taking about, then why would his earlier take down of James Hansen, of the (fictional!) greenhouse effect and of contradictory to the laws of thermodynamics radiative budget – not be valid today?
Tomáš Kalisz says ” the corresponding radiative forcing is about 0.01 W/m^2.
Thanks, Tomas, for checking it and pointing to my calculation error. 0.01 W/m^2 is CORRECT.
Now let’s compare it to the 350 LARGER GHG radiative forcing of ~ 3.5 W/m^2, obtained from climate models used by James Hanson and others. The models that our Nabil Swedan consistently dismisses as “a fiction”, “incorrect physics” and “violating the laws of thermodynamics” .
And this is the scientific basis of the paper officially written and published^* by Nabil Swedan in that journal world-famous for its climate modelling expertise Acta Ecologica Sinica .
____
^* Nabil Swedan, lecturing Paul Pukite: “Professional and academic standards rely on official written and published work”
in Re to Piotr, 19 Aug 2026 at 10:35 AM,
https://www.realclimate.org/index.php/archives/2026/07/this-new-el-nino-is-different/#comment-850545
Hello Piotr,
Thank you for your confirmation.
I tried to make Nabil aware of his incorrect calculation of the radiative forcing caused by fossil fuel heat of combustion in his 2023 article in the journal “Entropy”
https://www.mdpi.com/1099-4300/25/1/72
twice, last time on 16 Aug 2026 at 4:35 PM,
https://www.realclimate.org/index.php/archives/2026/07/this-new-el-nino-is-different/#comment-850535 .
If he did not omit dividing his result by 255, he would also obtain 0.01 W/m2.
Instead, he took his erroneous value 2.57 W/m2 and asserted that its allegedly good fit with IPPC calculations of radiative forcing supports his absurd “thermodynamic” explanation of global warming and makes it equivalent to the established mechanism of anthropogenic enhancement of the radiative greenhouse effect.
It appears that our objections muted him. It is therefore possible that he recognized his error, unfortunately, it is hard to say it with certainty.
Greetings
Tomáš
Tomas: “ Nabil Swedan took his erroneous value 2.57 W/m2 [instead of correct 0.01 W/m2] and asserted that its allegedly good fit with IPCC calculations of radiative forcing supports his absurd “thermodynamic” explanation of global warming and makes it equivalent to the established mechanism of anthropogenic enhancement of the radiative greenhouse effect.
Neither Swedan nor Maru explained why the Earth ocean haven’t boiled out yet – with 240 W/m2 of the solar absorbed by Earth and no energy leaving the Earth (since radiative approach “violates the laws of thermodynamics”) nor is there escape of energy associated with matter, as ““the exchange of matter [with outer space] is negligible”
So (240 J/m2 * 4.5 billion years) / (2.2kJ/g*10^6g/m3) – that’s enough heat to evaporate an ocean with the depth of ….. 15 MLN km. Quite an ocean ….
The latest CPC Official ENSO Outlook is forecasting, not just a 90% chance of a “very strong El Niño” on the way, but also a 69% chance of a strength exceeding all previous El Niño back to 1950.
This strength would be measured in Relative-ONI which hit 2.3 back in both 2015/16 and 1997/98 and 2.4 back in 1982/83. The 1982/83 event coincided with the effects of the 1982 El Chichón volcanic eruption which muted a lot of the 1982/83 El Niño’s climate signal (particularly the usual El Niño global temperature spike).
R-ONI is the 3-month rolling average of R-NINO3.4 which is currently on the rise, with its latest weekly value up to 1.8 and matching the rise seen in 1997/98 – as plotted out on the graphic HERE Posted 19th August 2026.
Apologies for being out of touch with the forum and asking questions that might already have been answered. However, from looking at this post, I’m thinking that my preferred questions are still burning away.
My computer is functioning again. I hope to update my ‘model’ (such as it is) and continue my amateur investigation into sea surface temperature.
I’m pretty much at the limit of what LibreOffice Calc can handle without stalling, but maybe my updated system will improve the outlook. If not, I can try re-writing my spreadsheet in simplified form to make it smaller and faster, or find other software more suited to the task. Perhaps I’ll finally learn PostGreSQL and Octave.
As a reminder for those who have forgotten, or as an introduction for those who missed it, I’ve occasionally been addressing the topic of recent and poorly modeled anomalously abrupt warming in posts on X/Twitter, such as in this exchange where I once again posit to a purported climate scientist/journalist/whatever who I don’t know that:
* the Hunga Tonga eruption in January of 2022 increased stratospheric H2O by 20% over the southern hemisphere
* and accentuated the already poorly modeled polar amplification by increasing the supercooled stratospheric vapor and blocking re-radiation into space
* which boosted sea surface temperature of the southern ocean and initiated the ‘gobsmackingly bananas’ loss of Antarctic sea ice
* before diffusing globally and similarly boosting polar amplification in the northern hemisphere in 2023 as the plume of stratospheric vapor settled into a 10% increase over both hemispheres
* that eventually disspipated/precipitated within 2-3 years total
* while lingering effects from the pulsed heating continue probably until 2028
* per the historical record of Pinatubo cooling that I also seemingly identified in SST with the same method
* and visually compared for similarities in a detrended, time-shifted, and inverted trace superimposed over what seems to be Hunga Tonga warming
https://x.com/cheryl_josie/status/2090901513459945555?s=20
Do I have scientific proof of my speculations/assertions? No. What I have is a preponderance of evidence in the peer-reviewed literature that seemingly backs the result I experimentally found with my simplistic sea surface temperature modeling in an overtaxed free and open source spreadsheet program.
I’ve used multivariable linear regression to model and remove the global surface temperature component of several different sea surface oscillation modes so that I can see the underlying trends independently of those oscillation modes.
Then I’ve admittedly *invented* estimated warming potential of stratospsheric water vapor in ‘sulfuric equivalents’ and plotted its impulses as a back-estimate of the actual warming I seem to have found, since there seems to be no prior art whatsoever into any warming effect of Hunga Tonga on poorly modeled polar amplification. The research claiming that Hunga Tonga caused net cooling completely neglected the potential effect of stratospheric supercooling and its capacity to trap polar heat.
My method of estimating the warming potential of stratospheric H2O via currently uninvestigated polar amplification effects was to compare the Pinatubo cooling effect I found to the apparent Hunga Tonga warming effect I found, which seem to be nearly identical in magnitude, and use that ratio to scale the H2O emissions pulse on the sulfuric emissions axis. Yes, it’s completely unscientific and unvalidated, but it’s the best I can do. Sorry.
Fortunately I didn’t have to invent estimated sulfuric emissions or H2O emissions because the Smithsonian Volcanism Project did track those during the time frame of the satellite era, but with DOGE cuts I’ve lost access to their database search engine, and their ‘searchable spreadsheet download’ doesn’t load into LibreOffice, so my investigation into volcanic effects is blind to any volcanic activity that occurred after 2022.
In light of the current anomalous circumstances, I am furthering my speculation with the elaboration that:
* perhaps the pulsed warming of Hunga Tonga in 2022, during La Niña, is now being released in a new and unprecedented super El Niño.
Prior art linked from this forum claims that prolonged La Niña has previously initiated at least two rebound super El Niños. There was some speculation in this forum that it may have been a mechanism behind the ‘gobsmackingly bananas’ 2023 SST and ice loss too, but that speculation was neither confirmed nor refuted when I last checked (a couple of years ago),
I’m wondering if this rebound super El Niño effect also applies to a pulsed energy input during *any* La Niña, regardless if that pulsed energy is a transient impulse from a volcano, or a step function from aerosol termination shock.
Hunga Tonga 1/2022 eruption occurred right at the peak intensity and just before the very end of that sawtooth-shaped La Niña. Perhaps that timed pulse resulted in both an abrupt end to that La Niña, and a delayed reaction that skipped the 2023 El Niño, and released that pulsed warming during the currently anomalous 2026 super El Nino.
I’d like some scientific confirmation or refutation of my findings and speculations. Unfortunately, I still don’t have the resources or background to validate my simplistic model.
Also, no bona fide climate scientist has yet taken me up on my offer to share my method and findings in the interest of science (with no demand for compensation or recognition of my contribution, regardless of the outcome of the investigation, since I am not a climate scientist and my speculations are not science).
I am curious however if, in my prolonged absence, Gavin’s Real Climate forum has rendered a final verdict on what caused Zeke Hausfather’s 2023 ‘gobsmackingly bananas’ yet? Last I checked, it was still looking a little bit mysterious. You had seemingly assured yourselves that you explained 2024 okay, but not 2023, and didn’t look into 2022.
Anyone? thanks, and apologies for my butting in again. If I’m annoying you with my speculations, please ignore.
I’m trying to be helpful, but I know that some people see me as a useful misinformation tool to be exploited, or perhaps shot down.
I assure you all, I am neither. My exploration into this topic is completely self-driven out of genuine scientific curiosity, even if my lack of resources and background are hobbling my investigation.
Hopefully someone with some chops can figure out if I’m onto something useful or not. I wish it were me, but unfortunately it’s beyond my capability. I see little chance of that changing any time soon.
Thanks for your kind indulgence again, and good luck with ‘gobsmackingly bananas’. Something tells me this discussion of anomalous findings isn’t over yet. Could it be terms like ‘different’ and ‘remarkable’ being tossed around like juggling pins?
My final speculation for this reply is that there is more error in the atmospheric modeling of polar amplification than there is in ENSO etc. modeling, at least in regards to the anomalous warming we have seen mid-decade so far. I think maybe the anomaly is better explained by a neglected polar amplification pulsed energy input that is still settling, than by an error in ocean current simulation.
Given the current state of the science, with historically accurate global satellite climate surveillance, I also think Hunga Tonga is a golden opportunity to refine climate models that are already known to seriously underestimate the polar amplification component of anthropogenic global warming.
Here’s to the future of science. We need you guys. Thanks for your labor and dedication.
My latest plots are up.
https://x.com/cheryl_josie/status/2091866767283106146?s=20
I’ve figured out that hard disk i/o is the bottleneck. I’m going to have to get another, larger SSD for my computer so that I can edit spreadsheets and render video faster.
I’m still hopeful that someone will either validate my approach or refute it with finality. I know it’s non-standard and totally amateur. What I don’t know is if it is valuable.
Many thanks to the gracious moderators for approving my post and getting more eyes on the issue.
Gack. My script blocker barfed on my first attempt to post this. If this is a duplicate, please delete it.
My latest plots are up.
https://x.com/cheryl_josie/status/2091866767283106146?s=20
I’ve figured out that hard disk i/o is the bottleneck. I’m going to have to get another, larger SSD for my computer so that I can edit spreadsheets and render video faster.
I’m still hopeful that someone will either validate my approach or refute it with finality. I know it’s non-standard and totally amateur. What I don’t know is if it is valuable.
Many thanks to the gracious moderators for approving my post and getting more eyes on the issue.
The scientific consensus around Hansen’s work and agreement with his projections and physics increases while the Michael Mann following falls away as rapidly as the temperatures keep rising. Mann has even publicly disowned the scientific position of Stefan Rahmstorf on YT interviews.
First, let’s review a couple of key publications by Hansen:
Jim Hansen Nov 22, 2025
One implication of the increased growth rate of GHG forcing in the last 15 years is that the goal to keep global warming under 2°C is now implausible.
IPCC defined a GHG scenario (RCP2.6) intended to provide a 66% chance of keeping global warming below 2°C. Actual growth of GHG forcing has diverged dramatically from that scenario (Fig. 1), with reality being close to the extreme RCP8.5 scenario. The gap between reality and RCP2.6 could be closed by capturing and storing CO2 (carbon capture and sequestration, CCS), but the annual cost for the gap at January 2023 (the time of the last 60-month mean) would be $2.4-5 trillion[4] with current technology, and the gap and annual cost are increasing.
RCP2.6, in fact, was never plausible, as it relied on assumption of large-scale biomass-burning at powerplants with carbon capture and permanent storage of the captured CO2, a scheme that would ravage nature and threaten food security.[5] We scientists must share the blame, if we allow policymakers to believe that such scenarios provide a realistic projection of climate change.
How effective is IPCC? Is IPCC expected to be a source of scientific advice for the United Nations? If so, how is it that the Secretary General continues to assert that it is still feasible to keep global warming from exceeding the 1.5°C limit?
https://jimehansen.substack.com/p/warning-this-colorful-chart-is-censored
Global Temperature in 2025, 2026, 2027 – James Hansen Dec 19, 2025
Abstract. Global temperature in 2025 declined 0.1°C from its El Nino-spurred maximum in 2024, making 2025 the second warmest year. The 2023-2025 mean is +1.5°C relative to 1880-1920. The 12-month running-mean temperature should decline for the next few months, reaching a minimum about +1.4°C. Later in 2026, we expect the 12-month running-mean temperature to begin to rise, as dynamical models show development of an El Nino. We project a global temperature record of +1.7°C in 2027, which will provide further confirmation of the recent global warming acceleration.
https://jimehansen.substack.com/p/global-temperature-in-2025-2026-2027
2026 On Track for Warmest Year – James Hansen Apr 30, 2026
https://jimehansen.substack.com/p/2026-on-track-for-warmest-year
KM: Bill McGuire is another joining with the Hansen consensus by projecting a global temperature record of +1.7°C in 2027! And is very critical of the “madness” surrounding the UN COP and IPCC systems as Hansen and Kevin Anderson and others are as well.
Natural Disaster Expert: Elites Have NO PLAN for Climate Collapse
Aaron Bastani meets Bill McGuire UK Geologist Vulcanologist Climate Scientist
https://www.youtube.com/watch?v=ee9fYVwhBsU
Part three – EL NINO 2027, +1.7C, and +1.5C IPCC “mad nonsense” from 21:36 minutes
Aaron Bastani: We can talk about El Niño now. So, you think the UK could go above 40°C next year or the year after? How does this work? And how does it interact with breaking the present UK record of 40.2°C set in 2022?
Bill McGuire: El Niño is the second biggest climate signal after the seasons – that’s how big it is, that’s how much impact it has on the global climate. It involves the heating up of the eastern tropical Pacific. Because that heats up so much, it affects the air patterns above it, and they have knock-on impacts right across the planet – bringing extreme weather to places as far afield as Peru, Australia, Europe, and North America. It affects pretty much everything and everyone.
El Niños are classified based on how much hotter the eastern Pacific gets. The record was something like 2.7°C in 1877 – that was the biggest on record. But estimates now are for something getting on for 4°C. That’s just staggering, unprecedented, and nobody’s really sure what the impact of that will be on global climate and weather systems.
Aaron Bastani: No one’s really sure, but you’re highly learned on this stuff and you’ve seen a ton of data. What are your informed suspicions?
Bill McGuire: The changes to the weather you get from El Niño are superimposed on all sorts of other influences, so you can’t say everywhere on the planet is going to get hotter. But El Niño, because it brings so much heat into the atmosphere, does result in the global average temperature heating up. We’re pretty much getting on for 1.5°C above pre-industrial. Next year – 2027 – could be above 1.7°C because of the impact of El Niño. That wouldn’t necessarily be permanent – it could come down again – but when you’ve got that much more heat spread across the planet, a lot of places will be much hotter. The UK might get away with it, but the chances of it being another dreadfully hot summer are pretty high, I’d say.
Aaron Bastani: People talk about “1.5 to stay alive” – 1.5°C. But as I understand it, the IPCC says you need 1.5°C for 11 years before we’re officially at 1.5°C.
Bill McGuire: It’s a mad system of measuring it, really, because it’s the average over a 20-year period. That would mean if we got past 1.5°C this year, it wouldn’t be officially confirmed for ten years. That’s bonkers. We need to know when we’ve passed 1.5°C. Otherwise fossil fuel companies and others will say, “Oh, it’s fine, we’ve got plenty of time, we’re not beyond 1.5 yet, so we can just keep going.” It’s just another excuse for business as usual. There are ways of determining whether you’re at 1.5°C by looking at the current level of global warming and saying, “We look back over the last few years, we’ve got an average of 1.5 – this is where we’re at.” We need to be able to say this year we’re at 1.5, now we’re at 1.52 or whatever. The current system is mad.
Aaron Bastani: So, we’re at 1.5°C?
Bill McGuire: Effectively, yes. 1.5°C has been dead in the water for years. One of the worst things we see every year is the UN COP conferences saying, “We must do our hardest to keep the global average temperature below one and a half degrees.” They were still saying it last year, for God’s sake. We’re pumping out 40 billion tons of CO2 a year, and we’re at 1.48°C or something. It’s dead in the water. It’s been dead for ages. Why carry on with this nonsense?
Aaron Bastani: We had Kevin Anderson on a few weeks ago, and in terms of their methodology, it is plausible – Britain would have to reduce CO2 emissions by something like 12% every year, and we’d have to decarbonise completely by the late 2030s. The global south, while still developing and with population growing, would have to do something similar – he said 8%. And that’s by their own methodology, which you’re acknowledging is kind of stupid. So 1.5°C is dead, and it’s being used almost as a delaying tactic by vested interests.
Bill McGuire: Yeah.
Aaron Bastani: And you’re saying 1.7°C is quite plausible with El Niño next year?
Bill McGuire: In 2024, the global average temperature was over 1.6°C because of the last El Niño. So it’ll be over 1.6°C next year. 1.7°C is pretty much certain. I think it could be higher than that. Who knows? This is so unusual – we don’t know what’s going to happen really.
Aaron Bastani: Different places warm up in different ways. Places near water warm up at different rates to land masses. The Arctic is warming much more quickly than, say, the southeast United States. And in your book you talked about British Columbia getting to the high 40s.
Bill McGuire: Yes. A few years back you had 49°C there, towns obliterated by wildfires. At the time we were staggered, but now you’re seeing 40°C in the UK and British towns hit by wildfires. That’s just an example of how quickly things are progressing.
Aaron Bastani: For people who aren’t aware – British Columbia is a warm part of Canada, but it’s still Canada.
Bill McGuire: Yeah, it’s a maritime province, so it’s normally got a fairly amenable climate – fairly damp in winter, mild in summer, hotter when you go further inland. But one degree below 50°C is not what you would expect there.
Aaron Bastani: They do have skiing resorts like Whistler – it’s damp in winter.
Bill McGuire: If you’re high enough, that dampness translates into snow. It’s got big mountains, the Rockies go up there. But all the same, bordering on 50°C in Canada is bonkers, really.
Aaron Bastani: You don’t like the term “global warming”?
Bill McGuire: No, I don’t. Many people I know don’t use it. “Warming” sounds cosy – it’s quite nice. But “heating” is something quite different. Given the rate at which things are changing, “heating” is a much more appropriate term. So I use “global heating” – as do other media sources, The Guardian uses it, for example. And I use “climate breakdown” because “climate change” could be either way – for the better or worse. But breakdown is what we’re seeing – a stable climate, relatively speaking, over the last few thousand years, is now falling apart and becoming extremely unpredictable.
Finish – 29:03
KM: “The scientific consensus around Hansen’s work and agreement with his projections and physics increases while the Michael Mann following falls away as rapidly as the temperatures keep rising. Mann has even publicly disowned the scientific position of Stefan Rahmstorf on YT interviews.”
In support of his contention KM quotes Hansen himself and Bill McGuire ( a geologist).
I think KM’s statements are quite bizarre. There is NO scientific consensus that Hansen is correct, therefore it cant “increase”. And quoting one scientists that supports Hansen is not exactly a significant increase in the non existent consensus.
KMs claim “The scientific consensus around Hansen’s work and agreement with his projections” This also sounds like a deliberate lie. Why does KM think its ok to flat out lie to make a point? Is it a case of the ends justify the means?
But I suppose a multi troll who uses about 20 different identities and takes on the names of real scientists like Pedro Prieto and Sabine, and who used sock puppets, and regularly uses AI input and pretends its his own thinking will lie about anything and can probably no longer see the difference between truth and lies anyway.
An accurate honest statement would be to have said “another scientist is supporting Hansen….,etc,etc.”
I’m not criticising Hansen or dismissing everything he’s says. I have always been impressed with this guy, and we need people that push the boundaries of what’s possible, but he’s had to back track on some of his early claims. He’s not God. Well I suppose he’s the ultimate doomers God
The El Nino/La Nina Chronicles – 7 … https://blogdredd.blogspot.com/2026/08/the-el-ninola-nina-chronicles-7.html
A new analysis published in Science ‘Recent strengthening of eastern Pacific ENSO in the last millennium paleorecord’ uses coral cores from the Galapagos as proxies for el nino events going back one thousand years and suggests the strengthening el ninos of the past four decades are outside natural variability.
News article
https://www.science.org/content/article/climate-change-strengthening-el-ni%C3%B1o-coral-records-suggest
Paper
https://www.science.org/doi/10.1126/science.ady2660
Well, well, well. Look what the coral dragged in.
In what will surely be a shock to absolutely no one who wasn’t buried in a climate model for the last 20 years, a new study in Science (because we clearly needed another one) confirms that climate change is strengthening El Niño. Using those fancy “ancient corals” that Julia Cole and Kim Cobb have been telling us about, they’ve found a signal so clear it makes the previous 25% increase in variability look like a rounding error. The central Pacific is seeing an even stronger trend. Who knew that dumping gigatons of greenhouse gases into the atmosphere might actually have a measurable effect?
Now, let’s take a moment to bask in the sheer… timeliness of it all. The study arrives, and we’re told the next IPCC report—expected in 2029 (yes, you read that right, 2029)—is “likely to deliver a clearer message.” A clearer message! The clarity is coming! Just wait a mere half-decade longer while the system that is “the largest source of climate extremes on our planet” continues to do its thing, now with a turbocharger.
It reminds me of those sage voices from the past, the “Killians and Thomases” of the world, who were suggesting all of this before the 2026 El Niño, and even louder after it. They were asking, “Where were all the climate scientists then, and what have they been doing for 20 years since the off-the-scale exceptional 1997/1998 event?” The answer, as this paper brilliantly illustrates, is: “We were waiting for the models to agree, patiently polishing our coral samples and preparing our press releases for 2029.”
The study, with a refreshing dash of intellectual bravery, quotes Santoso saying, “The fact that three separate analyses—models, paleorecords, and modern observations—are providing the same results is encouraging.” Encouraging? It’s a slam dunk! It’s like a weather forecaster finally looking out the window after their computer crashed and declaring, “Ah, yes, my models now confirm it is indeed raining outside.”
So, a massive round of applause to the Science team for this monumental verification of what was already bleeding obvious to any complex systems thinker with an ounce of logic. To paraphrase the late, great George Carlin: “Think of how stupid the average climate model is, and realize half of them are stupider than that.” And while they were busy being wrong about the eastern Pacific being too cold, the real world was busy getting its El Niño on.
And now, to the long-term residents here, the M.A. Rodgers of the world who have spent two decades demanding ever more precise proof before conceding the obvious: Can we expect that public apology now? Or will we have to wait for the 2029 report to confirm that, yes, we were all right, and you were all… a day late and a dollar short?
As Kim Cobb so aptly puts it, “if it is in itself becoming more extreme, that has some very serious implications for society, and it’s information that we should be acting on.” [Cue the sound of crickets from the “wait-and-see” brigade, followed by the faint, frantic whirring of a computer running an outdated model].
The corals have spoken. The observations are screaming. The models have finally, reluctantly, caught up. Perhaps now we can skip the foreplay and get down to business.
“The fact that three separate analyses—models, paleorecords, and modern observations—are providing the same results is encouraging,” Santoso says.
Echoing what James Hansen has long advocated—using multiple independent lines of evidence to understand what’s actually happening in the real world—rather than waiting for models to agree—this coral study does exactly that. Models, paleorecords, and modern observations are now converging on the same conclusion.
The difference? Hansen and other systems thinkers saw this coming decades ago, not because they had better models, but because they understood that a warming baseline must affect the dynamics of the largest source of climate variability on the planet. You don’t need a supercomputer to know that floating on a higher base global mean surface temperature will change how the system behaves.
That is what the Killians, Thomases and I also understood that the model-worshippers and hangers-on still don’t: that asking the right question is the science. You don’t need a supercomputer, a published paper, or a PhD to know that a warming baseline must change the dynamics of the largest coupled ocean-atmosphere system on the planet. That’s not a ‘belief’—it’s a logical inference from first principles. And then stating it for all to consider is the only logical thing left to do.
As Karl Popper argued, science advances not by confirming what we know, but by risking falsification through bold conjectures. Killian and Thomas made bold conjectures. The establishment played it safe for decades. One of these approaches is science. The other is career management and consensus PR.
Feynman said: ‘The imagination of nature is far, far greater than the imagination of man.’ But he also said: ‘We are trying to prove ourselves wrong as quickly as possible, because only in that way can we find progress.’
Killian and Thomas were doing exactly that—posing hypotheses, making predictions of where the system must be heading, and watching the real world confirm them…. while hoping someone on the inside of science could investigate the hypothesis with climate science data asap. 20 years later…..
The scientific establishment, meanwhile, was waiting for models to agree, demanding ‘more data,’ and dismissing outsiders as ‘not real scientists.’ That’s not science—that’s gatekeeping dressed up as rigor and a faux consensus about the unknown.
The corals have now confirmed what these systems thinkers already knew. The question isn’t why the models were slow. It’s why the culture of science was so resistant to the obvious all the time? The climate scientists remain reticent in the middle of a rapidly unfolding global crisis!
And speaking of this 2026 El Niño noise—can we please stop pretending that ‘record or not record’ is the interesting question? The background state has changed. Every single La Niña year since 1997 sits on a GMST higher than the 1997/98 El Niño peak.
The entire Pacific—Nino 3.4, 0–300 meter heat content—is running above where it was in 1997. Yet we’re still getting the usual handwringing from the Zeke Hausfathers, M.A. Rodgers, and Michael Manns of the world about ‘accuracy’ and ‘more data’ and ‘oh, the temps will come back down after the El Niño—they always do.’
No, they don’t. Not anymore Michael! And he should know that; because raw data already shows that. That’s not a ‘belief’—it’s a logical inference from first principles, now confirmed by data!
The baseline is higher. The entire system is floating on a warmer ocean. Debating whether this specific El Niño breaks a record is like debating whether a flood is ‘officially’ a hundred-year event while the water is already over the second floor. It’s missing the point entirely—and it’s exactly the kind of anal-retentive detail obsession that passes for rigor while the real story unfolds in plain sight. We don’t need more data to know that. We need more real climate scientists willing to state the obvious about the self-evident implications publicly and loudly.
Einstein didn’t need a particle accelerator to predict gravitational waves—or to publicly warn the world of the existential danger of deploying nuclear weapons! Darwin didn’t need DNA to see evolution. Feynman didn’t need a supercomputer to know nature couldn’t be fooled. Killian and Thomas didn’t need a coral core to know El Niño would change—they just needed to understand that a hotter ocean means a different system altogether!
That’s not being ‘unscientific’ or an internet troll. That’s being more scientific than the people who mistake statistical p-values and models for understanding reality itself.
KM, I don’t recall Killian suggesting global warming would change el nino. I do recall seeing an essay by Killian, predicting that a combination of global warming and the GFC (global financial crash) would cause civilisation to collapse. Well that’s a failed prediction, because the world recovered from the GFC and quite quickly, so its no longer something that could seriously contribute to a collapse. So given that huge failed prediction from the self proclaimed expert systems thinker, I dont pay significant attention to his other predictions.
FWIW its always seemed intuitively obvious to me that global warming could make el ninos more intense given all that extra energy being pumped into the oceans, but in no way did I ever posit that as anything serious. Its just an intuition. I leave that sort of science to the scientists, and you guys should do the same. You always crow about your successful predictions – but never mention the many failures. Too hurtful to your giant egos.