Site Google Custom Search

RealClimate logo

16 September 2007

Climate Insensitivity

Filed under: — group @ 9:31 AM

Guest post by Tamino

In a paper, "Heat Capacity, Time Constant, and Sensitivity of Earth's Climate System" soon to be published in the Journal of Geophysical Research (and discussed briefly at RealClimate a few weeks back), Stephen Schwartz of Brookhaven National Laboratory estimates climate sensitivity using observed 20th-century data on ocean heat content and global surface temperature. He arrives at the estimate 1.1±0.5 deg C for a doubling of CO2 concentration (0.3 deg C for every 1 W/m^2 of climate forcing), a figure far lower than most estimates, which fall generally in the range 2 to 4.5 deg C for doubling CO2. This paper has been heralded by global-warming denialists as the death-knell for global warming theory (as most such papers are).


Schwartz's results would imply two important things. First, that the impact of adding greenhouse gases to the atmosphere will be much smaller than most estimates; second, that almost all of the warming due to the greenhouse gases we've put in the atmosphere so far has already been felt, so there's almost no warming "in the pipeline" due to greenhouse gases already in the air. Both ideas contradict the consensus view of climate scientists, and both ideas give global-warming skeptics a warm fuzzy feeling (but not too warm).

Despite the celebratory reaction from the denialist blogosphere (and U.S. Senator James Inhofe), this is not a "denialist" paper. Schwartz is a highly respected researcher (deservedly so) in atmospheric physics, mainly working on aerosols. He doesn't pretend to smite global-warming theories with a single blow, he simply explores one way to estimate climate sensitivity and reports his results. He seems quite aware of many of the caveats inherent in his method, and invites further study, saying in the "conclusions" section:

Finally, as the present analysis rests on a simple single-compartment energy balance model, the question must inevitably arise whether the rather obdurate climate system might be amenable to determination of its key properties through empirical analysis based on such a simple model. In response to that question it might have to be said that it remains to be seen. In this context it is hoped that the present study might stimulate further work along these lines with more complex models.

What is Schwartz's method? First, assume that the climate system can be effectively modeled as a zero-dimensional energy balance model. This would mean that there would be a single effective heat capacity for the climate system, and a single effective time constant for the system as well. Climate sensitivity will then be

S=τ/C

where S is the climate sensitivity, τ is the time constant, and C is the heat capacity. Simple!

To estimate those parameters, Schwartz uses observed climate data. He assumes that the time series of global temperature can effectively be modeled as a linear trend, plus a one-dimensional, first-order "autoregressive" or "Markov" or simply "AR(1)" process [an AR(1) process is a random process with some 'memory' of its previous value; subsequent values y_t are statistically dependent on the immediately preceding value y_(t-1) through an equation of the form y_t = ρ y_(t-1) + ε, where ρ is typically required to be between 0 and 1, and ε is a series of random values conforming to a normal distribution. The AR(1) model is a special case of a more general class of linear time series models known as "Autoregressive moving average" models].

In such as case, the autocorrelation of the global temperature time series (its correlation with a time-delayed copy of itself) can be analyzed to determine the time constant τ. He further assumes that ocean heat content represents the bulk of the heat absorbed by the planet due to climate forces, and that its changes are roughly proportional to the observed surface temperature change; the constant of proportionality gives the heat capacity. The conclusion is that the time constant of the planet is 5±1 years and its heat capacity is 16.7±7 W • yr / (dec C • m^2), so climate sensitivity is 5/16.7 = 0.3 deg C/(W/m^2).

One of the biggest problems with this method is that it assumes that the climate system has only one "time scale," and that time scale determines its long-term, equilibrium response to changes in climate forcing. But the global heat budget has many components, which respond faster or slower to heat input: the atmosphere, land, upper ocean, deep ocean, and cryosphere all act with their own time scales. The atmosphere responds quickly, the land not quite so fast, the deep ocean and cryosphere very slowly. In fact, it's because it takes so long for heat to penetrate deep into the ocean that most climate scientists believe we have not yet experienced all the warming due from the greenhouse gases we've already emitted [Hansen et al. 2005].

Schwartz's analysis depends on assuming that the global temperature time series has a single time scale, and modelling it as a linear trend plus an AR(1) process. There's a straightforward way to test at least the possibility that it obeys the stated assumption. If the linearly detrended temperature data really do behave like an AR(1) process, then the autocorrelation at lag Δt which we can call rt), will be related to the time constant τ by the simple formula

rt)= exp{-Δt/τ}.

In that case,

τ = - Δt / ln(r),

for any and all lags Δt. This is the formula used to estimate the time constant τ.

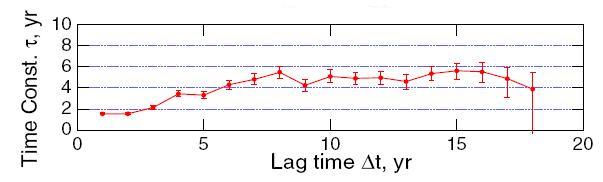
And what, you wonder, are the estimated values of the time constant from the temperature time series? Using annual average temperature anomaly from NASA GISS (one of the data sets Schwartz uses), after detrending by removing a linear fit, Schwartz arrives at his Figure 5g:

Using the monthly rather than annual averages gives Schwartz's Figure 7:

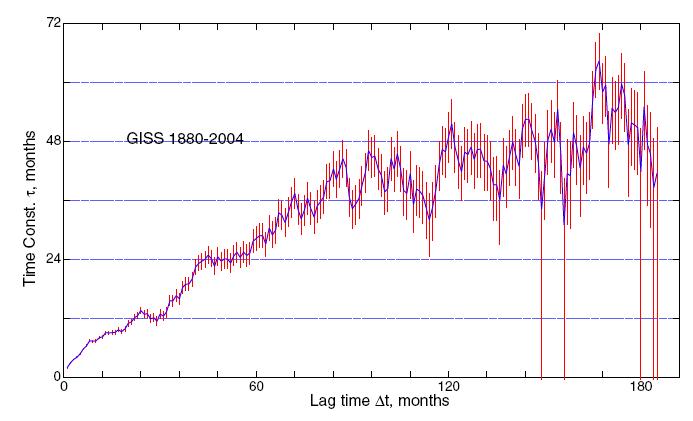
If the temperature follows the assumed model, then the estimated time constant should be the same for all lags, until the lag gets large enough that the probable error invalidates the result. But it's clear from these figures that this is not the case. Rather, the estimated τ increases with increasing lag. Schwartz himself says:

As seen in Figure 5g, values of τ were found to increase with increasing lag time from about 2 years at lag time Δt = 1 yr, reaching an asymptotic value of about 5 years by about lag time Δt= 8 yr. As similar results were obtained with various subsets of the data (first and second halves of the time series; data for Northern and Southern Hemispheres, Figure 6) and for the de-seasonalized monthly data, Figure 7, this estimate of the time constant would appear to be robust.

If the time series of global temperature really did follow an AR(1) process, what would the graphs look like? We ran 5 simulations of an AR(1) process with a 5-year time scale, generating monthly data for 125 years, then estimated the time scale using Schwartz's method. We also applied the method to GISTEMP monthly data (the results are slightly different from Schwartz's because we used data through July 2007). Here's how they compare:

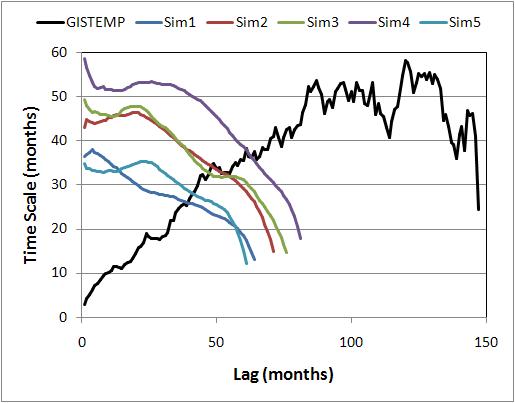
This makes it abundantly clear that if temperature did follow the stated assumption, it would not give the results reported by Schwartz. The conclusion is inescapable, that global temperature cannot be adequately modeled as a linear trend plus AR(1) process.

You probably also noticed that for the simulated AR(1) process, the estimated time scale is consistently less than the true value (which for the simulations, is known to be exactly 5 years, or 60 months), and that the estimate decreases as lag increases. This is because the usual estimate of autocorrelation coefficients is a biased estimate. The word "bias" is used in its statistical sense, that the expected result of the calculation is not the true value. As the lag gets higher, the impact of the bias increases and the estimated time scale decreases. When the time series is long and the time scale is short, the bias is negligible, but when the time scale is any significant fraction of the length of the time series, the bias can be quite large. In fact, both simulations and theoretical calculations demonstrate that for 125 years of a genuine AR(1) process, if the time scale were 30 years (not an unrealistic value for global climate), we would expect the estimate from autocorrelation values to be less than half the true value.

Earlier in the paper, the AR(1) assumption is justified by regressing each year's average temperature anomaly against the previous year's and studying the residuals from that fit:

Satisfaction of the assumption of a first-order Markov process was assessed by examination of the residuals of the lag-1 regression, which were found to exhibit no further significant autocorrelation.

The result for this test is graphed in his Figure 5f:

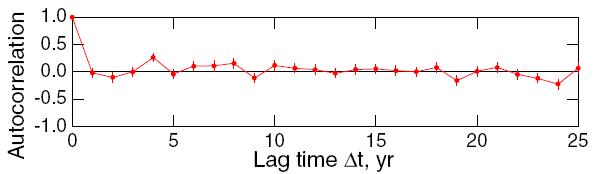
Alas, it seems this test was applied only to the annual averages. For that data, there are only 125 data points, so the uncertainty in an autocorrelation estimate is as big as ±0.2, much too large to reveal whatever autocorrelation might remain. Applying the test to the monthly data, the larger number of data points would have given this more precise result:

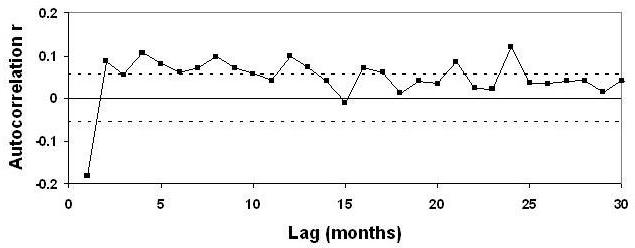
The very first value, at lag 1 month, is way outside the limit of "no further significant autocorrelation," and in fact most of the low-lag values are outside the 95% confidence limits (indicated by the dashed lines).

In short, the global temperature time series clearly does not follow the model adopted in Schwartz's analysis. It's further clear that even if it did, the method is unable to diagnose the right time scale. Add to that the fact that assuming a single time scale for the global climate system contradicts what we know about the response time of the different components of the earth, and it adds up to only one conclusion: Schwartz's estimate of climate sensitivity is unreliable. We see no evidence from this analysis to indicate that climate sensitivity is any different from the best estimates of sensible research, somewhere within the range of 2 to 4.5 deg C for a doubling of CO2.

A response to the paper, raising these (and other) issues, has already been submitted to the Journal of Geophysical Research, and another response (by a team in Switzerland) is in the works. It's important to note that this is the way science works. An idea is proposed and explored, the results are reported, the methodology is probed and critiqued by others, and their results are reported; in the process, we hope to learn more about how the world really works.

That Schwartz's result is heralded as the death-knell of global warming by denialist blogs and Sen. Inhofe, even before it has been officially published (let alone before the scientific community has responded) says more about the denialist movement than about the sensitivity of earth's climate system. But, that's how politics works.


370 Responses to “Climate Insensitivity”

  1. tamino Says:

    Hi!

    It looks like the graphs aren’t showing. I suspect it’s because the link to them has an extraneous “.” at the end of the url.

    [fixed, sorry–had to do w/ the different ways images are referenced in preview and publish mode w/ the updated wordpress software. -mike]

  2. Vern Johnson Says:

    It takes two to tango but I wonder how many of the readers of this blog genuinely understand the two contrasting arguments and are able to say anything at all about it that is meaningful. I, for one, cannot. Pretty soon, it seems, the “denialists” will be saying high CO2 levels are actually good for us. If human body lice studies are confirmed as indicating that not a single human wore clothing, not even animal skins, as recently as 169,000 years ago, then the average temperature globally must have been considerably warmer than it is now in African latitudes where most of us may have been located in those days. Humanity survived those high temperatures without technology of any kind, and without clothing. To that extent, surely we can adapt even better today if those high temperatures reoccur. Thus, though I do not fall into the denialist camp, nonetheless I would tend to be among those who are somewhat reassuring if the worst temperature rises do occur. But this is not an argument to do nothing. We do need clean energy. What we require is government to reward those who are willing to experiment with wind, solar, geothermal etc.so that those guys with hummers and their ilk actually pay much more to those of us willing to make the green enrgy investments. It’s time for government to get heavily involved in the process and not leave it up to the privatizers at all.

  3. Rod B Says:

    A sidebar: cherry-picking bits and pieces and declaring an “AHA! I TOLD YOU SO!” moment is not monopolized by the AGW antagonists; protagonists do their share.

    None-the-less, and coming from a skeptic (different from antagonist), while my initial gut response is dubious (though not yet backed up with any cogent analysis), it is a well-done admirable post. Much to think about.

  4. Tim Jones Says:

    Thanks for posting this rebuttal!
    Perhaps Mr. Schwartz should have passed this by such a rigorous test as above before he let go with his findings.

    Seems to me the empirical evidence puts ALL the climate modeling into catch-up mode. IPCC rainfall projections are questionable. Now this.

    What’a really worrisome is that the CO2 induced temperature rise we have now has been sufficient to trigger enough climate feedbacks and rapid ice melting as to make AGHG plus aerosols forcing just a component of impending changes.

    With China’s rapid industrialization adding to the CO2/aerosol triggers I don’t think dangerous climate change can be stopped.

  5. Ike Solem Says:

    The Schwartz paper refers to Levitus 2005, Warming of the world ocean, 1955–2003. It also seems to rely on a certain value for the ‘effective heat capacity of the oceans’:

    “The present analysis indicates that the effective heat capacity of the world ocean pertinent to climate change on this multidecadal scale may be taken as 14 +/- 6 W yr m-2 K-1. The effective heat capacity determined in this way is equivalent to the heat capacity of 106 m of ocean water or, for ocean fractional area 0.71, the top 150 m of the world ocean. This effective heat capacity is thus comparable to the heat capacity of the ocean mixed layer.” Other literature values are 35 +/- 16 W yr m-2 K-1 (Andrea 2005) and (3.2 - 65) W yr m-2 K-1, (Fram 2005).

    However, Levitus 2005 has much more to say on this matter:

    “There are three reasons one does not expect uniform heating of the ocean from the observed increase in atmospheric greenhouse gases. The first is that internal variability of the earth system (e.g., El Nino) may affect regional ocean heating rates in a non-uniform manner.”

    “The second is that the natural and anthropogenic aerosols are not well-mixed geographically and can have a substantial effect on regional warming rates. This has been documented for the northern Indian Ocean by Ramanathan et al. (2001a,b) who estimate a decrease of absorbed surface solar radiation exceeding 10Wm-2 over much of the Indian Ocean due to the presence of aerosols. The IPCC (2001) report also documents the geographical variability of various aerosols, ozone, black carbon, etc. that affect the amount of radiation available to enter the world ocean.”

    “The third reason is that any change in the earth’s radiative balance may induce global and regional changes in the circulation of the atmosphere and ocean which could in turn affect the net flux of heat across the air-sea interface on a regional basis.”

    What’s very unfortunate in the Schwartz paper is the following, however: “However in a subsequent publication a year later Lyman et al. [2006] reported a rapid net loss of ocean heat for 2003-2005 that led those investigators to estimate. . . a value much more consistent with the long-term record in the Levitus et al. [2005] data set.”

    That’s just sloppy. That estimate was based on an error in the measurement system (floats) and was retracted. Either the author or the referees should have known that. Thus, there seem to be a lot of assumptions about ocean heat uptake which lead to the unsupported conclusion that there is ‘rapid equilibration of the climate system to applied forcings’.

  6. John P. Reisman Says:

    To the non scientific eye it might appear, without further examination or considerations, this paper by Stephen Schwartz is a handy way to look at the science of global warming.

    Myself, not being an expert but of reasonably sound mind and body (sort of) looking at it with what might be considered common sense, see something else. So at the risk of oversimplifying this, I thought I would take a stab at it.

    Cause and effect relationships are hardly simple in complex systems with extensive dynamics that compile and interact with each other. Examining a simple view to return a simple result may have advantages for understanding aspects of a system, but hardly the overarching implications or affects in a system that has systems from which it derives energy and interactions, and subsystems that reach from macro to micro systems all interacting, at all levels, with ramifications extending in influence in relation to the magnitude and reach of their influence. These systems react upward into parent systems, and downward into sub-systems, as well as interacting with collateral systems. Climate is anything but simple.

    The old adage comes up: “You know why they call them weather men… they don’t know whether it’ll rain or not”.

    That in mind, reasonable conclusions in cause and effect, inertia and logic can give one a modicum of insight into possibility or even probability. So let’s take a look at what it looks like this study seems to represent within the scope of its limits and extent.

    If I were to roll a ball down a hill 10 feet and measure with precision the distance, speed direction and behavior of the ball in that span of time and distance, I could describe the observations fairly accurately. But if I don’t take into account that the hill is 10,000 feet long and steepens along the way, and has varying slopes and a multitude of obstacles; predictability on exact behavior dissipates into probabilities (so it is reasonably hard to see into the future) based on the complexity of ones understanding of the physics involved and any other predictable or potential factors, one might figure out that precise outcomes are hard to predict. However, one can reasonably predict the ball with go down hill, and likely speed up as it goes. Depending on the complexity or number of things it can bump into along the way one might see that it could cause an avalanche or some other cascade effect. The inertia of the ball will likely increase and there may even be some lag effects, like it bumps a little rock that might roll down another way and hit some other rocks that may or may not cause some really big rocks to go bump something else (and there are lots of opportunities for it to bump into things along the way).

    You might assume that the ball hits a tree or gets stuck between two rocks 20 feet down the hill… But then, it really depends on the size of the ball and any obstacles that might get in its way, doesn’t it? The thing you know though, is that it’s a hill, and it goes down from the top. You don’t have to me a rocket scientist to figure this out.

    So while I have drawn no conclusions, maybe I painted a picture that helps us understand the limited scope of a particular study, in this case, a ball rolling 10 feet down a 10,000 foot hill.

    P.S. It seems more that reasonable to believe that the global climate ball has been given some added weight in the form of added greenhouse gases. To assume that this is a little ball with little effect over time seems to be more neurotic than realistic in consideration of the preponderance of the evidence as understood in the aggregate earth system, and known influencing factors.

  7. Halldor Says:

    Thanks for a very clear post.

    At the last fall AGU meeting I saw the last few minutes of a presentation on this (OS11: Empirical Determination of the Time Constant, Heat Capacity, and Sensitivity of Earth’s Climate System, by Stephen E Schwartz). In the question period the presenter was asked why climate models showed different results. His response was that this was the responsibility of modellers, not his. - And now we know why.. - great post!

  8. mz Says:

    Umm, this isn’t right:
    heat capacity is 16.7±7 deg C / (W/m^2), so climate sensitivity is 5/16.7 = 0.3 deg C/(W/m^2).

    [Response: thanks, yes we’ve fixed. -mike]

  9. Martin Vermeer Says:

    Tamino,

    I suspect you got the units wrong on the heat capacity:

    16.7±7 deg C / (W/m^2)

    Shouldn’t that be

    16.7 +/- 7 Wa/(m^2 deg C)

    (i.e., energy content change per temperature change, for one square metre)?

    (So to be pedantic, this is “heat capacity surface density”)

    [Response: Correct, see above. -mike]

  10. pianoguy Says:

    Funny how much authority denialists give to models when they cast doubt on the scientific consensus.

    No, I suppose it’s not funny at all…

  11. Martin Vermeer Says:

    Actually I see something good in this too: even if you over-simplify the
    modelling to the point of cruelty to animals, the data will
    still give you a sensitivity result that’s in the right ballpark…
    meaning that this sensitivity is a pretty robust property of the climate
    system.

  12. Dave Rado Says:

    Good article.

    There’s a typo: “In such as case” should be “In such a case”.

    Also, it would be nice to know who Tamino really is.

    Dave

  13. David B. Benson Says:

    Vern Johnson(2) — The paleoclimate 169,000 years ago was glacial, in the previous galcial maximum period. So it is extremely unlikely that Africa was anything but, on average, a few degrees cooler than now.

    During the previous intergacial, the Eemian, around 125,000 years ago, the sea stand rose to about 5 meters above today’s, suggesting that Africa might have been slightly warmer than now.

  14. Dave Rado Says:

    Re. #2, I don’t follow your argument. The issue is not whether the human body can cope with higher temperatures, but whether today’s human civilisation (and ecosystems) can cope with the (probably unprecedently) rapid changes that are likely in the next 100 years. For instance, 169,000 years ago, correct me if I’m wrong, but I don’t believe there were millions of people living in huge built-up coastal cities. Many of these cities will be submerged ice melt continues at its current rate (which is already greatly outstripping the highest-end IPCC projections - e.g. see
    here
    .

  15. Jim Cross Says:

    Is there a possibility we could get Schwartz’s comments on this on this site?

  16. Aaron Lewis Says:

    Thanks for the review. Now any insights on how Schwartz came publish such a paper, and how it passed peer review? For example, did someone in a funding agency request this study?

  17. Alastair McDonald Says:

    It shows more about the stupidity of the scientific community and RealClimate scientists in particular, that they are more concerned about a paper containing the ramblings of an idiot who cannot see global warming is happening, than they are by the melting of the Arctic ice cap.

    The loss of the Arctic sea ice is bound to cause a warming of the whole Arctic region, and lead to the melting of the Greenland ice cap, and a 7 m rise in sea level.

    But the scientists are tying themselves in knots, because they are locked into a search for a mythical holy grail - climate sensitivity. Sensitivity is a meaningless average, because global warming will not be spread over the planet in an even fashion, any more that it will rise each year by a small increment.

    The temperature rise that matters is in the continental regions where we live. Not in the 7/10ths of the surface (majority) which is covered in ocean.

  18. Steve Bloom Says:

    Re #12: Tamino leads a humdrum existence doing non-climate-related time series analysis in his day job. I know who he is and can confirm his expertise. I’m sure Mike does and can as well.

    There is at least one other climate blogger in Tamino’s situation, i.e. not a climate scientist but with a substantial degree of relevant expertise, who maintains anonymity for the same reason: In this age of easy googling, they don’t want someone (e.g. an NSF grant manager) checking up on their professional activities only to find mostly just climate blog material, none of which is strictly relevant to their career and often gets a little, um, unprofessional in tone if not content. So please leave those masked persons to their anonymity.

    Re #15: To be fair to Schwartz, he threw in a huge caveat at the end of the paper, basically saying that his work amounts to an interesting idea that he would like the modelers to have a look at, but not expressing confidence that it would hold up under that examination. Be aware that journals do sometimes publish papers that are novel, provocative or otherwise amount to scientific outliers, which is a perfectly reasonable practice albeit a little confusing for us amateurs.

  19. Dave Rado Says:

    Off-topic, but James Hansen was interviewed by the BBC World Service today in “The Interview” series; it lasts just under half an hour. You can download it as a 12MB mp3 file here; or for the next six days you can listen to it on streaming audio here.

  20. Hank Roberts Says:

    I seem to be the only person who read both of Schwartz’s pieces and thought he was setting up the argument others have tried to make incoherently or politically — seeing if he could give it a fair expression that a refereed journal would pass. Kind of fleshing it out, standing it up against the wall and asking if anyone saw a target there worth shooting at.

    But I didn’t find anything in what he wrote that suggested he wanted to believe in his numbers.

  21. Wayne Davidson Says:

    #17 Allastair, its rather academic infighting which seems to fuel contrarian smiles, it was part of their original cigarette denial mode, confusion is bliss, yet more than 30% of the ice cap has melted already. Refuting such a paper is necessary nevertheless, I must add that the CO2 X2 sensitivity is about to pass the +1 C mark. In light of present situation I agree that that there is incredible apathy though, notice no film showing this wide open Arctic Ocean body yet, by any media source, but lots of cameras on silly things which need not be mentionned…

  22. Andrew Says:

    #2: “It takes two to tango but I wonder how many of the readers of this blog genuinely understand the two contrasting arguments and are able to say anything at all about it that is meaningful”

    I can’t say I read this blog all the time, but I can say quite a bit about time series, and many years ago, was closely associated with climate scientists.

    A: Even 20 years ago there was work on time series modeling of recent and paleoclimate temperatures (Ghil and Vautard, etc.) The tools of (then current) large scale Kalman filtering were well understood by climate scientists from the dynamic meteorology side of the game (I think Eugene Isaacson brokered some of that deal). The multitaper spectral analysis was already in the toolkit (the Thomson style multitaper stuff was brought in to the fistfight over whether Milankovic was the explanation of ice ages). If the answer were a univariate AR(1) model we would not have had to wait until 2007 to find that out; tools quite capable of indicating that have been carefully applied to these problems for decades. It’s frankly astonishing that Schwartz considers such a model at all. I’m sort of stunned that JGR had no referees poke him on that.

    B: Playing around with low dimensional time series and getting “no evidence of further autocorrelation” happens all the time, but is not probative. It is an unfortunate gap in understanding even in many people who actually consider themselves well informed on time series that they misuse standard tests for coefficient significance as if they indicate validity of inference using a reduced model. That is completely untrue, as simple examples can readily demonstrate. (And in this case, the comment here in realclimate indeed exposes the lack of faithfulness of the AR(1) model so I won’t have to give these examples).

  23. Dave Rado Says:

    If Hank is right (#20) Schwartz seems to be naive at best about the fodder he is giving to denialists, who are marketing both pieces very effectively and disingenuously. See also William’s blog post here and Inel’s response.

    Dave

  24. John Monro Says:

    Thank you Tamino for the work you have put in to examining Shwartz’s paper. All of the science and maths was way above my head, but at the end of the day, I have been convinced that the Schwartz paper doesn’t yet overturn the consensus on climate change and sensitivity.

    It would appear that Schwartz has put out an article for discussion and thought, nothing wrong with this, but perhaps, knowing how such a paper would be seized on by global warming sceptics, deniers and contrarians, the caveats should have come at the beginning and in large print?

    But it all goes to prove that if you want to keep up to date with the latest information and arguments about global warming, this is the place to come.

    Thank you team and commentators for your insight and efforts.

  25. Nigel Williams Says:

    Perhaps this topic should have been titled: Schwartzs Insensitivity.

    For so astute a scientist to even to begin to offer the undecided vote the hope of a trivially simple zero-dimensioned climate model and to settle on a process that comes up with a climate sensitivity that is so far out of whack with recent more sound calculations shows a truly naive insensitivity to the critical state of the climate-change dialogue. Totally unhelpful. Poor show old chap.

  26. Rod B Says:

    “…knowing how such a paper would be seized on by global warming sceptics, deniers and contrarians, the caveats should have come at the beginning and in large print?…”

    Just musing: why should skeptic caveats be any different than protagonists’ caveats?

  27. Chuck Booth Says:

    Re # 17 Alistair McDonald: “It shows more about the stupidity of the scientific community and RealClimate scientists in particular, that they are more concerned about a paper containing the ramblings of an idiot … than they are by the melting of the Arctic ice cap.”

    On what basis can you conclude that the scientists in question are more concerned about the former than the latter? The RC moderators have stated time and time again (and a glance at their bios will confirm this) that they have day jobs, and run this site in their spare time. I’m sure most people think about hundreds, if not thousands, of different subjects during an average day. There is no reason climate scientists can’t interrupt their thinking about the melting of the Arctic ice cap (or whatever area their research focuses on) and start thinking about a peer-reviewed paper in a mainstream scientific journal by a well-established scientist dealing with global warming.

  28. James Says:

    Re #2: [If human body lice studies are confirmed as indicating that not a single human wore clothing, not even animal skins, as recently as 169,000 years ago, then the average temperature globally must have been considerably warmer…]

    This does not follow. The human body is quite capable of adapting to, and even being fairly comfortable in, a much wider range of temperatures than the average “civilized” person might believe. See for instance Darwin’s accounts of the naked inhabitants of Tierra del Fuego…

  29. Dodo Says:

    Re 20. Whether Schwartz “believes” in his numbers or not - why should that be relevant? But strangely there seem to be many who think science is about belief and not about whose evidence is better.

    In a way, keeping Tamino’s identity secret may be good, so that his person may be kept out of the debate. Turning the whole scientific discourse into an anonymous or pseudonymous exchange could well be recommended: no more ad homs.

  30. Tim Jones Says:

    Ref #21 “…In light of present situation I agree that that there is incredible apathy though, notice no film showing this wide open Arctic Ocean body yet, by any media source….”

    See: http://www.esa.int/esaCP/SEMYTC13J6F_index_0.html

  31. Thomas Palm Says:

    I’m curious about the effect it has on researchers that their papers can be sized and used for political propaganda in ways that totally misrepresent them or make a certainty out of a deliberately speculative result. Do you manage to ignore that background noise and only publish for other scientists as in most other fields, or are potentially interesting papers canceled because they may be abused? In normal science you are usually remembered for your good papers while the bad ones are quickly forgotten, but in climate science you risk having your worst paper become the most widely known.

    I too would be eager to hear a response from Schwartz both on the science and what he thinks about the way his paper is being used.

  32. Biff Vernon Says:

    Re #2 Vern Johnson suggests that leck of clothing is evidence of warmer temperatures. Darwin give a great description of his encounter with the folk of Tierra del Fuego. The were completely naked, the sleet melting on a womans bosom as she suckled her infant.

    No, the weather hasn’t got colder, it’s we who have grown soft :)

  33. Alan Says:

    Yes, yes, all well and good, but is the recent Artic data the first “tipping point”? - Sorry just listened to the Hansen audio link above and to be honest even though I have a BSc this story is not worth the effort of trying to understand, from my point of view the paper in question is just one amoungst many and will be shot down in a hail of negative cites, OTOH it would be fine for a “Friday roundup”.

    Anyway, looking forward to RC’s take on all the N.W Passage stories that are quoting some trully “alarming” data for ice coverage (if you read carefully and do some naive math).

  34. Joe Romm (ClimateProgress.org) Says:

    Thanks for doing this debunking. I also have a three part series on this subject at ClimateProgress that begins here: http://climateprogress.org/2007/08/21/are-scientists-overestimating-or-underestimating-climate-change-part-i/

    [Response: thanks for the heads up Joe, very nice piece. Can you link parts 2 and 3 for our readers too? thanks! -mike]

  35. rasmus Says:

    Would it not be a good idea to apply Schwartz’s method to GCM results, for which we already know the climate sensitivity? I wonder if the method gives consistent results with the model climate sensitivities.

    [Response: Rasmus, indeed! James Annan has already taken a stab at this. And there is more in the pipeline (submitted to JGR), as Tamino alludes to in his piece. -mike]

  36. Thomas Palm Says:

    Re #34 James Annan did such a check against climate models:
    http://julesandjames.blogspot.com/2007/08/schwartz-sensitivity-estimate.html

  37. Lawrence Brown Says:

    This was helpful. Thank you. It raises the question why a reputable researcher would make simplified assumptions such a single heat capacity and a single time scale for all of Earth’s sphere’s when there are such large differences for land surface, atmosphere and ocean, and expect it to fly.
    We were alerted in a paper by Gavin “Learning From a Simple Model” http://www.realclimate.org/index.php/archives/2007/04/learning-from-a-simple-model/
    on April 10, about flim flam detectors - that when someone does a simplified calculation to prove everyone wrong we should subject it to more critical scrutiny. which Tamino has done.
    This is indeed the way science should work.

  38. J.S. McIntyre Says:

    re #2

    Pretty soon, it seems, the “denialists” will be saying high CO2 levels are actually good for us.
    ================

    They’ve been doing this for a while, actually.

  39. Robert Edele Says:

    Schwartz claims that their model is able to work with a time-varying changing in forcing. My understanding is that with an exponentially growing forcing, one cannot figure out the time constant from the temperature data alone, as there are an infinite number of valid solutions, some with longer time constants and higher heat capacities, and some with shorter time constants and lower heat capacities.

    Only once the forcing leaves the exponential track (which it has roughly followed for over a century) will one have any hope of getting the time constant from just the temperature series alone. Even then the model of the Earth as a giant capacitor is oversimplified and unlikely to be very accurate.

  40. SteveSadlov Says:

    A third alternative approach to looking at this. GHG forcing is a signal and the climate system is a filter. The fundamental question remains, what is the nature of the filter? We have some clues about it, but as yet, do not fully understand all of its characteristics. So called “denialists” are arguing that the characteristics of the filter are such that the GHG forcing transient is eithter being filtered out, or, is being overcome by negative feedback. So called “alarmists” are arguing that the transient has overexited the system into a state where it is out of the safe operating area. What is most likely? Probably an intermediate case. My own educated guess is that there is measurable sensitivity to GHG forcing. I also guess that had we continued on a global development path that followed to paradigm of say, the Western countries 100 years ago, we’d already be in seriously deep doo doo, right now - in a hellish world. As it turned out, we became more refined in our approach and have managed thus far to avoid such a horrid outcome. If the current sociolpolitical trends hold, there will be an ever tightening screw of reduced energy consumption in advanced Western democracies. My guess is, partial pressure CO2 will top out 50 - 150 years from now and will enter into a steep decline. Global cooling may actually be incited, assuming that other forcings have not already begun it. A lot can change between now and then, and, the world may go through a hellish phase along the way. Or not …

  41. Jeffrey Davis Says:

    I read the James Annan criticism linked to above in and it pointed out that at the 2stdev level the calculated sensitivity from the Schwartz study was around 4.5C.

    In fact, the 16%-84% probability interval (the standard central 68% probability interval corresponding to +- 1sd of a gaussian, and the IPPC “likely”) of this quotient distribution is really 0.18-0.52K/W/m^2 (0.7-1.9C per doubling) and the 2sd limit of 2.5% to 97.5% is 0.12-1.3K/W/m^2 (0.4-4.8C per doubling). While this range still focuses mostly on lower values than most analyses support, it also reaches the upper range that I (and perhaps increasingly many others) consider credible anyway. His 68% estimate of 0.6-1.6C per doubling is wrong to start with, and doubly misleading in the way that it conceals the long tail that naturally arises from his analysis.

    That doesn’t sound like earthshaking heresy.

  42. Richard LaRosa Says:

    We are dealing with a nonlinear problem which keeps changing as ice melts and greater area of water is exposed, raising the solar absorption. Also glaciers sliding on under-ice rivers and lakes don’t lend themselves to single time constants for the whole Earth.

  43. dallas tisdale Says:

    Tamino, just for grins try 72 to 84 months with your models and see how things move around.

  44. Jerry Says:

    Re #17

    This type of post is uncalled for.

  45. David B. Benson Says:

    Jerry(43) — I agree. Tamino has performed a clear, useful, volunteer service.

  46. Hudson Pace Says:

    E.g. #16 - the question of whether it was right that Schwartz’s paper be published. Surely the important question now is how he responds to the criticisms? If he engages in a serious debate, he’ll almost certainly arrive at a position a long way from the one set out in the paper. That will cut the ground from under the feet of the sceptics - though we all know by now that they’ll just keep blathering on anyway.

  47. dallas tisdale Says:

    39 CO2 forcing is a LN function not exponential function, that is why this subject is being debated. If both poles were showing similar temperature trends, there would not be a debate. There is a debate, however misguided you feel the other side may be, because some parts of the complex system being modeled are behaving in a manner that is somewhat confusing.

    Many “skeptics” do not deny warming, only question the rate and impact of the various potential causes. A lot depends on your frame of reference.

  48. Lawrence Brown Says:

    In # 17 Alistair says in part “The temperature rise that matters is in the continental regions where we live. Not in the 7/10ths of the surface (majority) which is covered in ocean.”

    Have you forgotten that the warming of the oceans causes more water to evaporate into the atmosphere causing further warming? Or that the warming of the surface waters in the tropical Atlantic is suspected of giving us future hurricanes of greater intensity? The warming of the oceans past a certain threshold also has a detrimental effect on coral reefs and the biota that live in and around them.

    All of the Earth’s components are interrelated in one way or another.Think of it this way. None of us live on the ice in Greenland.So what do we care if it melts?

  49. Lawrence Brown Says:

    Re 18: “To be fair to Schwartz, he threw in a huge caveat at the end of the paper, basically saying that his work amounts to an interesting idea that he would like the modelers to have a look at, but not expressing confidence that it would hold up under that examination. Be aware that journals do sometimes publish papers that are novel, provocative or otherwise amount to scientific outliers, which is a perfectly reasonable practice albeit a little confusing for us amateurs.”

    What you say is true,Steve,yet some public figures,like Senator Imhofe, a modern day Lysenko,for all of me, glom on to these hypotheticals like a drowning man grabs for a rope. It’s important that short cuts that don’t simulate true values be thoroughly analyzed and if they don’t fit, nipped in the bud, mainly for this reason.

  50. Joe Romm (ClimateProgress.org) Says:

    Mike — thanks for the kind words at #34. In response to your request, I’ll give all three posts here. They examine

    (1) the evidence scientists are NOT overestimating climate sensitivity
    http://climateprogress.org/2007/08/21/are-scientists-overestimating-or-underestimating-climate-change-part-i/

    (2) the evidence scientists are seriously UNDERestimating climate sensitivity (because of unmodeled carbon cycle amplifying feedbacks)
    http://climateprogress.org/2007/08/22/are-scientists-overestimating-or-underestimating-climate-change-part-ii/

    (3) how these omissions suggest the climate has a “point of no return” that severely constrains the safe level of human-generated emissions.
    http://climateprogress.org/2007/08/23/are-scientists-overestimating-or-underestimating-climate-change-part-iii/

  51. Goedel Says:

    Re 49:
    Cutting every paper that presented alternative approaches would have a chilling effect on the science. You can’t just start treating scientific papers like op-ed pieces, even if some other people/senators/etc choose to.

  52. ray ladbury Says:

    Re 50. Goedel, I take it you haven’t been to too many scientific conferences. Schwartz published a paper that was half-baked. He is being criticized for that–that’s science. No one has attacked his motives, his character or cast aspersions on his parentage. He will emerge from this burned but with his scientific reputation intact.
    Re #47. Dallas, I would be more charitable toward the “skeptics” if they didn’t throw themselves at every crackpot theory that came along, only to abandon it when it becomes clearly untenable and latch onto the next. Or abandon theories altogether and say that a warmer world will be good for us. Maybe I’d be more sympathetic if they published in peer-reviewed scientific journals (as Schwartz did–a lame paper, but at least peer reviewed) rather than the Wall Street Journal Op Ed page. Or maybe I’d be more sympathetic if they didn’t keep cycling through the same tiresome, thoroughly refuted arguments over and over–or hell, if they’d just learn some science.

  53. Rod B Says:

    Gee, the near-frenzied reaction here to a serious scientist boring a couple of little test holes in the theory is a sight to behold. I can kinda understand the reaction to some of the skeptics also going ga-ga the other way, but, really! Why don’t you just quietly write him off as an outlier like Al Gore would?

  54. Timothy Chase Says:

    Goedel (#50) wrote:

    Re 49:
    Cutting every paper that presented alternative approaches would have a chilling effect on the science. You can’t just start treating scientific papers like op-ed pieces, even if some other people/senators/etc choose to.

    My own view comes in part just from observing what has taken place in evolutionary biology - particularly as it has been attacked by creationists of one stripe or another.

    Oftentimes the evidence for one thing or another will be tentative, and what may have been the dominant view at one time may give way to another. There will be a great many disagreements - and those disagreements can get misrepresented in such a way that it will sound like they are uncertain of whether or not evolution took place, or like there is no solid evidence, or perhaps it will just be a certain turn of phrase or provocative way of expressing an idea that when ripped out of context can make it sound like the entire foundation of evolutionary biology is crumbling or turned to dust long ago.

    Stephen J. Gould was often the object of these sorts of misrepresentations (the infamous “absence of transitionals” remark where he was arguing against gradualism and in favor of punctuated equilibria springs to mind) - as has been Richard Dawkins and a great many others. In fact an entire cottage industry was built out of this sort of thing in which entire books of misquotations were assembled for the purpose of smearing the science. Evolutionary biologists even have a term for this creationist practice: “quote-mining.”

    What do you do in the case of such ideologically-motivated misrepresentation? Never admit to any disagreements? Never admit to any uncertainties or reversal of views? Never try to express things in a paradoxical manner that illuminates one aspect or another in a thought-provoking manner?

    No.

    You go about your business just exactly as you would in the absence of such politicization. To do otherwise by trying to downplay disagreements, uncertainties or simply forgoing those shiny little turns of phrases would be to let the creationists distort the science. If you downplay the disagreements or uncertainties you will transform by imperceptible degrees the science into just the sort of dogma the creationists would raise in its place. And if you are constantly worrying about how you express your ideas so as to avoid misrepresentation then you will be less able to devote your attention to the ideas themselves and to communicating them most effectively.

    That has to be your focus.

    *

    Now in the current context, sure, the essay probably should have been caught by peer review. Better yet, the author should have floated the paper past some individuals more familiar than he himself was. But that isn’t censorship. That is just how science is done.

    Judging from what I have seen in terms of criticism, the paper wasn’t that well thought-out. There are plenty of papers which don’t get published - and like other authors, scientists have to get used to rejection. It comes with the territory. Peer review is intended to insure that those which do get published are those of higher quality. But sometimes it doesn’t work that well. This would appear to be one of those instances.

    However, with regard to the more innovative papers, it is quite possible that they will be turned away by one reviewer or journal, but there will be others. And just about any journal of caliber will want to publish the more cutting-edge papers that people will be refering to twenty years from now. Thats how they attract readers - and that is how they attract authors.

    *

    Anyway, I am not sure that I am disagreeing with either you or the individual that you were responding to. But I figured I would share my thoughts.

  55. Dave Rado Says:

    Re. #46:

    Surely the important question now is how he responds to the criticisms?

    I agree. And I’m very disappointed with the way he responded to Forster et al’s reply to his misplaced criticisms of the IPCC projections - in his response he appears to have missed the point entirely.

    re. #53, he hasn’t bored any holes (read Tamino’s article), but the blogosphere and some sections of the media are full of misleading attempts to pretend that he has.

  56. James Annan Says:

    I’ve weighed in here with a more detailed look at some other aspects of the analysis, if anyone is interested.

  57. Nick Stokes Says:

    I’m surprised that little attention has been paid to this Schwartz passage, starting at the bottom of p 13

    Has the detrending, by imposing a high-pass filter on the data, resulted in a value of τ that is artificially short? To examine this I carried out the same analysis on the non-detrended data as on the detrended data.As expected, this analysis resulted in estimates of the relaxation time constant that were substantially greater than the estimate obtained with the detrended data. However these estimates differed substantially for different subsets of the data: 15-17 yr for each of the data sets as a whole, 6 to 7 yr for the first half of the time series (1880-1942), and 8-10 yr for the second half of the data set (1943-2004).

    The answer to the first question is a big yes. And without detrending, he gets an answer consistent with other modelling! True, the subsets give inconsistent results, but that just shows Tamino’s point about the inadequacies of an AR1 model.

  58. Wayne Davidson Says:

    A couple of thoughts, Alastair predicted a rapid melting of the Arctic Ocean ice cap, and I share his frustration that very little attention is given to this apparent step up in a strong warming trend. #30, Tim, ESA did a splendid job in that piece, but it fails to connect, resonate with the lay. A film, a reporter or a scientist here on the edge and over of what is left of the last summer polar ocean ice sheet would carry a whole lot of interest. Its something that some scientists fail to understand, the process of communicating science must be done in terms of common denominators, in this case reach as many people as possible, especially reason with them in immediate totally sincere term (filming reality), in this case capturing nothing but sea water where ice use to be.

    More a propos, Schwartz idea of using heat capacity of the atmosphere has merits, but not in the formulations he proposed. Heat Capacity has a direct relation with Lapse rates, its not a surface thing. There are strange lapse rate trends up here which are related to Cp. I have not read a paper dealing with this yet.

  59. pete best Says:

    Seems to me that this paper says more about peer review and scientific journals than anything else. Considering that this paper cannot possibly hold water in the light of close scrutiny and hence it makes you wonder about some of the scientific process. As the paper pertained to climate change (which is a political hot potatoe) it may have been that the journal decided to publish it to generate some publicity and to be held up a a beacon of denialists science. Another storm in a tea cup.

    On another note, I cannot believe the amount of ordinary people who simply cannot accept climate change as real due to the political process using it as a means of generating revenue via taxation.

    What a problem.

  60. Timothy Chase Says:

    Nick Stokes (#57) quotes Schwartz:

    Has the detrending, by imposing a high-pass filter on the data, resulted in a value of τ that is artificially short?…

    … then responds:

    The answer to the first question is a big yes. And without detrending, he gets an answer consistent with other modelling! True, the subsets give inconsistent results, but that just shows Tamino’s point about the inadequacies of an AR1 model.

    Nick, I believe you are going to like the post by James Annan which he points us to in #56. He approaches the same insight as Tamino, but from a complementary angle in which he looks at the distributions. He also suggests that Schwartz’s reaction so far to criticism has been less than exemplary.

  61. JoeMa Says:

    I’m a layman trying to understand this — would appreciate any comments or advice.

    My questions: is it correct that climate sensitivity is such that anthropogenic global warming started in the early 20th century (shortly after industrialization?). I often seen temperature graphs and atmospheric CO2 graphs showing that, e.g: http://www.aip.org/history/climate/20ctrend.htm#temp2002, and http://en.wikipedia.org/wiki/Image:Global_Carbon_Emission_by_Type.png

    Is the general scientific consensus that anthropogenic global warming started in the early 20th century?

    If so this would imply an extreme climate sensitivity, as the anthropogenic CO2 emissions during that period were very small relative to today. Would appreciate any comments or direction on this.

  62. Ray Ladbury Says:

    JoeMa,
    I do not think it is correct to say that it “started” in the 20th century. Certainly Arrhenius et al. had anticipated the effect in the mid to late 19th century. However, keep in mind that we expect warming to follow fossil fuel consumption, and most of the fossil fuel was consumed in the 20th century–at an exponentially rising pace.

  63. Alastair McDonald Says:

    What I am trying to say is that while Tamino, James Annan, Stephen Schwartz et al. are arguing about the gradient of a straight line drawn through the ups and downs of the global temperature record, the climate system itself is going over a tipping point!

    BTW. The reason that the SST has not shown a greater rise is because it has been cooled by the melting ice from the Arctic. Without that cold water flowing int them, not only will the warming of the oceans increase, the Arctic will also absorb more heat with an even greater rise in SST. The slow thinning of the Arctic sea ice over the last 20 year has masked the effects of global warming, just as it is supposed anthropogenic aerosols have.

    The problem is that the scientists get carried away with their fancy mathematics and forget that they are working with the real world which is fractal and defies simple approximations.

  64. guthrie Says:

    JoeMa- no, the scientific consensus is not that AGW started in the early 20th century. The warming at that time can be explained by changes in solar output and other forcings.

  65. Vernon Says:

    RE: 62 What tipping point? If you match the Arctic and Antarctic, less sea ice in the Arctic, more sea ice in the Antarctic. The north is getting warmer and the south is getting colder, which climate change theory predicts will happen.

  66. John M Says:

    I’m also a layman trying to the understand global warming. I realize this question may be off topic for this thread but I don’t understand this site well enough to figure out where to ask it.

    I’ve been looking at the AR4 report and apparently don’t understand the pictures at Chapter 3 pg 675 which seem to show the modeled signature of CO2 driven warming vs latitude as a higher rate of warming in the troposphere near the equator. This seems to conflict with the picture in the FAQ on pg 104 where the measured troposphere warming is lower in a band at the equator and higher toward the poles.

    Am I misunderstanding the pictures or is there some other effect that I don’t know about? (I apologize for the newbieness of the question but I don’t know where else to ask.)

  67. Timothy Chase Says:

    guthrie (#64) wrote:

    JoeMa- no, the scientific consensus is not that AGW started in the early 20th century. The warming at that time can be explained by changes in solar output and other forcings.

    Actually, according to NASA’s best estimates, the forcings due to anthropogenic greenhouse gases have exceeded the positive forcings due to solar variability as far back as the 1880s - although they were almost neck-and-neck at that point.

    However, climate sensitivity is approximately 3 C per doubling of CO2. We know that much from the paleoclimate record. Perhaps the biggest question mark at this point (besides political inertia) is positive feedback through the carbon cycle - which means we don’t have to worry about just our emissions, but what comes from the permafrost in the decades ahead as the globe warms, methane hydrates, and the possibility of the ocean becoming a net emitter - with its ability to absorb our emissions already declining.

    Of course it doesn’t help that we are seeing so much of the cryosphere melting away. Black carbon from our pollution - which may be responsible for much of the melt occuring in both the arctic and with the glaciers (e.g., the Tibetean Plateau). Not something “we” had to deal with before we got here - so the paleoclimate record may not be as helpful a guide in that respect.

    The pollution could actually help to get the positive feedback from the carbon cycle to kick in sooner rather than later by warming the northern latitudes. 3 C sensitivity is at equilibrium - after all the various feebacks between rising temperatures and the carbon cycle have taken place. We are a considerable distance from that equilibrium at this point, and that distance is growing with continued high emissions.

  68. Hank Roberts Says:

    JoeMa — also have a look at the Index (click at top of each page).

    This thread for example discusses “The hypothesis (Ruddiman, 2003) that early agriculture caused large enough emissions of greenhouse gases millennia ago to offset a natural climatic cooling ….”

    http://www.realclimate.org/index.php/archives/2005/12/early-anthropocene-hyppothesis/langswitch_lang/in

  69. John Finn Says:

    Can we make up our minds about the likely length(s) of any time lags. When Schwartz uses a relatively short lag to conclude a low sensitivity to forcing – that’s not right, but when Lockwood finds that any solar connection to climate change ended in 1987 (should be 1991 anyway) - it’s ok to assume no lag at all.

    Re #21 Wayne Davidson says

    I must add that the CO2 X2 sensitivity is about to pass the +1 C mark.

    I’m not exactly sure what this means or how the conclusion was reached. But we know it’s pretty much accepted that most (probably all) the warming before 1940 was solar driven and that ALL solar-related parameters (i.e. TSI, solar flux, cosmic rays etc) indicate that temperatures should be higher in the 1990s than in 1940. It seems a bit speculative, therefore, to make any assumptions with respect to CO2 sensitivity.

  70. Jack Roesler Says:

    I just googled this paper by Schwartz, and found this very informative article: http://gristmill.grist.org/print/2007/8/21/102318/112?show_comments=no

    The author, Joseph Romm, has given me much additional information to use in dealing with the deniers and skeptics that abound in my area. Once again, not the least of which are the radio talk show hosts, and their regular listeners and guests, who almost unanimously see AGW as being a hoax.

  71. Mike T Says:

    Alastair, #63, many of us are very frustrated that nothing seems to be getting done on what is the greatest problem facing mankind. First, recognize that scientists also do not want either the effects of global warming or the governmental actions that will be necessary to avoid it. It is both necessary to do the homework and the action of presenting the science and mathematics helps the scientists societally and mentally. Second, realize that extravagant fossil fuel use is being supported by the powers that be in the US and millions are being spent to maintain the energy status quo. Then go beyond these blogs and a lot is happening. Global warming is an everyday conversation now for millions of people. Much of the groundwork to accomplish some significant changes is being done quietly at this moment. Public opinion is also “fractal”. One big climatic event and massive change may be demanded by a populace now seemingly asleep at the controls.

    Will it come soon enough to avoid very bad things from happening? None of us know the answer to that. We can only hope and try not to be frustrated. I lecture on AGW when I can at the local high and middle schools to help both the students and myself. Good therapy. Highly recommended for all readers.

    Finally, good point on the Arctic SST rise and how it has been masked by the thinning of the sea ice.

  72. Jim Eager Says:

    Re 65 Vernon: “What tipping point? If you match the Arctic and Antarctic, less sea ice in the Arctic, more sea ice in the Antarctic. The north is getting warmer and the south is getting colder, which climate change theory predicts will happen.”

    The north and south polar regions are quite dissimilar. Where the Arctic is mostly (two thirds?) ocean surrounded by large continental land masses, with only Greenland supporting a permanent ice cap, the Antarctic is almost entirely a single large ice-capped land mass entirely surrounded by ocean. It’s therefore no surprise that the climate of the two polar regions is behaving quite differently.

    The melting of the Arctic ice sheet is a tipping point because it is changing the albedo of the Arctic, and will lead to the rapid warming of both exposed Arctic Ocean waters and the adjacent land areas, allowing them to release sequestered CO2 and methane, leading in turn to even more warming and an accelerated destabilizing of the Greenland ice cap.

    The melting of Antarctic sea ice and the more gradual warming of the West Antarctic peninsula, on the other hand, simply can not have a similar effect on a similar time scale. The ice mass of Antarctica, being ~8 times as large in area as Greenland’s, has a vastly greater damping effect, plus the unimpeded water and air mass circulation around the Antarctic continent further insulates it from the more rapidly warming seas and atmosphere of more temperate southern hemisphere latitudes. Moreover, there are no tundra stores of CO2 and methane beneath the Antarctic ice sheet to be released.

  73. catman306 Says:

    ‘All of the Earth’s components are interrelated in one way or another.’
    Comment by Lawrence Brown

    And the extremely complex interrelationships of the Earth’s components may not instantly reveal themselves. There are all kinds of time scales constantly interacting. So the effects of any change may not appear for hours, days, years, decades, centuries, millennia.

    I’d bet many skeptics concern themselves with the shorter time scales, quarterly or annual and don’t spend much time considering what may happen to their grandchildren’s world in a hundred years. Most people want to do the right thing, the correct action that will improve their lives and their family’s, but do they give much thought to the time horizon of their vision? That temporal dimension certainly effects what they judge to be ‘the right thing’. Doing the right thing now (like continuing to burn fossil fuel) may have disastrous effects years, decades or centuries from now. What an incredibly complex and dangerous experiment the Industrial Revolution has become for our species and environment. I fear that some of the most dramatic (to date) are just a few years away.

  74. Lou Grinzo Says:

    Great discussion here, even if 95% of it is way above my pay grade.

    I do have to wonder, though, how water vapor plays into all this as a feedback. I just read a press release (link below) about a new paper on this:

    “Using 22 different computer models of the climate system and measurements from the satellite-based Special Sensor Microwave Imager (SSM/I), atmospheric scientists from LLNL and eight other international research centers have shown that the recent increase in moisture content over the bulk of the world’s oceans is not due to solar forcing or gradual recovery from the 1991 eruption of Mount Pinatubo. The primary driver of this ‘atmospheric moistening’ is the increase in carbon dioxide caused by the burning of fossil fuels.”

    I notice that one part of the release says: “The atmosphere’s water vapor content has increased by about 0.41 kilograms per cubic meter (kg/m²) per decade since 1988, and natural variability in climate just can’t explain this moisture change.” There’s something wrong with those units–”cubic meters” vs. “m²”, isn’t there? Are they measuring a volume of atmosphere one square meter in area and stretching from the surface to the “top” of the atmosphere?

    http://www.llnl.gov/pao/news/news_releases/2007/NR-07-09-01.html

  75. SteveSadlov Says:

    RE: #47 - Further to that, it’s a damping coefficient problem. The coefficients themselves are likely a sum of lesser coefficients, some of them constants and some of them functions. An analogy might be a network of passive and active filters. The debate ought to be around what are the lesser coefficients, and, what is the type of damping. In other words, what is the system response to a transient in CO2 partial pressure that can be modeled as a step (although, in reality, a steep ramp with significantly broad frequency spectral content)

  76. Dave Rado Says:

    Re. 69, and attribution of forcings prior to 1940, see here. Solar forcings were certainly a major factor but to say “But we know it’s pretty much accepted that most (probably all) the warming before 1940 was solar driven” is simply wrong.

  77. Timothy Chase Says:

    dallas tisdale (#47) wrote:

    39 CO2 forcing is a LN function not exponential function, that is why this subject is being debated. If both poles were showing similar temperature trends, there would not be a debate. There is a debate, however misguided you feel the other side may be, because some parts of the complex system being modeled are behaving in a manner that is somewhat confusing.

    Dallas,

    Granted, CO2 forcing is logarithmic function of CO2 concentration. This is well-known and well-understood.

    However, there is nothing particularly inexplicable or confusing about the poles showing different temperature trends. The Southern ocean is part of the southern hemisphere, and as the southern hemisphere has more ocean to it, it has more thermal inertia. Land warms up more quickly than ocean. This too is well-known and well-understood.

  78. Lynn Vincentnathan Says:

    Not much time to read this, but had to say…..nobody reads caveats.

  79. Nigel Williams Says:

    A sense of urgency.

    I am impressed that the University of Kansas, is leading the Center for Remote Sensing of Ice Sheets with the development of the some of the best sensor systems yet for the analysis of the state of ice sheets.

    https://www.cresis.ku.edu/

    Yet, unfortunately, they are talking about deploying only one copy of their wonderful sensor on a yet-to-be build UAV and that may fly some time next year, or not.

    I note too that Professor Robert Correll has advised that parts of the Greenland ice sheet are exuding like toothpaste towards the sea at 15 kilometres per year.

    http://environment.independent.co.uk/climate_change/article2941866.ece

    and in the same article Finnish scientist Veli Albert Kallio points out that Predictions made by the Arctic Council, a working group of regional scientists, have been hopelessly overrun by the extent of the thaw.

    Five years ago we made models predicting how much ice would melt and when, said Mr Vallio. Five years later we are already at the levels predicted for 2040, in a year’s time we’ll be at 2050.

    Finally, I understand that, while there are some military hot-spots spluttering around the globe, most of the worlds airforces and navies are pottering about on a near-peace-time standing, but costing us the same, either way. Lots of boys and girls with nothing to do but salute it if it moves and paint it if it doesn’t.

    So on the one hand we have wonderful essential data-gathering sensors that are locked into an academic maze and underutilised resources to traverse air and sea, and in the other hand we have the sky falling around us.

    At the risk of being insensitive to the numerous very diplomatic and scientifically correct processes that are no doubt going on in the world to address the rapid changes that are occurring, as a citizen of this fragile planet I am bound to ask: Why are we messing about?!

    We haven’t got time to reinvent the wheel in the gathering of planet-critical climate-related data or to indulge some post-graduate project to create a single UAV - technically superb though it may be. We have to get these sensors in the air, on the ground and in the sea, and the data on the table at the UN and SOON! It doesn’t matter how efficient or otherwise the surveys are using manned aircraft or ships – they simply must be done; now, and again and again until the message is ringing through the halls of every government on this planet!

    If the Air forces and Navies of the world want to save the planet, then data gathering for climate change must be their primary missions.

    Hang numerous copies of University of Kansas’ CReSIS radar system under fighter-bombers and fly them supported by tankers for air-to-air refuelling. Send them to do 100km then 10km grids over Greenland and the Antarctic, and do it now!

    Add some Vietnam-type air-bourn sniffers to fly grids over the tundra with surface temperature and methane sensors as well. Why not?

    And in the oceans - how many data points do we have right now of salinity and temperature in the warming Arctic ocean? Do we know how deep the temperature anomaly is? Are we looking at the increased temperature penetrating the top 5mm, or is it the top 500m? What sort of mixing of the melt-water and the saline water is going on? Where is the boundary layer between fresh and saline? How much energy is stored there? To what extent is the temperature anomaly extending beneath the pack ice and frying it from the bottom up?? What impact is that having on algae and krill production?

    So do we have all the nuke subs of the US, UK, French and Russian navies doing transects along the meridians – Travel 10 NMiles, go deep, rise slowly to the surface recording temperature and salinity as they rise, punch data into spreadsheet, transmit data, submerge, repeat…??! Meet at the North Pole, shake hands, U-turn, repeat until they hit the coast of Antarctica, repeat…?? Why not – what else are doing that matters more?

    Come-on! Lets hit the deck a-running boys and turn this thing around!

  80. Lawrence Brown Says:

    RE #73 Catman says: “And the extremely complex interrelationships of the Earth’s components may not instantly reveal themselves. There are all kinds of time scales constantly interacting. So the effects of any change may not appear for hours, days, years, decades, centuries, millennia.”

    Very true. The carbon cycle alone operates on a number of time scales. The carbon reservoirs exchange carbon among the atmosphere,the biosphere,surface ocean waters and the land surface, and cycle on relatively short time scales. The exchanges between the deep ocean and deeper soil reservoirs are much longer. A quote from “Global Warming-The Complete Briefing” Third Edition by John Houghton(p.31) has this to say:”The large range of turnover times means that the time taken for a perturbation in the atmospheric carbon dioxide concentration to relax back to an equilibrium CANNOT BE DESCRIBED BY A SINGLE TIME CONSTANT(emphasis mine).Although a lifetime of about a hundred years is often quoted for carbon dioxide so as to provide some guide, use of a single lifetime can be very misleading.”

  81. Ike Solem Says:

    Perhaps this will be helpful to everyone who had trouble following the math (I did to, but I also thought this was very well written and clear - just requires slow reading). This post by Tamino is a really great overview of statistics in modeling for those unfamiliar with the topic (like me).

    From the post, “First, assume that the climate system can be effectively modeled as a zero-dimensional energy balance model.”
    What is a zero-dimensional energy balance model? See this site:
    http://www.soes.soton.ac.uk/research/groups/ocean_climate/demos/ebm/

    Why would anyone attempt to model the Earth climate system with such a simple model and expect to get a realistic answer? Not sure. However, it’s a nice teaching tool.

    I’m assuming that noone who reviewed the paper prior to publication followed ocean science (or read realclimate regularly). Nitpicking about the use of the results of Lyman et al as justification might seem petty, but science is all about nitpicking. In fact, Lyman et al caught their own error (really, the instrument error) and immediately brought it to people’s attention. That’s good science. How did that estimate make it into a paper published in Sept 2007? Not sure. Should have been sent to an oceanographer for review, and likely wasn’t?

    See: http://www.realclimate.org/index.php/archives/2007/04/ocean-cooling-not/

    As far as sea ice,
    thickness is at 1 m, 50% less than in 2001
    , which seems an odd comparison, as ice thickness records date back much farther. Here’s the sea ice extent record dating back to 1978. Why the recent lack of winter recovery? Increased poleward heat transport?

    The earlier record of sea ice extent is at http://psc.apl.washington.edu/thinning/Rothrock_Thinn.pdf (1999)

    “Comparison of sea-ice draft data acquired on submarine cruises between 1993 and 1997 with similar data acquired between 1958 and 1976 indicates that the mean ice draft at the end of the melt season has decreased by about 1.3 m in most of the deep water portion of the Arctic Ocean, from 3.1 m in 1958-1976 to 1.8 m in the 1990s.”

    Scientists predicted this back in 1980 - that’s about 25 year’s worth of deception and denial on the part of the fossil fuel lobby, I’d say. They’ll outdo the tobacco lobby at this rate.

  82. Smokeysmom Says:

    Just to satisfy my pure curiosity, can anyone tell me on what planet those people are living, who go into denial about the current, and unusually accelerated, warming trend? I’m quite sure that it isn’t the same planet I’m living on. I don’t have to be a scientist to observe changes in the growing and blossoming patterns of wildflowers, and changes in the behavior and habitation patterns of wild animals. Can anyone answer my question? Where ARE those people living?

  83. ray ladbury Says:

    Re #75. Steve Sadlov, Now wait just a dad-blamed minute. CO2 increase a step function? How about an exponentially increasing perturbation? Think maybe the response of the system might be a bit different to these two perturbations might be a bit different? Your “simplification” reminds me of a joke about a physicist who is asked to expound on milk production to a group of farmers and starts out, “Consider a spherical cow…”

  84. Rod B Says:

    Timothy (77): Admittedly, this is a little out of left field, but, while I agree the CO2 forcing function being logarithmic is known, I’m not so convinced it’s understood. I do see that it is pretty much accepted prima facie, though they always leave off the LN of the CO2 concentration ratio to the 5th or 6th power part (that pesky exponent in the equation seeems to vary a bit.) Then there is that sometimes log, sometimes linear business (which I at least partially understand). I have not seen anything that explains it fully and clearly, though maybe it’s been in front of me and I just didn’t catch it. Do you know any references that might help?

  85. Richard LaRosa Says:

    We can cool the ocean surface and overlying atmosphere with cold water that we pump up and spread carefully at the surface. The pumping power comes from a heat engine that uses the warm surface water as a heat source and the pumped-up cold water as a heat sink. Nutrients brought up in the cold water increase the biological productivity of the ocean. I have done some of the preliminary design. There’s lots of cold water down there, so this will buy us some time to work out additional partial solutions.

  86. Timothy Chase Says:

    John Finn (#69) wrote:

    Can we make up our minds about the likely length(s) of any time lags. When Schwartz uses a relatively short lag to conclude a low sensitivity to forcing – that’s not right, but when Lockwood finds that any solar connection to climate change ended in 1987 (should be 1991 anyway) - it’s ok to assume no lag at all.

    Lockwood acknowledges the possibility of a lag. However, any latent warming due to a given forcing will necessarily decelerate over time, not accelerate. And we are speaking of a forcing due to solar irradiance - not the build-up of greenhouse gases - assuming one is attempting to avoid the role of carbon dioxide.

    John Finn (#69) wrote:

    Re #21 Wayne Davidson says

    I must add that the CO2 X2 sensitivity is about to pass the +1 C mark.

    I’m not exactly sure what this means or how the conclusion was reached.

    I believe he was refering to the rise in the global average temperature due to anthropogenic carbon dioxide.

    John Finn (#69) wrote:

    But we know it’s pretty much accepted that most (probably all) the warming before 1940 was solar driven and that ALL solar-related parameters (i.e. TSI, solar flux, cosmic rays etc) indicate that temperatures should be higher in the 1990s than in 1940. It seems a bit speculative, therefore, to make any assumptions with respect to CO2 sensitivity.

    NASA Goddard Institute of Space Studies (2007) would suggest that well-mixed anthropogenic greenhouse gases have had a forcing which exceeded that of solar variation relative to 1880 for every year since but 1881.

    Please see the chart on page 26 of the following…

    Climate simulations for 1880-2003 with GISS modelE
    Hansen, et al. (Climate Dynamics, 2007)
    http://arxiv.org/ftp/physics/papers/0610/0610109.pdf

  87. Chris S Says:

    Reading all comments on this site is amazing. The ammount of knowledge and insight I obtained just reading this topic is amazing and yet frightening at the same time. The earthqaukes in greenland and the article about them, is more interesting. It hasn’t dawned on me untill tonight how badly the artic AREA is melting. You hear about the Artic Ice Cap the most, but not much news has been coming in from Greenland on the media side, yet through cliamte sites and blogs the evidence is alarming. This is “alarming” in itself. Someone else brings up this point. My job has CNN playing in the lobby all the time. I haven’t seen one piece on the record low artic sea ice content. It IS though, on CNN.com.
    What interests me the most is the statement in that article about the earthqaukes in Greenland bring up a question in my mind. Last semester in Geology I could have sworn I learned that the Pacific Tectonic Plate is grinding “northword” which created the Aluetion islands and Indonesian islands are from the plate driving westard. North westard. I wonder if these recent shifts in ice on greenland and higher ammounts of Isotatic activity are trigging the numerous earthqaukes in Indonesia this year, and their strong intesnities, especially the aftershocks which are usually associated with isotatic adjustment correct? I wish I was a scientist allready so I could have the resources and knowledge to figure this kinda of stuff by myself.

  88. Timothy Chase Says:

    Rod B (#84) wrote:

    Timothy (77): Admittedly, this is a little out of left field, but, while I agree the CO2 forcing function being logarithmic is known, I’m not so convinced it’s understood. I do see that it is pretty much accepted prima facie, though they always leave off the LN of the CO2 concentration ratio to the 5th or 6th power part (that pesky exponent in the equation seeems to vary a bit.) Then there is that sometimes log, sometimes linear business (which I at least partially understand).

    I didn’t say that you or I understood it all that well… ;-)

    However, radiation transfer theory is able to explain the shape of the absorption curve in terms of the lorentzian. This is something which is derivable from quantum mechanics. Additionally, we have the empirical data from spectral analysis which closely corresponds to this and is part of the MODTRAN database. Given how saturation begins at the peak then spreads out into the wings of the lorentzian one is able to derive a near logarithmic relationship for forcing due to carbon dioxide concentration.

    As the lorentzian has a near exponential dropping off of the absorption strength in the tail, this is what results in the near logarithmic behavior. However, where the tails of close absorption lines overlap, this relationship breaks down as does the logarithmic relationship between forcing and concentration. Where the near logarithmic relationship between forcing and concentration applies, given the distance we are from absolute zero, this translates into a nearly logarithmic relationship to temperature, such that doubling the carbon dioxide concentration will directly raise the temperature by roughly 1.2 degrees. (All of this is prior to water vapor feedback - which brings it up roughly another 1.8 degrees Celsius - but thats another story. But fortunately we have the paleoclimate record of the past 450,000 years to fall back on there.)

    In any case, given the MODTRAN database, it is possible to calculate just how much the temperature must rise in order to achieve radiative equilibrium given a doubling of carbon dioxide.

    Anyway, I will see what I can find a little later…

  89. wayne davidson Says:

    #69, #86 January 2007 (preceding the ice melt) +1.68 C monthly temperature anomaly was already reached for the Northern Hemisphere, NASA GISS. Above +1 C world wide anomaly mark was equally exceeded, well before surpassing the infamous X2 CO2 concentration threshold. Schwartz calculations imply that we peaked temperature wise. Arctic anomalies alone sometimes exceed +10 degrees….

  90. wayne davidson Says:

    …. +10 C in certain arctic regions…

  91. pete best Says:

    According to a preview of the IPCC implications of climate change report reported today in the Independent and Guardian newspapers here in the UK then 2 C is already “very likely” or in laymans terms almost ineviatable but why stop there. What gives anyone hope that 3 C will not be the stopping point or our greenhouse gas emissions. If climate sensitivity is following the dire predictions of the most pessemistic models then come 2030 we will be at around 420 ppmv of CO2 and come 2050 it will be around 480 ppmv. This could mean around a 3 degrees of temperature rise globally.

  92. catman306 Says:

    Chris S, #87, I asked the same question and Eric provided this response:

    “Just mentioning another possible environmental disaster linked to global warming and climate change: when the Greenland glaciers finally melt (either slowly or in a big whoosh) tectonic rebound will probably increase the frequency and magnitude of earthquakes around the world. The 30 foot rise in sea level will cause the Antarctic ice shelves to detach making it easier for the Antarctic glaciers to move more quickly into the ocean, causing still more sea level rise, tectonic rebound and earthquakes.

    Nice world we are leaving our grand children. And theirs.

    [Response: I am happy to be able to correct you that tectonic rebound from the Greenland ice sheet won’t have impacts on earthquakes around the world. Big earthquakes are due to processes much deeper in the earth’s crust, and much more localized. It is, on the other hand, rather likely that rising sea levels will help to destabilize the Antarctic ice sheet. On what timescale, however, remains quite uncertain. –eric]
    Comment by catman306 — 2 February 2007 ”

    I hope that the science is in on this and Eric is correct.

  93. Nigel Williams Says:

    Chris S. FYI Hansen et al’s recent paper Climate Change and Trace Gases (May 2007) makes sobering reading.

    http://www.planetwork.net/climate/Hansen2007.pdf

    Some quotes from the discussion in that paper:

    The imminent peril is initiation of dynamical and thermodynamical processes on the West Antarctic and Greenland ice sheets that produce a situation out of humanity’s control, such that devastating sea-level rise will inevitably occur.

    Attention has focused on Greenland, but the most recent gravity data indicate comparable mass loss from West Antarctica. We find it implausible that BAU [Business as Ususal] scenarios, with climate forcing and global warming exceeding those of the Pliocene, would permit a West Antarctic ice sheet of present size to survive even for a century.

    The best chance for averting ice sheet disintegration seems to be intense simultaneous efforts to reduce both CO2 emissions and non-CO2 climate forcings. As mentioned above, there are multiple benefits from such actions. However, even with such actions, it is probable that the dangerous level of atmospheric GHGs will be passed, at least temporarily. We have presented evidence (Hansen et al. 2006b) that the dangerous level of CO2 can be no more than approximately 450 ppm.

    So while Greenland is melting spectacularly the West Antarctic Ice Sheet is quietly matching the pace of its northern cousin, and no doubt other parts of the southern continent are likewise inclined.

    The trend in CO2 is brutally apparent from
    http://en.wikipedia.org/wiki/Image:Mauna_Loa_Carbon_Dioxide.png
    (See also http://en.wikipedia.org/wiki/Carbon_dioxide )

    which shows CO2 increasing by 65ppm over the last 45 years to its present peak value of 385ppm. So even if CO2 increased linearly (and the chart has a distinct exponential look to it, when we remember the historic tail) in just another 45 years we will be breathing 450ppm. We will be at the Dangerous Level. With over 140 coal-fired power stations coming on line this year there does not seem much hope of a softening of the emission rate for a few years yet.

    Now, how do we explain all THAT to our kids?

  94. Timothy Chase Says:

    Chris S (#87) wrote:

    What interests me the most is the statement in that article about the earthqaukes in Greenland bring up a question in my mind. Last semester in Geology I could have sworn I learned that the Pacific Tectonic Plate is grinding “northword” which created the Aluetion islands and Indonesian islands are from the plate driving westard. North westard. I wonder if these recent shifts in ice on greenland and higher ammounts of Isotatic activity are trigging the numerous earthqaukes in Indonesia this year, and their strong intesnities, especially the aftershocks which are usually associated with isotatic adjustment correct? I wish I was a scientist allready so I could have the resources and knowledge to figure this kinda of stuff by myself.

    Actually Greenland is experiencing more icequakes. I believe they have tripled in the past decade - and given the feedbacks I wouldn’t be surpised if they tripple again. But the earthquakes of Greenland are more or less constant. No trend.

    As for the melting of ice changing the pressures on the plates I know that this is something I wondered about. A geologist recently pointed out that this may in fact occur, but probably not something that we will have to worry about any time soon. With regard to the Northwesterly direction, that is going to be the result of the geometry of the plates and their current direction of motion. The melting of the ice won’t be able to change the geometry (slip faults and whatnot) or the direction of motion, although with the release of pressure it may influence the speed, somewhat.

    But this will probably be something that we will notice only after a great deal more melting. He was thinking on the order of thousands of years. With the rate of melting occuring on a shorter timescale than most have been expecting it may be sooner, centuries rather than millenia. But the fact that the earthquakes are remaining roughly uniform in Greenland (where much of the melting is taking place) would seem to indicate that it isn’t happening now - anywhere.

    Incidentally, in the Pacific Northwest we are supposed have sets of massive quakes, 9 on the Richter scale, like what you saw around Sumatra on Boxer Day 2005, three or four and occasionally five with each quake separated from the others in a set by roughly 300 years, then each set seperated from the others by more than 500. The geometry of the faults are even fairly similar to what exists around Sumatra, and they are on the same ring of fire.

    Last of these quakes was in January 1701 - resulted in a Tsunami three days later in Japan. We might have been due for another - but it would have been the fifth - so not that likely. We had a 6.8 around that time instead. A thousandth the power of a 9. There are patterns to the quakes. The Boxer Day was probably according to a similar lazy schedule.

    One other point: there aren’t supposed to be long-distance teleconnections between quakes. I sometimes wonder, but they are probably right. However, this would suggest that wherever the pressure is being released by melt is the rough neighborhood of where you may expect earthquakes to become more common. Not over great distances. Not much chance of the melting in Greenland or Antarctica affecting the region around Sumatra.

  95. Vernon Says:

    RE 72: Jim, it would appear that a significant amount of the warming and melting in the Arctic is not due to global warming but pollution.
    McConnel et al (2007) href=”http://www.sciencemag.org/cgi/rapidpdf/1144856v1.pdf”>20th-Century Industrial Black Carbon Emissions Altered Arctic Climate
    Forcing Monthly averaged surface forcing (i.e., BC-induced heating) during the peak early summer period (June and July) was 0.59 W m–2 after 1951.

    While enhanced radiative forcing from BC in snow results in warming and possibly summer melting on the permanently snow-covered Greenland ice sheet, potential impacts on seasonal snow covers are larger since additional warming leads to earlier exposure of underlying low albedo rock, soil, vegetation, and sea ice.

    So it would appear that if you want to reduce the melting in the Arctic, reducing CO2 is not the answer, it is cleaning up the pollution from Europe and Asia.

  96. Darrel Says:

    “it is cleaning up the pollution from Europe and Asia.” Let me guess, you live in North America?

    GHG still have a warming effect, so to blame any (regional) warming on a single cause (black carbon) is to leave out other potentially important factors. Both GHG and BC (and probably other aerosols as well) contribute to the Arctic warming.

  97. Vernon Says:

    Darrel, how about a study that backs up your position? Yes, I live in NA and well, the studies show that the most the BC is coming out of eastern Europe and Asia.

  98. Philippe Chantreau Says:

    Re 94: Tamino has a graph of the glacial quakes in “Graphic Evidence.” They are indeed increasing.

    Re 82: Smokeysmom, it appears that some denialists might be living on Neptune or Pluto, since they display tremendous confidence in their knowledge of these planets’ local climate. We also suspect that they might be extremely old (and grumpy), having been able to observe the plutonian climate through a significant number of Plutonian years. However, some denialists may not even be from our solar system, judging by their attachment to exotic climate forces such as galactic cosmic rays…

  99. John L. McCormick Says:

    RE # 91

    Pete, you said

    [following the dire predictions of the most pessemistic models then come 2030 we will be at around 420 ppmv of CO2 and come 2050 it will be around 480 ppmv.]

    I agree on the CO2 component but where will the CO2equivalent number be in 2030?

    We focus on the CO2 side because emissons data are available and Mauna Loa does a great job of measuring and reporting the atmospheric content. But, the total mix of gases are what will bite us more than CO2.

  100. Vernon Says:

    Stohl et al (2006) Arctic smoke – record high air

    pollution levels in the European Arctic due to agricultural fires in Eastern Europe.

    The European sector of the Arctic saw unprecedented warmth during the first months of the year 2006. At NyAlesund on the island of Spitsbergen in the Svalbard archipelago, the monthly mean temperatures from January to May were 10.7, 3.8, 1.4, 10.3, and 4.2◦ C above
    the corresponding values averaged over the period since 1969 (Meteorological Institute, 2006); the January, April and May values were the highest ever recorded. Figure 1, a comparison between the temperatures measured at NyAlesund in April and May 2006 with the corresponding climate mean, shows that the entire two months were warmer than normal. Due to the abnormal warmth, the seas surrounding the Svalbard archipelago were almost completely free of closed ice at the end of April, for the first time in history. In contrast to the Arctic, the European continent saw a delayed onset of spring in 2006. Snow melt in large parts of Europe occurred only in April; even as late as 1 May, snow covered much of Scandinavia.

    Related to the abnormal warmth in the Arctic, record-high levels of air pollution were measured at the Zeppelin station near NyAlesund on Spitsbergen. It will be shown in this paper that they were caused by transport of smoke from agricultural fires in Eastern Europe. These fires were started later than normal because of the late snow melt. The most severe air pollution episodes happened on 27 April and during the first days of May 2006 when the concentrations of most measured air pollutants (aerosols, O3, etc.) exceeded the previously recorded long-term maxima. Views from the Zeppelin station clearly showed the decrease in visibility from the pristine conditions on 26 April to when the smoke engulfed Svalbard on 2 May (Fig. 2). Iceland, where a new O3 record was set at the Storhofdi station, was also affected by the smoke plume.

    Maybe it is just me but we have t