France has a per capita carbon emission of 1.64 tonnes, compared to 2.67 tonnes for the U.K and 5.61 tonnes for the US. So, if anybody has earned the right to rest on their laurels and pontificate to the rest of the developed world about what they should be doing, you’d think it would be France. Far from it, under the leadership of Nicolas Sarkozy, France has embarked on an ambitious program of deeper carbon reductions. In introducing the measures, Sarkozy said "The guiding principle is that the cost to the climate — the carbon cost — will be integrated into planning of all major public projects, and into all deliberations affecting the public." These measures include: a commitment that all new buildings would be net energy producers by 2020, incandescent lighting would be banned by 2010, buyers of efficient vehicles would be subsidized, drivers of inefficient vehicles would be penalized, and road construction would be severely curtailed in favor of expanded rail travel using state-of-the-art French TGV technology. A carbon tax is also being seriously contemplated. These proposals are the result of an intensive months-long series of discussions with scientists and stakeholders such as environmental nongovernmental organizations, industry representatives, and labor union representatives. The process, known as Le Grenelle de l’Environnement, was described here by Nature (subscription required) and a summary of some of Sarkozy’s proposed actions was reported in the press here.
All the same, there has been some pushback from a vocal pair of highly decorated French academicians, Claude Allègre being the most prominent and noisiest of the two. In recent years, Vincent Courtillot has emerged as a reliable sidekick to Allègre — a Dupont to his Dupond — helping to propagate Allègre’s claims and adding a few of his own. Both are members of the Académie des Sciences, and Allègre has been awarded both the Crafoord Prize and Bowie Medal. Allègre has an impressive list of publications relating to the Earth’s interior, and besides that was Minister for Education, Research and Technology in the Jospin government. Courtillot — currently director of the Institut de Physique du Globe de Paris (IPGP) — has had a distinguished record of research on fundamental aspects of geomagnetism and is currently President of the Geomagnetism and Paleomagnetism Section of the American Geophysical Union. Their views were amply (some would say more than amply) represented at a symposium on the IPCC report, held last Spring at the Academie (See the issue "Evolution des Climats" of La Lettre de l’Académie des sciences, and press reports in Le Figaro, Le Monde, and Liberation). What does all this mean? Are the opinions of Allègre and Courtillot founded on some special profound insight that has escaped the notice of the community of scientists who have devoted entire careers to studying climate? Let’s take a look.
When an active scientist of the distinction of Allègre or Courtillot speaks out, the voice has a special claim on our attention, no matter how implausible the claims may seem. It would be a mistake, however, to accept the proclamations of such luminaries on the basis of authority; one must examine the arguments on their merits. Allègre does not publish his arguments on climate in the peer-reviewed scientific literature, so we have to turn to his popular writings and public statements to get a glimpse of what these arguments are. A treasure trove of Allegrisms (Allegrories? Allegrations?) can be conveniently found in a little opus humbly entitled Ma vérité sur la planète (Plon/Fayard:Paris 2007). Many of the things said here merely parrot standard discredited skeptics’ arguments without adding anything new: For example, Allègre at several junctures repeats the old fallacy of confusing unpredictability of weather with the problem of determining how climate responds to changes in radiative forcing: "I have difficulty believing that one could predict with precision the temperatures that will occur a century from now, when we can’t even predict what they will be one week from now." (p.89) He also repeats the fallacy that the lead-lag relation between CO2 and temperature in Antarctic ice cores proves that temperature causes CO2 variations rather than vice-versa — a tired and thoroughly discredited argument (look here for a summary of the rebuttals) . There is little more to say about such arguments, save that Allègre’s willingness to repeat them shows either a remarkable gullibility or a disturbing lack of scientific integrity.
Elsewhere, though, Allègre breaks new ground with regard to passing off nonsense as scientific argument. Here are a few examples.
- Allègre claims that the disappearance of the glaciers on Kilimanjaro is due to moisture supply changes arising from tectonic uplift, and has nothing to do with global warming. This claim appeared over a year ago in Allègre’s column in L’Express, and was discussed in an earlier RealClimate post on Allègre. Essentially, Allègre failed to understand that the tectonic events referred to in the Science paper he cited affected the African climate millions of years ago, whereas the present Kilimanjaro glacier didn’t even come into existence until around 10,000 years ago. The erroneous claim about Kilimanjaro is repeated in Ma vérité sur la planète (p.120), despite ample time and opportunity to correct the mistake. So much for vérité ("his" or otherwise).
- Allègre says that "common sense" casts doubt on the idea that CO2 could have such a controlling effect on climate, because its concentration is only 300 parts per million (p.104). This "common sense" flies in the face of over a century of meticulous physics going back to the time of Tyndall, which shows precisely why certain trace gases have such a strong influence on infrared absorption by the Earth’s atmosphere.
- Allègre says we "know nothing" (p.109) about the Dansgaard-Oeschger events and other form of millennial variability appearing in the ice-core record. From this statement, I think you are supposed to infer that since we "know nothing" about the events it could well be that the current warming is just the latest warm phase of such a thing. To be sure, there’s a great deal still to be learned about millennial variability, but the phenomenon has been the subject of several hundred peer-reviewed scientific papers, dozens of conferences, and a major study by the US National Academy of Sciences. We know enough about the pattern of such events and the mechanisms involved to essentially rule out the possibility that the recent warming is a related form of natural variability. We also know enough to worry about the possibility that climate change due to greenhouse gas increases could trigger massive ocean circulation shifts of the sort that were involved in past millennial variability.
- Allègre says that under an increase of CO2 there would be no warming at the equator, whereas the predicted warming at the equator is in fact only somewhat below the global mean warming. He states correctly that the warming is strongest at the poles, but states without support that a 10ºC warming would be no big deal (p.122). This is quite a startling statement, given that a much more moderate warming has already caused substantial loss of Arctic sea ice. Part of his misconception may come from the fact that he thinks that the temperatures at "the poles" range from "-30 to -60ºC." (p.122) If that were really true, there would be no open water in the Arctic at the time of the sea ice minimum. It is easily verified that this is not the case, and indeed the Arctic commonly gets up to 0ºC in the summer, and sometimes more.
- Ignoring the numerous independent studies of the instrumental record of the past century, he says the Phil Jones analysis of this data has been "put seriously in doubt" (p.100). And by what means? A comparison of Jones’ global mean data with an unpublished analysis of the average of a limited number of hand-picked European stations — presented as the epitome of the Geophysicists’ incomparable expertise at time-series analysis! More on this when we come to discuss Courtillot.
- Helpfully, Allègre advises modellers that "It is necessary to avoid basing predictions of future climate on a global mean whose status is vague." (p.106) Evidently he is unaware that general circulation models have been simulating geographical variations of future wind and temperature changes at least since the 1970’s, and that maps of such changes have been included in every IPCC report going back to the very first. Oh, but I forget. Elsewhere Allègre states that "nobody reads" the IPCC reports (p.115). Evidently, this statement applies to at least one person.
- Continuing his display of ignorance of the modelling enterprise, Allègre wonders why modellers put CO2 in their models, and concludes that it is only because they happen to know how it has varied over the centuries. Could a century of meticulous laboratory and field work documenting the radiative effect of CO2 perhaps have something to do with modellers’ preoccupation with this gas? Evidently not in Allègre’s universe. But there’s more: "Because one doesn’t well understand how clouds form, one neglects them! Because one has not mastered the role of aerosols and dust, one neglects them!" (p.104) This is not at all true. Clouds, aerosols and dust (as well as solar irradiance variations and volcanic eruptions) are all included in modern models. Models that leave out the influence of the CO2 rise fail to reproduce the warming of the past 30 years, and it is precisely for this reason that CO2 is confirmed as the prime culprit in global warming.
- Allègre makes a number of false or misleading statements concerning the contents of the IPCC Fourth Assessment report. He claims that this report (contrary to French media coverage) "considerably toned down" its conclusions compared to previous reports (p.119). By way of evidence, Allègre states "For a doubling of CO2 emissions the temperature of the globe will rise between 2 and 4.5ºC in a century. The previous report said between 1.5 and 6ºC." (p.119) First of all, the IPCC statements on climate sensitivity refer to a doubling of CO2 concentration, not CO2 emissions, but let’s give Allègre the benefit of the doubt and assume this is just another instance of sloppy writing rather than true misunderstanding. Even so, Allègre is mixing up his apples with his pommes de terre in this statement. Though the climate sensitivity range narrowed from 1.5-4.5ºC previously to 2-4.5ºC now, reducing the likelihood of low climate sensitivity, the range of predictions for 2100 remain largely unchanged (and are moreover not strictly comparable between the reports given changes in the way "likelihood" is estimated). In a similar vein, Allègre claims that the IPCC reduced its forecast of sea level rise, which is not the case.
- And there’s more. He says that IPCC has "modified, though not completely abandoned, its argument concerning 20th century temperature rise." (p.119) This evidently refers to Allègre’s belief that one of IPCC’s main arguments has been that CO2 must be responsible for temperature rise because (ben voilà!) they both go up! It’s hard for IPCC to abandon an argument it never made, and in any event the Fourth Assessment Report probably devotes more space to discussing the twentieth century temperature record, using more techniques, than any earlier report. And yes it does (pan to shot of Galileo here, speaking through clenched teeth as he bows before the inquisition) still go up (and by essentially the same amount as previously estimated). Continuing the theme of abandonment, Allègre says that the IPCC has "abandoned" its argument regarding the implications of ice-core CO2 and temperature variations. Actually, not. There is no change in the way IPCC interpreted the Vostok isotope and CO2 curve, which appears both in the 2001 and 2007 reports (the latter with Epica extensions into earlier times). The discussion appears in Chapter 6 of the Fourth Assessment Report (p 444 fig 6.3), but how could Allègre be expected to know that? Nobody reads the IPCC reports, right?
Misconceptions and misrepresentations of the sort given above are liberally supplemented with the usual arsenal of innuendo and quote-mining. Because Christopher Landsea (extravagantly compared to Galileo!) chose to make a scene by resigning from the IPCC, the whole process is deemed to not allow dissent — conveniently ignoring that Lindzen happily stayed on the IPCC Third Assessment Report. An entirely reasonable and uncontroversial statement by Dennis Hartmann on modelling uncertainties is twisted to imply that modellers think we can’t simulate anything with sufficient precision to draw conclusions about future warming (p.105). Quotes on the possible necessity of adaptation measures from MIT’s Ron Prinn and Columbia’s Wally Broecker are used to imply that these two notables favor adaptation over CO2 emissions reduction (p.126). And on the subject of adaptation vs. mitigation, some of Allègre’s statements are downright bizarre: He says that we have nothing to fear from global warming. After all, we adapted to the ozone hole, didn’t we? We adapted to acid rain, didn’t we? (p.127) Well, no actually, we did nothing of the sort. We "adapted" to the ozone hole by passing the Montreal Protocol to control CFC emissions. We "adapted" to acid rain by passing pollution control measures which reduced sulfate emissions. If this is "adaptation," I guess I can just say: ‘d’accord!’ Let’s just "adapt" to global warming by reducing CO2 emissions!
What is to be said of such claims? I couldn’t put it better than Allègre himself: "… une imposture intellectuelle, une escroquerie!" (p.107)
Whatever agenda Allègre is pursuing in his public pronouncements on global warming, it would seem to be very little informed by his scientific expertise. Through his litany of errors, misconceptions and misrepresentations, he has abdicated any claim to be taken seriously as a scientist when he speaks about climate change. And lest Lomborg and similar eco-Pollyannas draw too much comfort from Allègre’s support, let us note that, at the end of the day, Allègre still calls for a 20% reduction in CO2 emissions over the next 20 years. Many of us who wouldn’t touch Allègre’s arguments with a 10 foot baguette would be quite happy if such a plan were enacted in the United States, at least as a first step towards ultimate deeper reductions.
So much for Allègre. Now what of M. Courtilllot? Fortunately, we need not go into nearly so much detail, since almost all of the arguments presented in the Academie debate (see his article in La Lettre de l’Académie des sciences) mirror those given in Allègre’s book. Still, the man manages to add a few wrinkles of his own. For example he confidently declares that the glacial-interglacial CO2 variations are "simply" explained by the effects of temperature on CO2 solubility. He is evidently unaware that this simple mechanism was in fact quite simply evaluated years ago by Wally Broecker — like Allègre, a Crafoord prize winner — and found to be woefully insufficient (see Martin, Archer and Lea, Paleoceanography 2005, for a recent treatment of the subject).
Remember the graph of European temperature in Ma vérité which was supposed to put Phil Jones’ analysis of the instrumental record "seriously in doubt?" Well, it reappears in Courtillot amply decorated with a lot of new verbiage: climate scientists spend all their time modelling and hardly any looking at data; geophysicists are uniquely qualified to look at time series because they do it all the time and anyway they invented most of this stuff in the first place; nobody ever cross-checks or verifies Phil Jones’ work. And patati, and patata, none of which holds a glimmer of truth. But, having declared all this the brave geophysicists of the IPGP decide to take a look for themselves by averaging together a few tens of European weather stations (with a few distant ones from the Urals thrown in for good measure) and ben voilà, how Courtillot is "astonished" that the curve doesn’t look at all like what they were taught it should look like! (Courtillot is evidently a man easily astonished, and equally easily surprised, since these words appear with stunning regularity in his article.)
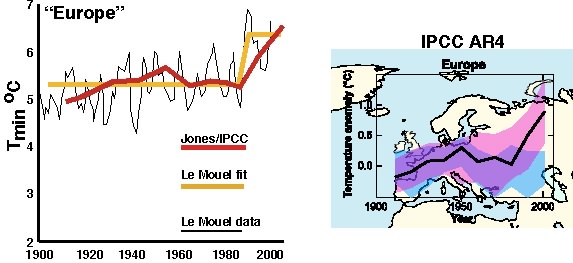
The analysis which evidently shocked Courtillot like a coup de foudre was presented at the Academie debate by Le Mouël (himself an Academician, and holder of the Fleming Medal). A video of his talk is here. Dear reader, I urge you to take a look at this video for yourself and see if you can make any more sense of it than I could, amidst all the mislabeled graphs, bizarre choices of what to compare to what, and missing information about crucial aspects of the data handling. I have done my best to convey what I think is the essence of the argument Le Mouël is trying to make, but it isn’t easy. In the left panel below I reproduce the only graph in which Le Mouël attempts a direct comparison between his data and the Phil Jones analysis which appeared in the IPCC report; it was redrawn by tracing over a freeze-frame of Le Mouël’s presentation. The graph is labeled "European Average" in the presentation, but the data (thin black line) which Le Mouël compares to Jones’ European analysis (red line) is actually from Denmark. Moreover, Le Mouël’s data seems to be monthly (or maybe daily) minima. Why one would want to compare Danish temperature minima with all-Europe temperature means is beyond me, but in the end what Le Mouël is making a big noise about is his claim that the yellow curve fit describes the data better than Phil Jones’ curve. Given the variability, there is really no objective reason to prefer one over the other, but the distinction between the two fits is largely immaterial. What you can take home from Le Mouël’s analysis is that, in Europe, a marked temperature rise does not set in until the 1980’s. Sound familiar? It should, because that is more or less what the IPCC says, pointing out further that natural variability cannot explain the recent warming. This can be seen well in the right panel, taken from the Fourth Assessment report. The blue shaded region is the ensemble of simulations forced by natural variabiity, while the pink shaded region includes anthropogenic forcing. Only the latter reproduces the rise at the end of the record.
The point of a lot of this fiddling with temperature curves is that the Sun must be doing something to control all these fluctuations. That brings us to radiative forcing, and Courtillot and company have had some problems with this issue, since they have a hard time making it look like CO2 is a small forcing and solar variability is a big forcing. One botched attempt at this was to claim that cloud fluctuations swamp CO2; Courtillot claims that clouds cause 80 Watts per square meter of radiative forcing, so that a mere 3% change in cloud cover would cause 2.4 Watts per square meter radiative forcing, which would be comparable to greenhouse gas forcing changes to date. To get this figure, though, Courtillot evidently assumed that all the Earth’s albedo is due to clouds, and moreover neglected the cloud greenhouse effect. When properly calculated, the net cloud radiative forcing is more like 20 Watts per square meter, so a 3% change gives you only 0.6 Watts per square meter, well below the greenhouse gas radiative forcing to date, to say nothing of what is in store for the future.
This flub is nothing compared to the trouble Courtillot’s collaborator Le Mouël got into during the debates, when he was trying to show that the 1 Watt per square meter variation in the Solar irradiance over the solar cycle is fully half the greenhouse gas forcing. Well, there is the little matter that Le Mouël forgot to take into account the sphericity of the Earth (which means divide the solar irradiance by 4) or its reflectivity (which means take 70% of the result). As the Le Monde reporter archly noted, Le Mouël’s calculation assumes a black flat Earth, but, "Hélas! La Terre est ronde" (zut alors!). Le Mouël seems eager to follow in Allègre’s geometrically-challenged footsteps: In a 1988 book (12 clés pour la géologie, Belin:Paris), Allègre confidently stated that the pole to equator temperature gradient was due to snow albedo and atmospheric absorption, making no mention of the role of the Earth’s spherical geometry, which is far and away the dominant factor (and the reason there’s ice at the poles to make a high albedo). Messieurs, here’s a little hint: What does the "G" stand for in "IPGP?"
The round Earth having robbed him of his 1 Watt per square meter –which in any event is mostly averaged out over the relatively short solar cycle leaving a miniscule tenth of a Watt variation between cycles — Courtillot grasps at the possibility some unknown and unquantified nonlinear mechanism for turning the very high frequency solar variability into a century scale trend.
There is also a bit of nattering about Moberg’s take on the Hockey stick, the supposed considerable warmth of the Medieval Warm Period, and some supposed millennial solar variability which supposedly accounts for why the present warming sort of looks like Moberg’s take on the Medieval Warm. Even leaving aside evidence that Moberg’s method exaggerates variability (see Mann, Rutherford, Wahl and Ammann 2005, available here), the "blame the Sun" mantra falls apart because neither the Sun nor cosmic rays have been exhibiting any trend that could conceivably account for the recent warming, as we have discussed in many places on RealClimate (most recently here).
With regard to climate, Courtillot’s main claim to fame is not found in his article in La Lettre. For that we have to look to a paper recently published in EPSL, which claims that climate variations are closely tied to the geomagnetic field. How convincing is this work? That will be the subject of Part II.
Re #32
The picture is not quite as rosy (magnify the end)
http://arctic.atmos.uiuc.edu/cryosphere/IMAGES/sea.ice.anomaly.timeseries.jpg
James
Re 32 and 201.. et al. Surely its not so much the extent as it is the mass of the ice. The fact that it came back so fast suggests that it’s a very thin veneir, and that will take only a whiff of heat to melt it, and a puff of wind to move it. We’re not out of the hot water yet!
What with the holiday and everything, I’d like to say thanks to climate scientists everywhere and especially to the contributors here at RC.
Thank you.
Paulina
To Lynn #199
Infrared (IR) is just next to visible light on the spectrum, but is not visible itself. They both behave as waves, although of a different frequency. Most of the sun’s energy arrives as visible light (that is why plants use visible light to fuel photosynthesis). There is no incoming energy from the sun at night (i.e. the half of the planet which is turned away from the sun) but the greenhouse (GH) effect operates constantly because GH Gases are well mixed in the atmosphere. The ground reradiates some of the energy it received during the day as IR during the night. So basically your middle paragraph (1st suggestion) was correct – the professionals might like to correct me on this but I would expect warming to be most noticeable at night, in winter, and near the poles. There are obviously other factors to take into account – this only explains part of what we see in the real world.
Nick: Fair enough on our initial agreement which is based on the 2005 minimum as outlined above.
In terms of tipping point – would you be willing to repeat our same bet for 2009, using our same 2005 standard of ice extent?
Steve (200)
It’s not at all established that Arctic sea ice is likely to set a new minimum in 2008
Steve – right, my understanding is that it almost certainly will not. I’d love to take that bet at up to $2500 via an escrow service. Unfortunately I foolishly bet Nick using the 2005 minimum not realizing that the hugely anamolous 2007 will make it harder for the ice to gain normal thickness. So, a fun wager but it has little to do with a key issue in climate science – are we going to have gradual changes along the lines of the past, or more dramatic changes as we reach tipping points that may lead to abrupt climate change.
Timo in his Comment 48 makes reference to iodine-129 as if, because of its long half-life, it has some relevance to the safety of nuclear plants or the danger of nuclear waste.
This is a mistake that is fairly common among people who don’t know much about health physics.
The half-life of a radionuclide is only one of the factors that determine whether it is a threat to humans and the rest of the biosphere.
Iodine-129 has a half-life of approximately 16 million years. If I have 129 grams of it (Avogadro’s number of atoms), half of it will decay away in 16 million years. Iodine-131 has a half-life of approximately 8 days. If I have 131 grams of it (Avogadro’s number of atoms), half will decay away in 8 days. Note that there’s a lot more going on with the iodine-131. It’s specific activity — that is, the rate at which atoms are actually decaying — is approximately 800 million times greater than the activity of iodine-129.
Both isotopes of iodine are produced in a significant fraction (a few percent) of uranium or plutonium fission events. If the iodine-131 gets into the human thyroid, while it’s still around, it can cause thyroid cancer and other thyroid pathology. It is so good at that that it is actually used to “kill” the thyroid in treatment of Graves disease. On the other hand, the folklore/joke here on the Hanford site (where we have a fair amount of I-129 in the waste tanks, the ground, and the groundwater) is that the carcinogenic dose of I-129 is 28 pounds of it in the thyroid (as opposed to a few micrograms of I-131). Because of the widespread use of iodine-131 diagnositically and therapeutically and study of Hiroshima/Nagasaki/Chernobyl populations, we have a pretty good idea how much radiation is required to produce thyroid pathology.
The bottom line is that because of its long half-life, and its relatively weak beta decay energy, it is simply not one of the radionuclides that is a human/animal health issue.
The problem radionuclides are the middle-half-life ones, like 25-30 year cesium-137 and strontium-90, with energetic decay particles, that have an affinity for some body tissue, and a tendency to hang around in the body long enough to do damage.
The half-life of iodine-131 is short enough that the simple expedient of taking the cow/goat/etc. milk (the main exposure pathway), making cheese, and aging it for three months before consumption will reduce the iodine-131 levels by roughly a factor of 5000.
Best regards.
Jim Dukelow
Just read a report from the BBc ‘http://news.bbc.co.uk/1/hi/sci/tech/6665147.stm’ That says that te oceans are becomming saturated with CO2 especially the upper levels of the ocean and when that occurs the oceans ability to soak up as much as 50% of our emitted CO2 becomes less and less efficient. The theory most scientists had before is that the CO2 would be concentrated at the lower regions of the ocean and not to be detrimental to the biology of the oceans..but recent reseach shows that the majority of CO2 is trapped in the upper layers and do not permeate lower. Another factor is of the CO2 actually trapped at lower levels the increased winds over the ocean have had the effect of stirring up the water and causing CO2 to be mixed at the uppper levels thus compounding the problem. They state that when the concentrations at the upper layers increase beyond a certain point which we are rapidy reaching the ocean will no longer be able to absorb 1/2 our CO2. Not helping matters is the destruction of our forests in Borneo, SE asia, amazon etc. Thus the IPCC forcasts need updating yet again. Has anyone heard of this fact? It’s the first time I’ve heard of it, but if it’s true we need to take very aggressive action indeed to slow down our emissions.
re #191
According to Wiki
http://en.wikipedia.org/wiki/Subtropical_storm
And according to NOAA:
http://www.aoml.noaa.gov/hrd/tcfaq/A6.html
Ref 202 Nigel writes “Surely its not so much the extent as it is the mass of the ice. The fact that it came back so fast suggests that it’s a very thin veneir, and that will take only a whiff of heat to melt it, and a puff of wind to move it. We’re not out of the hot water yet!” I was going to stay out of this, but this cannot be ignored. Let us get the facts straight. In 1979, when records began, there was approximately 16 mil sq kms of arctic sea ice at maximum, 9 mil sq kms melted, leaving approx 7 mil sq kms of old ice at minimum. Had things remained static there would be 9 mil sq kms of annual ice frozen and melted each year. But things have not remained static. Over the last 30 years or so, approx 2 mil sq kms of old ice has turned into open ocean. This year another 1 mil sq km + did the same thing. In the eastern part of Canada, south of, say, Prince Charles Island, the only ice we get is annual ice. What are the characteristics of this annual ice? It is the ice that polar bears hunt from in Hudson Bay; the ice that harp seals have their young on in the Gulf St. Lawrence, and is used by seal hunters. It is the ice that stops ferries running between New Brunswick and Newfoundland. It is the ice that can cause havoc in the Northumberland Strait, and made the engineers building the Confederation Bridge to take very special precautions. On the other side of the Atlantic, in the Baltic Sea, it is the reason Russian engineers have designed a completely revolutionary type of oil carrier/ice breaker. To describe annual ice as “a very thin veneir”, is, to say the least, being very economical with the truth.
Re #192
Actually, the last C-14 measurement on the chart was 60 years ago, and it was clearly higher than any point in the last thousand years.
But let’s not stop there. look at this page:
http://en.wikipedia.org/wiki/Image:Solar-cycle-data.png
See the sunspot record? very high compared to the 500 year average. Look at the 10-Be measurements. Rising over the entire time period with a very high rate of climb in the early 1900s.
The only area that doesnt’ seem to fit the trend is the time period from the 50s through the 70s. So why couldn’t aerosols have been the cause of this cooling and by removing them, we’ve reinstated the natural heating period caused almost solely by the sun?
Comparing that to global temperature plots results in a very strong correlation.
In light of the various wagers that have been proposed on this thread, I’d like to suggest one: in what year will global anthropogenic carbon emissions peak and begin to decline?
I believe that mainstream climate scientists, eg. the IPCC, are saying that emissions must peak and begin to decline no later than 2015 to avert “dangerous” climate change. On the other hand, projections from the International Energy Agency are that emissions will increase by 50 percent or so by mid-century. In recent years emissions have been not only increasing but accelerating.
Does anyone believe that emissions will peak by 2015? When do you think they will peak?
Of course this is not a wager about climate science itself, since the outcome depends on human behavior.
A separate note — I just listened to an hour long lecture by “Australian Of The Year” and author of The Weather Makers Tim Flannery, on the Pacifica radio program Democracy Now.
He was actually optimistic that humanity will not only dramatically reduce — to near zero — our carbon emissions within the necessary timeframe through conservation, efficiency and alternative energy technologies, but will use measure like tropical reforestation and agricultural char techniques to draw down atmospheric CO2 to pre-industrial levels by mid-century. I must say that I was not convinced but nonetheless that was encouraging to hear.
quote To get this figure, though, Courtillot evidently assumed that all the Earth’s albedo is due to clouds, and moreover neglected the cloud greenhouse effect. When properly calculated, the net cloud radiative forcing is more like 20 Watts per square meter, so a 3% change gives you only 0.6 Watts per square meter, well below the greenhouse gas radiative forcing to date, to say nothing of what is in store for the future. unquote
I wonder if someone would be kind enough to walk through the maths (simply!) on this. In view of Palle’s Earthshine project, I’m very interested in the physics of albedo change.
JF
Re Jim Cripwell in 209,
Best not to use the harp seal nursery to support your claim:
Lynn posts:
[[Well, I don’t even know what a space blanket is, but is it true that night temperatures are warming somewhat faster than day temperatures? ]]
Yes. This is one of the ways we know GW is due to greenhouse gases and not solar influence, which would, obviously, be greater during the day.
dean writes:
[[The only area that doesnt’ seem to fit the trend is the time period from the 50s through the 70s. So why couldn’t aerosols have been the cause of this cooling and by removing them, we’ve reinstated the natural heating period caused almost solely by the sun?]]
Because the sun wasn’t heating up over that period.
JF writes:
[[I wonder if someone would be kind enough to walk through the maths (simply!) on this. In view of Palle’s Earthshine project, I’m very interested in the physics of albedo change.]]
The amount of Solar energy received by the Earth system, measured by net flux density, is
F = (S / 4) (1 – A)
where F is in watts per square meter, S is the Solar constant at Earth’s distance from the Sun, and A is the Earth’s bolometric Bond albedo. From F we can estimate the Earth’s effective emission temperature:
Te = (F / sigma)0.25
Inverting, and assuming a 0.95 mean emissivity for the Earth’s surface, we can find the flux density emitted from the ground:
Fs = 0.95 sigma Ts4
The net radiative forcing is then
RF = Fs – F
For the reference case, I assume
S = 1366.1 W m-2 (mean from Judith Lean’s figures for 1951-2000).
A = 0.306 (NASA)
This gives F = 237.0 W m-2, Te = 254.3 K, Fs = 371.4 W m-2, and RF = 134.4 W m-2.
If we then increase S by 1%, RF changes by 2.37 watts per square meter. We have never observed a change in the annual mean this large in recorded history. The sun at the Maunder Minimum was only about 0.2% below the present figure.
If we decrease the albedo by 1%, RF changes by 1.05 W m-2.
For clouds, I assume mean cloud coverage of 61.7% (Kiehl and Trenberth’s 1997 figure). If the average albedo of the surface is 0.05, then clouds must have a mean albedo of 0.465 to reproduce the observed planetary albedo. If we then decrease cloud cover by 1%, RF changes by 0.96 W m-2.
The work of Palle et al. with Earthshine estimates of Earth’s albedo is very interesting, but not everybody buys his figures yet, much less the big annual changes. There may be some problems with his methodology.
-BPL
Secular Animist:
Does anyone believe that emissions will peak by 2015? When do you think they will peak?
Given China’s rapid development I’d guess 2015 is way too optimistic, but I’d guess by 2025 we’ll have nuclear going full bore in most countries, much better sequestration, and many new technologies.
What I don’t understand is how a this likely scenario of a large “spike” in CO2 over the industrial period interacts with the C02 to temperature lag time of hundreds of years. ie assuming we bring GHG emissions to old historic averages by 2025 what are likely global temperature implications?
Secular Animist, Re: bets on peak Carbon emissions.
I see no point in betting on this as I expect it will not happen until long after I am dead, and I have no heirs to collect on my behalf. Human beings have proven entirely too stupid to grasp the risks we face, so I expect that carbon emissions will continue to increase until we start to exhaust coal reserves. Then we have all that lovely wood in the rainforests and temperate forests. But why stop there–the subcontinent sure didn’t–we can burn all the animal dung. In short, I do not expect carbon emissions to peak until Earth looks like a cinder–sometime in the middle of the next century.
Re the CO2 emissions peak mentioned in 211 and 217, check out this post at The Oil Drum:
World Energy to 2050: A Half Century of Decline
It makes a plausible case for world energy production peaking around 2020. Coal comprises the majority of production over the whole curve, with nuclear making a minor contribution.
Re #210:
“Actually, the last C-14 measurement on the chart was 60 years ago, and it was clearly higher than any point in the last thousand years.”
No the last measurement was 60 years BP (Before Present: which in C14 dating terminology is years before 1950) therefore the last data on that chart is from 1890 as I posted earlier. Any C14 data since that time would be meaningless as a solar proxy as it was contaminated by fossil C14 and during 1950-70 by nuclear testing.
Re # 183 Steve ” I only wish you’d written it from a less biased stand-point.”
Less biased? Do you mean not given credence to the scientific views of mainstream climatology? If that is what you meant, I hope you were joking.
Re# 177 dean “one post said that GW should result in an increase in the number of storms. But there’s been no significant increase in the numbers, so would that then mean that there’s no GW? ”
No- that would be flawed logic. It simpl ymeans that the predicted relationship between AGW and frequency of tropical storms has been based on one or more incorrect assumptions – I seem to recall reading that wind shear is higher than expected, and this alters the transfer of energy between the atmosphere and water (http://www.wunderground.com/education/shear.asp).
Lastly, I thought I posted this last night, but I don’t see that the post appeared (perhaps there is a conspiracy to silence my mainstream views on AGW?):
Climate Change Controversies: A simple guide
http://www.royalsoc.ac.uk/page.asp?id=6229
Re #215
Yes, there seems to be no change in solar output over the last 50 years or so. The temperature drop of the 50s to 70s therefore cannot be attributed to the sun. So it has to be attributable to something else. that ‘something’ is most likely aerosols.
Every criticism of solar output says that the current warming period can’t be due to solar output because solar output since the 50s has been constant. That is ONLY true if we were at thermal equilibrium in 1950. IF the introduction of aerosols kept us from reaching solar equilibrium (or better stated, resulted in a lower equilibrium temperature), then removing the aerosols would result in a higher temperature. That is exactly what we’ve seen since the 1970s.
So where is the evidence that we were at equilibrium in 1950?
RE #221
I know it’s flawed logic. I just wanted to see what the replies would be…
reading this link:
http://www.royalsoc.ac.uk/page.asp?tip=1&id=6233
i noticed they said it can’t be due to the sun. Again, they fall into the fundamental assumption that we reached thermal balance in 40s & 50s and therefore the sun can’t be causing it.
But what if we didn’t reach that point before aerosols started to cool the planet?
Ref 216:
Thank you. Copied and saved. Presumably there’s a water vapour feedback that will double the original forcing.
JF
dean (222,224) — I am but an amateur at this, but I am quite convinced that there was no quasi-equilibrium of the global climate in 1950. Irrespective of the effect of aerosols, etc. The quasi-equilibrium CO2 concentration, taken as that in 1750, was 280 ppm. This value is in good agreement with the concentrations of prior interglacial periods. But in 1950, the CO2 concentration was about 315 ppm. Thus my opinion that the climate was in the lengthy process of seeking a new quasi-equilibrium then.
#207 Lawrence Coleman: Yes, this past weekend on Living on Earth
transcriptions and podcast available at LOE.org
see ‘max capacity’ segment with Dr. Inez Fung Berkley Institute of the Environment
http://www.loe.org/shows/shows.htm?programID=07-P13-00046#feature4
Joe, assuming you’ve read “start here” and the AIP History, the IPCC scenarios answer your question while making a large number of unstated assumptions explicit. If there’s a more recent page someone will correct me:
http://www.grida.no/climate/ipcc/emission/115.htm#52
Re: #226
David, so you are saying that the sun had nothing to do with any of the temperature rise seen in the last 300 years?
do you extend this to mean that it had nothing to do with the cooling of the 17th and 18th centuries?
Secular Animist: Thanks for the link to the Tim Flannery talk at Democracy Now. It was well worth the hour!
Dean, for God’s sake, please read Spencer Weart’s history of global warming:
http://www.aip.org/history/climate/index.html
Most of your questions have already been answered there. Most of the forcings are pretty well constrained by multiple lines of evidence. Some still have considerable uncertainty–but future changes are unlikely to affect well constrained forcers–such as CO2.
So go read the science. If you have questions about it, come back and ask them. But don’t think you can approach this with a bunch of qualitative arguments (that incidentally have already been flogged to death).
Ray: … until Earth looks like a cinder–sometime in the middle of the next century …
Whoa – even for RC that’s a darn gloomy prospect. Surly you be hyperbolizing …?
David B. Benson (226):
There is a simple two part answer to the ‘it must be the sun’ argument. First, there has been no increase in measured solar activity since the ’50s. Second, current warming follows a linear-to-accelerating path. If the earth were merely catching up with past solar increases, the curve would be assimtotically approaching the equilibrium value.
Dean, is there some reason why you insist on beating the solar drum in not one, but two threads simultaneously?
# 168 Lynn: . . . And I think that’s why the nights are warming somewhat faster than the days (please correct me if I’m wrong on this). . . .
Lynn, I’m not going to presume to correct you, and I surely don’t want to contribute anything that will provide aid and comfort to dean as he pursues an obviously flawed argument. However, several comments here and elsewhere have stated that nighttime temps are rising more quickly than daytime. Here’s what I find in the IPCC reports (AR4 WGI Tech. Summ., p. 36).
“The global average DTR [diurnal temperature range] has stopped decreasing. A decrease in DTR of approximately 0.1°C per decade was reported in the TAR for the period 1950 to 1993. Updated observations reveal that DTR has not changed from 1979 to 2004 as both day- and night time temperature have risen at about the same rate. The trends are highly variable from one region to another.”
If someone can help me understand how to interpret this, I’d be grateful.
> dean Says:
> 23 November 2007 at 7:32 PM
> Re: #226
> David, so you are saying that the sun had nothing to do …
No, Dean, he’s not. Please read the “start here” and AIP history.
If you have some other source you are relying on, why do you consider it accurate? Can you share your source with us so we can read it?
Hank thx for that IPCC CO2 scenario link – the Emissions scenarios graph is really interesting.
This quote from the excellent Spencer Weart history mentioned by Ray in 231 really hits the nail on the head:
Re #216,– Thank you Barton Paul Levenson, and all the rest of the correspondents and of those who maintain this enlightening seminar. Joe Haga
Cheesh Jim 209! Take it easy mate! The point I’m making is that ice that is one year old is not very thick – just like the pack around Antarctica it will melt faster than older ice, and so any older ice remaining in the ‘core’ of the Artic will probably become exposed to surface water effects ever faster than before.
I wasnt suggesting that a slab of it wouldnt poke a hole in your corricle if you were passing by!
Next spring will be interesting – as others have said it will give us a good indication of where we are in relation to a tipping point – bearing in mind that randomness may ensure it takes a few years before the new age settles into its routine.
Emissions scenariois at currently worse than worst case IPCC predictions and now we have the long term climate feedbacks to endure to as well as the short term ones that give us our 3C mean for a preindustrial doubling of CO2.
1 degree above year 2000 levels and we are doomed. Well we already have 0.6C in the pipeline and 0.8c in reality so another 0.6 and we are going to be poorer for it. 1000 coal fired power plants to be built globally in the next 5 years with 50 years shelf lives and the world scratching around for Oil rather than sustainable alternatives (first generation ethanol is not sustainable) makes you realise that there are plenty of people talking the talk for votes especially in the EU and even plenty of people investing in sustainables but at the same time carbon levels are increasing and not falling.
James Lovelock might be right after all, Hansen seems to be cautioning us Lovelocks way.
Long term climate feedbacks are adding to the arctics woes and possibly causing Greenlands ice to literally slide off into the Ocean. Its all happenning much faster than projection by even the most pessemistic IPCC scenarios.
http://www.carbonequity.info/ the report the BIG MELT found here shows some disturbing Arctic ice data and has viable and valid quotes and links to climate science work although James Hansens recent work is quoted most due to his recent dire forecasts.
Joe Duck, I am not suggesting that Earth will be incinerated by rising temperatures, but rather by human stupidity. Have you been to India? It once had vast forests. They were all cut down–to the point where now the fuel of choice for cooking among the poor is animal dung. I have seen the same thing happen in Niger, and I’m seeing it happen year to year in Brazil. It is not that the people involved didn’t know what they were doing would have long-term consequences. Rather their immediate needs took precedence and chopping up the forests was the easiest way to satisfy them. It appears that the only benefit we derive from the bulge of neurons on the end of our spinal chord is that we know we are rendering our environment uninhabitable.
Re 209 Jim Cripwell, I think Nigel is right. Quite a lot refreezes each year but the density of that refrozen ice is nowhere near as dense as permanent ice that has been sat on and squashed by 1000’s of tonnes of newer ice for thousands of years. So in that exent it is a thin veneer indeed. The blue ice is the dense stuff with very little O2 bubbles within it. That ice takes a lot longer to melt than does the annual ice with a high concentration of O2 bubbles throughout it. What is happening now is each year all of the annual ice melts exposing the permanent ice the warmer elements for more & more days/year, warmer water/warmer wind and even rain; so that’s why you see these huge high chuncks of blue ice coming away and crashing into the ocean. I don’t know but it could well be a blue ice iceberg that broke away from the rest months ago that holed that passenger ship near antarctica a few days ago instead of the annual ice which I would say is too fragile to cause that much damage.
Re 227 catman306. Read the article you mentioned..but rather now wish I hadn’t..wish I could be an ostrich..under the sand looks pretty good!
Do you know if Gavin has raised this issue? We have just got a new gov in Australia whoi promises to be a lot tougher on climate change namely by ratifying kyoto before xmas and setting a 20% emissions reduction taget by 2020..but if Dr Fung is correct the world needs massive emmissions cuts immediately, forget 20% in 13 years..all of our top engineers and scientists have to be mobilised to work together in unison of getting all of our households as carbon neutral as possible immediately and geosequstration has to be developed for factories or industry not just as an academic theory but as working models asap. It doesn’t take a genious to realise that very soon indeed the sea will no longer be albe to absorb CO2 especially at the equatorial regions and the trees ability to transforn CO2 is being impaired already. Only thing that might possible buy us a bit more time is that as the oceans get hotter the incidence of super storms over the seas increases and that hopefully will act to mix the thermal stratas of the ocean and bring more of the cooler water to the top.
“I know it’s flawed logic. I just wanted to see what the replies would be”. This is just juvenile. Is the goal to pollute the comment thread to the point where it becomes unreadable?
Ref 234 and 236. Again I was going to stay out of this, but let me just say a couple of things. There is general agreement that the sun affects climate, but there is disagreement as to how the sun affects climate. Solar cycle 24 has not yet started. Many very competent organizations, e.g. NASA, have computer programs which accurately hindcasted solar activity, but which failed to forecast when solar cycle 24 would start. I know of forecasts between “before Sept 2008” and “not until Nov 2009”. If Dr. Clilverd is correct in his forecast of maximum sunspot number for cycle 24 of 45 +/- 34 is correct, then we will not have seen the sun this “quiet” for between 200 and 300 years.
Re Jim Cripwell @ 245: “Solar cycle 24 has not yet started. …”
Yet that has not stopped you from making repeated predictions, assertions and bets about the coming “cooling.”
RE # 189 (& 167), “We are arguing about AGW, not GW. I claim the data shows that, while the earth warmed up at the end of the 20th century, this warming has ceased. Hurricanes are merely one aspect of this…”
Aside from Gavin setting the record straight, even if hurricanes had become less frequent or intense over the past several years, the point of my #167 post, is that it would not disprove GW or AGW.
I’m thinking that while one could somewhat more successfully use increasing hurricane intensity to support the idea of AGW, the converse just doesn’t work, since there are various non-AGW-related factors that are needed to produce hurricanes, any one of which could be absent, leading to no hurricane that day, despite the presences of the AGW factor of warmer oceans, which favor hurricanes.
The more important point to me regarding hurricanes is that increasingly intense hurricanes viewed as a whole are likely effects of global warming, and are one of many many good reasons to put forth all our efforts to mitigate AGW (so as to reduce this hurricane destruction and many many other harms in the future).
I think while hurricanes could be used in conjunction with other more important proof (such as rising air and sea temps) for GW, they cannot be used (by their absense) for disproving GW or AGW. At that point you’d have to go into looking at whether or not the ocean temp is cooling.
Reply to Nick (149) – the problem is: Cap and Trade doesn’t actually REDUCE CO2 production. It shifts it and masks it. I would rather solve the problem than make me feel good about doing something futile.
“When you buy carbon-intensive energy, or services directly using emissions-producing technology (notably transport), you use some of your quota. If you have extra left over, you can sell it; if you go over, you have to buy extra. Industry has to buy quota, they of course pass on the cost to their customers – when you buy most goods, you don’t have to pay GHG credits, because their cost is embedded in the price. At international level, all (!) that have to be agreed are the global ceiling, how it should be divided between states, and how the agreement should be enforced”
Ref 246. I have read this several times, and I just dont understand what you are getting at. The hypothesis for sun controlled climate is as follows. The later the cycle starts, the lower the expected maximum sunspot number during the cycle is likely to be; the lower the maximum sunspot number the cooler the earth. So if solar cycle 24 has not yet started, it is getting later, the maximum sunspot number is expected to be less, and the earth is expected to be cooler.