Les Chevaliers de l’Ordre de la Terre Plate, Part II: Courtillot's Geomagnetic Excursion
This article continues the critique of writings on climate change by Allègre and Courtillot, started in Part I . If you would like to read either post in French, please click on the flag icon beside the post title above.
Prelude: It’s the physics, stupid
…which of course is a paraphrase of Bill Clinton’s famous quote regarding the economy. We put the last word in small letters since we’ve learned that it is not a good debating technique to imply (even inadvertently) that those who are having trouble seeing the force of our arguments might be stupid. What we wish to emphasize by this paraphrase is the simple fact that the expectation of a causal link between increasing long-lived greenhouse gases (like CO2) and increasing temperature does not rest on some vague, unexplained correlation between 20th century temperature and 20th century greenhouse gas concentration.
The anticipated increase in temperature was predicted long before it was detectable in the atmosphere, indeed long before it was known that atmospheric CO2 really was increasing; it was first predicted by Arrhenius in 1896 using extremely simple radiation balance ideas, and was reproduced using modern radiation physics by Manabe and co-workers in the 1960’s. Neither of these predictions rests on general circulation models, which came in during subsequent decades and made more detailed forecasts possible.
Still, the basic prediction of warming is founded on very fundamental physical principles relating to infrared absorption by greenhouse gases, theory of blackbody radiation, and atmospheric moist thermodynamics. All these individual elements have been verified to high accuracy in laboratory experiments and field observations. For a time, there was some remaining uncertainty about whether water vapor feedback would amplify warming in the way hypothesized in the early energy balance models, but a decade or two of additional observational and theoretical work has shown that there is no real reason to doubt the way in which general circulation models calculate the feedback. When modified by inclusion of the cooling effect of anthropogenic aerosols, the theory gives a satisfactory account of the pattern of 20th and 21st century temperature change.
No other theory based on quantified physical principles has been able to do the same. If somebody comes along and has the bright idea that, say, global warming is caused by phlogiston raining down from the Moon, that does not make everything we know about thermodynamics, infrared absorption, energy balance, and temperature suddenly go away. Rather, it is the job of the phlogiston advocate to quantify the effects of phlogiston on energy balance, and incorporate them in a consistent way beside the existing climate forcings. Virtually all of the attempts to poke holes in the anthropogenic greenhouse theory lose sight of this simple and unassailable principle.
In a paper entitled "Are there connections between the Earth’s magnetic field and climate?" published recently in Earth and Planetary Science Letters, Courtillot and co-authors attempt to cast doubt on carbon dioxide as a primary driver of recent (and presumably future) climate change; he argues instead that fluctuations in the Earth’s magnetic field (partly driven by solar variability) have an important and neglected role. Like most work of this genre, it is carried out in an intellectual void — as if everything we know currently about physics of climate had to be set aside in order to make way for one new (or in fact not-so-new) idea. But the problems don’t end there. With the help of a Comment published by Bard and Delaygue (available here at EPSL or here as pdf) , we’ll expose a pattern of suspicious errors and omissions that pervades Courtillot’s paper. Sloppiness and ignorance is by far the most charitable interpretation that can be placed on this pattern.
Let’s set the stage by noting that, as a significant competitor to anthropogenic greenhouse forcing of recent climate change, the direct radiative forcing by solar irradiance variations is dead on arrival. The solar output has been monitored by accurate satellite instruments since 1978. Measured peak to trough over the 11 year solar cycle, averaging over the Earth’s surface and allowing for albedo, the radiative forcing amplitude is under 0.2 W/m2. The trend left after averaging over the solar cycle is even smaller. This pales by comparison with over 2 W/m2 of radiative forcing arising from long-lived greenhouse gases that have accumulated in the atmosphere since 1750; it pales yet more by comparison with the forcing to come in the future if action is not taken to control emissions. There is nothing in climate physics to suggest that the sensitivity of climate to solar irradiance variation differs substantially from the sensitivity to infrared radiative forcing arising from greenhouse gas changes. As far as the climate cares, a Watt is (for the most part) a Watt, regardless of whether it comes from changes in the incoming solar energy or greenhouse-induced changes in the infrared radiation loss.
To get a bigger bang out of solar variability, one needs to invoke something else about the way the Sun affects climate. Something exotic, like magnetic field variations. Since there is no quantified physical mechanism linking field variations to climate, Courtillot must fall back on showing us a few supposed correlations between temperature variations and magnetic field variations. To make matters worse, Courtillot can’t always make up his mind even about whether an increasing field index should warm the climate or cool it, making it unclear just what correlations one is looking for. The lack of a physical model makes it impossible to treat the various forcings on an equal footing and make a reliable attribution of causes. This is particularly fatal when the various forcings are strongly correlated with each other. For example, on time scales of years to centuries, the magnetic field variability, cosmic rays and solar irradiance vary nearly in lock-step, so if there is a correlation with temperature (or cloud cover) one cannot tell whether it means that climate is responding with high sensitivity directly to luminosity changes, or whether something more exotic is going on. Over a period when temperature, greenhouse gas forcing, and some magnetic field index are all going up, a statistical attribution technique which ignores greenhouse gases and considers only the magnetic field index will of course find that the magnetic field "explains." the signal. If we knew nothing about how CO2 affects climate, this would put the magnetic field on an equal footing with CO2 as a candidate explanation but this is not the case. We know a great deal about how CO2 affects climate and no amount of additional fiddling with cosmic rays or magnetic fields can make this physics go away. One can get even more confused by forgetting about the important role of anthropogenic aerosols in the past century, as Courtillot all too often does.
The confidence with which Courtillot casts doubt on the generally accepted role of anthropogenic forcing in climate change of the past century is surprising, in view of the essential limitations of any argument from correlation alone. But it’s worse than just that: as Bard and Delaygue show, most of the correlations upon which Courtillot et al. rest their flimsy case are in fact bogus.
Solar variability and climate: The Good, the Bad, and the Ugly
Work on the influence of solar variability (and on its close cousin, the influence of the Earth’s magnetic field) tends to fall into one of three categories. There is the Good, in which careful scientists do their objective best to unravel a complex and probably small (but nonetheless important) signal. As examples of work in this category, I would mention Judith Lean’s tireless efforts on relating luminosity to sunspot number, the work of Bard and colleagues on developing isotopic solar proxies like 10Be, Shindell’s work on response to solar ultraviolet variability, and the work of Foukal et al on factors governing solar irradiance variations. I would also include the recent work by Camp and Tung diagnosing the amplitude of the solar cycle in temperature in the "Good" category; that it is an easy paper for greenhouse skeptics to misquote takes away nothing from the quality of the science. In fact, I’d say most work on climate and solar variability falls into the Good category. That’s rather nice. In fact, scientists have long recognized the importance of solar variability as one of the factors governing climate (see the very scholarly review of the subject by Bard and Frank, available here at EPSL or here as pdf) An understanding of solar variability needs to be (and is) taken into account in attribution of climate change of the past century, and in attempts to estimate climate sensitivity from recent climate variations. Further, the Little Ice Age demands an explanation, and solar variability at present provides the only viable possibility. (It’s less clear that the Medieval Warm period is a sufficiently coherent phenomenon to require an explanation).
Then, there is the Bad, exemplified by two papers by Scafetta and West that have been discussed on RealClimate here and here. This is just normally bad science, in the sense that there is something wrong in the approach taken by the authors which leads to erroneous conclusions. Perhaps some of this work should never have made it through peer review, but as long as the methods are well documented and honestly described, subsequent investigators will be able to identify the errors and either salvage or discard the results.
And then … there is the Ugly. These papers cross the line from the merely erroneous into the actively deceptive. Papers in this category commit what Damon and Laut judiciously call a "Pattern of strange errors.". Papers in this category often use questionable (and often hidden and undocumented) data manipulations to manufacture correlations where none exist. The work by the Danish solar boosters, discussed extensively by Damon and Laut, typifies the Ugly category. We’ll leave it to the reader to decide, after the discussion to follow, whether Courtillot’s paper is merely Bad, or has crossed over into the Ugly.
Spin vs. Scholarship
The general style of discourse in Courtillot et al. has more in common with the kind of one-sided polemic one finds in Lomborg or the Robinson et al. fake PNAS article distributed with the original Global Warming Petition Project than it does with scholarship whose intent is to get at the truth. It quotes papers uncritically and selectively if they can be made to appear to support the authors’ thesis (e.g. the uncritical use of the aforementioned single-factor Scafetta and West paper to support a large attribution of twentieth century climate change to solar variability). There is also a lot of general spin here; for example, greenhouse gases are listed last in a laundry-list of things that can affect climate, without any indication as to the relative magnitudes of the various forcings. Other problems include the following:
- Courtillot exaggerates the cloud radiative forcing by a factor of four, because he attributes virtually all the Earth’s albedo to clouds and fails to take into account the cloud greenhouse effect.
- He says that "Cooling from 1940 to 1970 is often disregarded as being part of the noise" whereas in fact it was intensive study of this period that lead scientists to appreciate the importance of the anthropogenic aerosol effect, at the time of the IPCC Second Assessment Report. Again ignoring the well-documented importance of anthropogenic aerosols, he says later: "Note that the leveling or drop in temperature from 1940 to 1970 matches solar and magnetic series, and not the monotonous accelerated rise in CO2" Not only is this a Crichton-esque obfuscation of a well-understood phenomenon, but as we’ll see later the supposed "match" is an artifact of questionable data manipulations.
- Courtillot points to an energy-balance model study by Crowley as support for his thesis that there is some missing physics left out of models, which affects response to solar forcing. Specifically, Courtillot points to a model/data mismatch in the early 20th century. However, Crowley did not include the indirect aerosol effect, and the energy balance model has no geography and therefore can’t be expected to model things like continental vs. ocean seasonal cycles or ice and snow cover with complete fidelity. General circulation models forced with a combination of natural (including solar) and anthropogenic (aerosol and greenhouse gas) forcing have no problem reproducing early 20th century climate. Further, Crowley’s model accurately matches the observed response to solar forcing earlier in the millennium, so it is hard to see why the "missing physics" should suddenly kick in at 1850. It is always suspicious when selective quotes are used to draw a conclusion exactly opposite to what the paper’s own author concludes. For the record, here is what Crowley himself says in the paper about his own results:
- There are therefore two independent lines of evidence pointing to the unusual nature of late-20th-century temperatures. First, the warming over the past century is unprecedented in the past 1000 years. Second, the same climate model that can successfully explain much of the variability in Northern Hemisphere temperature over the interval 1000–1850 indicates that only about 25% of the 20th-century temperature increase can be attributed to natural variability. The bulk of the 20th-century warming is consistent with that predicted from GHG increases. These twin lines of evidence provide further support for the idea that the greenhouse effect is already here.
- Courtillot also cites an atmosphere-ocean model simulation by Zorita et al. (2004) as support for his claim that models fail to represent the 20th century response to solar or magnetic variability. However, as discussed here and in the peer-reviewed references cited therein, this simulation suffers from an inappropriate initialization which leads to a spurious cooling in parts of the run, and a large climate drift requiring detrending of the output before analysis. Besides that, the model explicitly neglects anthropogenic aerosol forcing, so how could one expect it to get 20th century climate right?
- Courtillot claims that the correlation between geomagnetic "jerks" and Alpine glacier advances supports a solar-magnetic influence on climate. As Bard and Delaygue emphasize, this requires an exactly opposite sign of response to magnetic field variations as claimed by Marsh and Svensmark (2000), and as assumed elsewhere in Courtillot’s paper. Courtillot cooks up an ad hoc explanation for why this might be the case, but this leads him even farther afield from anything that can be justified by known, quantified physics. One can find all sorts of correlations if one allows oneself the liberty to change the sign of the sought-for relation whenever convenient, and without any constraint by physics.
- There is hardly anything more embarrassing to a theory than success in explaining a phenomenon that turns out not to exist. Courtillot makes much of the fact that the millennial cycle of hematite-stained ice rafted debris in Gerard Bond’s data set — taken at the time to be a proxy for North Atlantic temperature — lines up nicely with geomagnetic variations. However, as Bard and Delaygue note, later work with better chronology, more cores and better time resolution show that Bond’s record does not represent a temperature index for the entire northern Atlantic region. The more complete record exhibits little or no relation to geomagnetic variations.
…and now for the really ugly part
Bard and Delaygue uncovered a number of errors of a more troubling nature. Courtillot et al. commit the "flat Earth" error from which our article draws its name: they give a misleading impression of the comparison of forcing by solar variability relative to greenhouse gas forcing by failing to take into account the Earth’s spherical geometry and albedo. After the very public humiliation suffered by Le Mouel on this point at the Academie debates (see Part I), in his article in La Lettre Courtillot took pains to show that he indeed understood the consequences of the Earth being round. However, this new understanding did not result in any sign of a corrigendum being sent to EPSL, so one can only conclude that the deception is deliberate. Further in their Fig. 1 Courtillot et al. show geochemical data from a Central Alpine stalagmite which purports to establish a highly tight correlation between climate variations and a solar activity proxy; as Bard and Delaygue note, Courtillot and co-workers have concealed the fact that the correlation is so good precisely because the chronology of the two series being compared has been finely tuned to expressly maximize the correlation. The original untuned data does not show nearly so tight a correlation.
The piece de resistance of Courtillot et al., is the following graph, which purports to show that for almost all of the past century, temperature correlates tightly with solar activity and magnetic field variability. The three curves on the graph are, according to the paper, Phil Jones’ global mean temperature record (Tglobe, in red circles) , a total solar irradiance reconstruction (S(t), in pink triangle; Courtillot cites Solanki’s reconstruction in the text), the magnetic field variability index at a site in Scotland (ESK, blue) and at Sitka Alaska (SIT, green). All the curves have been centered to have the same mean and standard deviation over the length of record, so as to make them more comparable. Note that the S(t) curve spans a shorter time than the others; this turns out to be important.

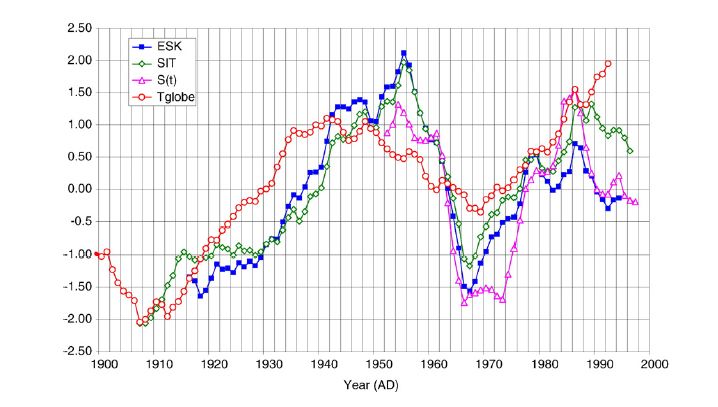
Looks pretty good, eh? Well it would, except for the minor details that "S(t)" is not actually the solar output, "Tglobe" is not actually the Jones global mean temperature it is claimed to be and neither "ESK" nor "SIT" look much like broader-based magnetic variability indices that provide more reliable indicators of solar activity. Bard and Delaygue thought it curious that Courtillot would use just the final snippet of the Solanki record when the full century was available. They checked what the curve would look like if it were normalized using the full length of the record. That’s the thick grey curve in Bard and Delaygue corrected version of the figure below; for comparison, the purple curve with triangles shows the results of using Solanki’s reconstruction truncated to the period Courtillot chose.

Get the picture? By snipping out just the last bit of the curve and normalizing to unit standard deviation, Courtillot inflates the variability and makes the fit look better than it would be if the full data set were used. As a bit of deceptive data manipulation, this has to go down in history with the selective smoothing used on some of the solar records that Damon and Laut discuss in their critique of the Danish solar work. Now, in his response to Bard and Delaygue (there’s always a response to Comments) Courtillot digs himself even deeper into a hole. He states that the reason he used a truncated solar series is that the data came not from Solanki (as implied in the paper), but rather from Tobiska’s SOLAR2000 model product. Tobiska’s paper is not even cited by Courtillot et al. (2007), whereas Solanki (2002) is cited there as well as in the authors’ earlier papers on related subjects. There is no legitimate reason for using SOLAR2000 in a study of the sort Courtillot et al. are attempting since, as noted by Bard and Delaygue, the SOLAR2000 model is restricted to the ultraviolet portion of the solar spectrum, making it the wrong choice unless one is explicitly investigating phenomena linked to ultraviolet forcing (see Lean (2002) ). One could guess that Courtillot et al.pulled this convenient rabbit out of the nearest available hat, because it was the first curve they found that gave them some excuse to truncate the record in a way that gave the desired result.
Bard and Delaygue noticed another strange thing. Courtillot’s "Tglobe" curve did not look much like the curve published by Jones. Jones’ curve, plotted from his actual data files, is shown in Bard and Delaygue’s corrected version of the figure; they also show the NASA reconstruction for comparison. These two curves are in agreement, but neither shows the sharp rise/dip pattern between 1940 and 1970 which is seen in Courtillot’s figure. So if Courtillot’s data is not Jones’ global mean temperature, what is it that Courtillot plotted? We may never know. In his response to Bard and Delaygue, Courtillot claims the data came from a file called: monthly_land_and_ocean_90S_90N_df_1901-2001mean_dat.txt. Bard and Delaygue point out, however, that Jones has no record of any such file in his dataset, and does not recognize the purported "Tglobe" curve as any version of a global mean temperature curve his own group has ever produced.
Whatever the source of the purported "Tglobe" data given in Courtillot et al., there is no legitimate reason — in a paper published in 2007 — for truncating the temperature record at 1992 as they did. There is, however, a very good illegitimate reason, in that truncating the curve in this way helps to conceal the strength of the trend from the reader, and shortens the period in which the most glaring mismatch between solar activity and temperature occurs.
In the corrected graph, Bard and Delaygue also plot the "aa" geomagnetic index. This is an index based on two stations at antipodal points, which has been found to correlate well with the overall geomagnetic variability based on a larger network of stations. One could argue that if one is looking at global mean temperature data, the aa index provides a more appropriate basis for comparison than the single-station high Northern latitude records that Courtillot uses. Note that the aa index tracks Solanki’s solar irradiance well, whereas the single-station measurements do not.
In the corrected graph, Tglobe, aa and S(t) track each other upward from 1900 to 1940, but note that greenhouse gases also go up monotonically in this period, as they do later. A purely statistical attribution could ascribe nearly all the changes from 1900-1940 to solar or magnetic variability, but a similar statistical attribution could do the same for greenhouse gases. Only physics can divvy up the blame. Since 1940, however, there is not even the appearance of correlation between Tglobe and either S(t) or any of the geomagnetic indices. There is a hump in both the solar and aa index around 1950, during which time the temperature is flat or decreasing. Courtillot’s erroneous analysis defers the decorrelation until 1985.
Between the embarrassing showing at the Academie debates and the travesty of science exposed by Bard and Delaygue in the case of the EPSL paper, You’d think that Courtillot would want to fine the nearest hole and go hide in it. Far from it, he was recently spotted giving a talk called "What global warming?" at this prestigious event gathering several famous physicists and chemists. Some people have no shame.
Postlude: Of silk purses and sow’s ears
Bard and Delaygue conclude with a figure, reproduced below, which nicely illustrates something we’ve been saying for years at RealClimate. On this figure they plot the Jones global mean temperature together with a global magnetic index (the aa index), a cosmic ray flux index (Climax) and the PMOD composite satellite record of solar irradiance. These curves are less smoothed than those shown in the preceding graph. The inter-annual temperature variability is linked to natural effects such as major volcanic eruptions, ENSO events and solar variability. However, only the Tglobe curve is characterized by a very significant upward trend — a trend which cannot be explained by these natural causes.

Say it three times every night before going to sleep: Temperature goes up. Solar stuff goes up and down and up and down and up and down. You can no more make a trend out of that than you can make a silk purse out of a sow’s ear.
A note added in proof, concerning the "Note Added in Proof"
The above discussion was based on the version of Bard and Delaygue’s comment and Courtillot’s response which was available on the Elsevier web site through December 15. Since the time of writing, some strange changes have occurred under the direction of the responsible editor, Robert van der Hilst of MIT. He deleted the "Note added in Proof" from the final version of Bard and Delaygue’s comment. Bard and Delaygue only found out about this when they received the proofs of their Comment. What is even more disturbing is that van der Hilst allowed Courtillot to change the text of his Response based on what Bard and Delaygue wrote in the now-deleted "Note added in Proof." Bard and Delaygue were given no opportunity to see or comment on these changes. I have left the above discussion as it is, in order that the reader will have a better appreciation of the strange history of this comment/response cycle.
In the revised "Response" Courtillot now admits that the temperature record called "Tglobe" is not from any of Phil Jones’ datasets at all. Courtillot now claims that the data came from a study by Briffa et al. (2001), giving the address of a file stored at NCDC. As specified in this study and in the head of this file, these data have been "recalibrated to obtain estimates of April-September mean temperatures from all land regions north of 20N". Thus, the temperature dataset used by Courtillot is definitely not Tglobe, does not represent the full hemisphere, and moreover is not even an annual mean.
Rob van der Hilst — recently a Visiting Professor at IPGP (Courtillot’s institution) — claims that these changes were made in the interests of scientific communication. I leave it to the reader to judge whether these actions were appropriate, or whether they were just an attempt to protect Courtillot from embarrassment.. In the interests of scientific communication, I append below the full text of the "Note added in Proof" which was stripped from Bard and Delaygue’s Comment:
Note added in proof:
In their Response to our Comment, Courtillot et al. state that for the total irradiance curve S(t) they had used the SOLAR2000 model product by Tobiska (2001) instead of the century-long record by Solanki (2002) cited in their original paper (Courtillot et al. 2007). However, the SOLAR2000 model is restricted to the UV component and their total solar irradiance is severely flawed as pointed out by Lean (2002).
For the global temperature Tglobe curve cited from Jones et al. (1999) in Courtillot et al. (2007), these authors now state in their response that they had used the following data file: monthly_land_and_ocean_90S_90N_df_1901-2001mean_dat.txt We were unable to find this file even by contacting its putative author who specifically stated to us that it is not one of his files (Dr. Philip D. Jones, written communication dated Oct. 23, 2007).
Tobiska, W. K. 2001, Validating the solar EUV proxy, E10.7, J. Geophys. Res. 106, 29,969- 29,978.
Lean, J.L., 2002. Comment on ”Validating the solar EUV proxy, E10.7” by W. K. Tobiska. J. Geophys. Res. 107, (A2), 1027, 10.1029/2001JA000137.


Español
Türkçe
Português
Slovenčina
Svenska
Български
Deutsch
Chinese (simplified)
Japanese
Italian
Finnish
Czech
Polski
Climate
18 December 2007 at 12:50 PM
The newscientist had an article that seemed to blame the fall in global temperatures in the 50s to sulphate aerosols.
http://environment.newscientist.com/channel/earth/mg19225822.300-histories-the-ice-age-that-never-was.html
[Response: Yes, indeed. That is the best-supported explanation for the interruption in global warming in the 50’s, and indeed in some regions this even shows up as an actual decline in temperatures. There is more uncertainty in aerosol forcing than in GHG radiative forcing, but what I said about “it’s the physics” applies to cooling influences like aerosols as well as warming influences like GHG — if somebody wants to say phlogiston (or magnetic fields) explain mid-century cooling, they can’t just ignore the known influences of aerosols when trying to do an attribution. –raypierre]
18 December 2007 at 1:20 PM
raypierre
for the Camp and Tung paper, I don’t understand, as I said in a precedent post, how it is possible that a 0.17W/m2 radiative forcing leads to 0.18°K temperature increasing.
The 0.17W/m2 solar forcing in 5.5 years (between a minima and a maxima) corresponds to 0.031W/m2.y .
You said that oceanic thermal inertia doesn’t react in the same manner because it is a rapid variation compare to GH effect increase.
For this last effect,if I take +2ppmCO2/y I find 0.028W/m2.y.(for CO2 only and without other GHG, aerosols, ..).
So how do you look at this (apparent for me) contradiction?
[Response: You’ve put your finger on precisely the puzzling thing about the C&T results, which will need to be sorted out by a more detailed analysis of the oceanic response in the IPCC AR4 models. I can only explain their result by a combination of high sensitivity and low thermal inertia. But why should the thermal inertia that explains the solar cycle response be so much lower than the thermal inertia needed to explain the seasonal cycle over oceans? Camp and Tung are on to something interesting, but I don’t think it can be said that we understand what is going on yet. ]
But I think that also part of your problem is that you double-counted the geometric factor. That .17 W/m**2 I quoted already has the albedo and sphericity terms taken into account. As for your comparison to CO2, it is indeed true that taken over the time between solar min and solar max, the solar radiative forcing fluctuation is larger than that due to CO2 increase over the same period. However, when you compare the min to max solar forcing to the net GHG radiative forcing over the past century, solar looks like a minor player — especially in view of the fact that the min to max solar cycle amplitude is not the relevant number, For that , one needs to look to the long term trends in solar irradiance. –raypierre]
18 December 2007 at 2:09 PM
Raypierre mentioned phlogiston, clearing scoffing at the likelihood that it has anything to do with climate. However, last summer, in a journal RC readers might recognize, I ran across:
“Climate science and the phlogiston theory: weighing the evidence”
Arthur Rorsch, Energy & Environment 18, number 3-4, 2007. p441-447(7).
http://www.ingentaconnect.com/content/mscp/ene/2007/00000018/f0020003;jsessionid=7abb5un7rjvfi.henrietta
But, seriously, thanks for the nice analysis.
18 December 2007 at 2:58 PM
Great deconstruction job, Ray.
C’est accablant , but alas, totally unsurprising. Here is a little tale to give it context.
I happened to be passing through the IPGP this past January, when Courtillot and Allègre launched “allègrement” their Spring 2007 “climate skepticism seminar series”. It started with the visit of well-known climate skeptic Richard Lindzen (MIT) - one of the few skeptics to actually know something about climate .
What non-French readers may not be aware of, is how abrasively obnoxious Allegre and his clique have been to the country and the entire French research community - some will say since 1968, when Allegre apparently showed himself so unbearable that he got literaly thrown out of the window at a student meeting in La Sorbonne (first floor …). There are countless such stories which need not be repeated here.
As a young and innocent student who got into Earth Sciences in 1998 (while Allègre was still ministre de la Recherche et de l’Education ), all i could hear about, anywhere i went, was resentment towards his bullish and pretentious practices. I originally thought it was born out of jealousy for his political success, but had to surrender to the evidence : obnoxious is his style and did not improve after his tremendous unpopularity forced him to resign from the ministry.
On the contrary, it seems that he’s been missing media attention , and that gratuitous climate skepticism has given him an ideal platform to get closer to a mic.
The Lindzen seminar started by a pompous introduction by his first lieutenant (squire ?) Courtillot about how misguided climate science currently is, and the need to do this work “properly”. His tone was the usual heatedness and anger that i have seen stain all his recent public addresses. Needless to say, there was considerable uproar in the room, with much of the Parisian climate community come to hear the fireworks. Allègre’s clique on the front row vs climate scientists filling much of the room behind them. Lindzen bemusedly watched the verbal joust for a good 10 minutes, fully aware that he the fight was not about him.
Clearly, it was not about climate science : it was about Courtillot and Allègre throwing “a stone in the pond” of climate scientists, desperately trying to come out of political oblivion.
Add to that Courtillot’s notorious tendency of defending ideas in the face of a towering pile of evidence (like that of all major mass extinctions, in particular the Cretaceous/Tertiary one, having been caused SOLELY by volcanic eruptions), and there is little wonder what this is about : Devil’s advocacy as an attention-seeking practice.
It is very sad, because their track record does prove that they can do good science when they want to. Like Lindzen…
18 December 2007 at 3:07 PM
I admit I have my doubts about the Camp & Tung result. I’m not saying it’s wrong, just that I have my doubts.
For one thing, they detect solar-cycle response of 0.18 K, but in an earlier version of their paper the same graph which has this number has a different number quoted, namely 0.10 K — I’d need more details about their procedures to understand why. For another thing, I’m doubtful of the validity of their projection of the global temperature spatial pattern onto the “composite mean difference,” by which they transform global average temperature to a newer, modified temperature time series — I suspect this step may artificially inflate the solar-cycle response. Again, I’d need more details to say with confidence. And then there’s the fact that none of the temperature time series I’ve studied (HadCRU-T3 and GISS GLB_Ts+SST) show statistically significant response to the solar cycle, although they do not constrain the response to be less than the Camp & Tung value (at the upper limit of the error range).
If Camp & Tung turn out to be right, it wouldn’t disturb me too much in terms of the rapid response. After all, the climate system has more than one active time scale; while the oceans drag their feet, the land-atmosphere system responds quickly (as volcanic eruptions confirm).
In any case, I repeat that I’m not saying they’re wrong, just that I have my doubts.
As for the paper by Courtillot which is the subject of this post, it looks to me like it has gone way past “bad,” deep into the bowels of “ugly.”
18 December 2007 at 7:38 PM
Raypierre,
What an interesting post. It reads something like a spy novel.
The ‘Note added in proof’ appears in the PDF version at the link you gave: http://www.realclimate.org/images/BardDelaygue.pdf. That version is the ‘Article in Press’ version, not the published version. You may want to clarify this to avoid confusion.
As you say, the ‘Note added in Proof’ is gone from the online version currently available at on the website at ScienceDirect. It is intriguing to compare the ‘Article in Press’ version with the published version. Very strange editorial practice.
[Response: Yes, I ought to clarify that. The pdf linked is the version I downloaded from the EPSL site before van der Hilst deleted the Note. I made a separate copy mainly so readers without access to the journal could still read the comment, but in the end it served a separate purpose in providing a record of the original form. –raypierre]
18 December 2007 at 7:42 PM
Thanks for mentioning phlogiston, one of my favourite examples of how scientific theories develop.
This whole episode reminds me of one of my observations on the overall debate. It is a sophomoric debating trick to bolster a weak position by accusing the other side of all the flaws in your own argument — very effective when being judged by an audience unable to evaluate the argument on its merits.
John Mashey’s reference (#3) to a phlogiston paper provides a classic example. Almost everything they say to establish conventional climate science as the new phlogiston applies much more aptly to their side of the debate.
Let’s try a few arguments from the contrarian side:
* the “mainstream” is about correlations with no underlying physical model
– nope, there are numerous examples of this kind of bogus study in the contrarian camp, especially the various “blame the sun” positions which lack elementary tests of physical validity, like does the solar variance measured account for the change in observed temperature?
* the fits look good because the data has been massaged
– again, the solar crew is widely guilty of this: see not only this paper but also Soon and Baliunas’s “it’s all the sun” papers
* the mainstream is ignoring significant factors, only looking at CO_2
– not guilty: many contrarians on the other hand are happy to model the entire climate as controlled by a single variable; IPCC et al. generally try to include all quantifiable influences
I could go on but you get the picture.
The point is to recognize this stuff for what it is, and expose this debating tactic.
18 December 2007 at 10:14 PM
Great post, Raypierre! My you’ve been busy the past week or two!
[Response: Yah, time to get back to writing the book, I guess. At least I still managed to finish grading my final exams only a week late. I very much appreciate all the words of encouragment from the readers. –raypierre]
19 December 2007 at 12:11 AM
Minor quibble: Arrhenius 1896 provided the first measurement of the radiative forcing due to CO2 and estimated the potential impact of variations in its concentration. However, it wasn’t until ~1908 that Arrhenius connected this to fossil fuel consumption to predict that temperatures would increase. Before that realization, speculations about CO2 were purely of academic/historical interest.
Incidentally, he estimated that it would take 3000 years for fossil fuel consumption to have a meaningful impact on climate. Sadly, he underestimated man’s enthusiasm for burning fossil fuels.
19 December 2007 at 1:45 AM
You forget two things involving Allegre:
1. On the timescale of the Archean, a century and 10,000 years are both negligible.
2. A change in mean surface temperature of 5 degrees make no substantial difference to the cooling curve of a 1750 degree komatiite.
19 December 2007 at 1:59 AM
Physicists have put so much effort into measuring absorbtion and reflection of every wavelength by every concievable form of matter. There are also innumerable spectrometers in chemistry departments. I haven’t checked, but I would guess that other departments would also have spectrometers. And you would think that Courtillot did not have access to the MIT Wavelength Tables.
It is really hard to understand how anybody could avoid the idea that the absorbtion bands of every gas have been cataloged and re-measured about a jillion times. Perhaps all high school students should be required to take 4 years of physics in which they spend about a semester measuring the spectra of CO2 and other things.
Another subject I would like to read RealClimate’s comments on: See the chart on page 274 of “Six Degrees” by Mark Lynas. Mark Lynas says we have until 2015 to BEGIN REDUCING our total CO2 output and we have until 2050 to actually reduce our CO2 output by 90%. Mark Lynas says if we don’t follow the schedule in Six Degrees, we will encounter positive feedbacks which will take the control of the climate out of our hands. Civilization may fall anyway well before 2050, but we can avoid going extinct by 2100. Mark Lynas says we have to hold the CO2 level to 400 parts per million to have a 75% chance of avoiding the positive feedbacks. Is Mark Lynas correct? 8 years is a very tough timetable to stop the building of coal fired power plants and replace some coal fired power plants with nuclear. I doubt that anything else other than a plague that kills a few billion people could make a dent within 8 years.
[Response: From other estimates I’ve seen, Lynas’ timetable seems about right if the goal is to avoid 450 ppm. To avoid 400ppm, even his timetable is a bit of a stretch. However, with regard to the impacts of exceeding 400ppm (or even 450ppm), if you are quoting Lynas correctly I would differ with his assessment. There is no magic threshold crossed at 450 that commits us suddenly to the kind of catastrophic changes you mention, and certainly not to extinction of humanity by 2100. If we can’t hold the line at 450, there are still harms to be avoided by stopping short of doubling. If we can’t stop doubling, there are still harms to be avoided by preventing tripling, and so forth. But his general sentiment that we can’t drag our feet on this is correct. –raypierre]
19 December 2007 at 2:15 AM
re4
Thanks for reminding us of the deposit of academic skeletons at the K-T boundary. America may require automation to catch up to the reflexive polemics of the IPGP:
http://adamant.typepad.com/seitz/2007/02/climate_of_list.html
19 December 2007 at 2:23 AM
Interesting.
One thing I’m very confused about. I assume what we are talking about here is not inherent variations in the Earth’s magnetic field (e.g. its dipole moment) due to the Earth’s internal dynamo, but rather variations in the external field due to external forcings (e.g. the solar wind)? What is the basic idea? Is that energy is pumped into the atmosphere, say, by Alfven waves coming down through the ionosphere?
It would be nice to have an explanation of the physical mechanism that Courtillot supposes, and a back-of-the-envelope calculation giving the order of magnitude of the effect he would expect based on theory, independently of the empirical results. That’s the sort of thing I’d expect as a referee, anyway.
Thanks,
Peter
19 December 2007 at 2:25 AM
> It is really hard to understand how anybody could avoid the
> idea that the absorbtion bands of every gas have been cataloged
> and re-measured about a jillion times.
Those avoiding this utter certainty that the science knows everything precisely can mostly be found publishing papers in the field.
I won’t pretend I know what this means, but I take it they would disagree with your claim that everything is known already:
“The following improvements to Heller’s theory have been made: (a) derivation of new recurrence relations for the time-dependent wave packet overlap in the case of frequency changes between the ground and electronically excited states, (b) a new series expansion that gives insight into the nature of Savin’s preresonance approximation, (c) incorporation of inhomogeneous broadening effects into the formalism at no additional computational cost, and (d) derivation of a new and simple short-time dynamics based equation for the Stokes shift that remains valid in the case of partially resolved vibrational structure. …”
http://scitation.aip.org/getabs/servlet/GetabsServlet?prog=normal&id=JCPSA6000127000016164319000001&idtype=cvips&gifs=yes
J. Chem. Phys. 127, 164319 (2007) (15 pages)
Published 30 October 2007
[Response: There’s plenty in spectroscopy remaining to be understood, particularly with regard to the CO2 continuum as it applies to Venus and Early Mars. The theory behind collision-induced absorption is still pretty flaky. None of that compromises the kind of stuff that’s needed to accurately calculate the GHG radiative effect in Earthlike conditions. ]
19 December 2007 at 3:12 AM
Minor point but your lead quote is from James Carville and not Bill Clinton.
[Response: Thanks for that. Though Carville coined the phrase, it was widely used in the 1992 Clinton campaign; I can’t say that I’ve found any evidence that Clinton himself ever uttered it, though. Digging around, I also found out that the sign Carville posted in headquarter’s didn’t have the “it’s” which somehow got added in later. –raypierre]
19 December 2007 at 3:40 AM
Raypierre : the SOLAR2000 model is restricted to the ultraviolet portion of the solar spectrum
I used to think SOLAR2000 model (now Solar Irradiance Platform - SIP) is an irradiance specification tool which produces the full solar spectrum of historical Sun variations (or spectral formats, like UV, if needed for research). Do you have more precise information for SOLAR2000 limited to UV spectrum?
[Response: What I said applies more specifically to the Tobiska et al. application. Take a look at the paper by Lean cited in the “Note Added in Proof” and see if that helps. –raypierre]
19 December 2007 at 5:47 AM
Interesting case, Ray. Media and the public are constantly remarked to refer to peer reviewing as the only credible source of information. The EPSL is not the last scientific publication, it has a reputation. If this case has been unveiled, how many other cases of “strange” reviewing may have been passed without notice?
And should the public be informed about such cases, or may this harm science at all?
[Response: Certainly the public should be informed. Cover-ups are never good. When faults in the editorial process are exposed, there’s a better chance that they will be fixed. It would be easy to misread an incident like this as devaluing everything in the peer-reviewed literature, but that would be unfair. Cases like this are pretty rare. Usually, reviewing works pretty well, and even when something bad (or ugly) slips through, it is caught by the scientific community pretty quickly, if the result is important enough to check. That’s why it’s important not to make judgements based on an individual paper, but instead to watch for the follow-up. –raypierre]
19 December 2007 at 6:32 AM
Re #11, yes he is essentially correct I believe. The subject has been discussed here under the term “alarmist and alarmism”. Due to uncertainties and non linear nature of the earth system of which climate is a part there are unknowns in regard to how the earth will respond to increased CO2 levels. Sulphates, aerosoles, clouds, forest cover and ice albedo all are understood within boundaries and the paleoclimatic record indicates that 1.4 to 4.5 (ie a mean of 3) is the range of temps available for a pre industrial doubling of CO2.
is climate is more sensitive than reported (IPCC often criticised for being too conservative) then we might experience 0.3/0.4 C per decade warming as oppossed to the current 0.2C and if levels get higher than yer 1.6C is already guaranteed (hence adapting to CC is needed) and another 0.4c is not far away. only one or two decades depending on sensitivity.
19 December 2007 at 8:59 AM
Edward Greisch posts:
[[ 8 years is a very tough timetable to stop the building of coal fired power plants and replace some coal fired power plants with nuclear.]]
You’re right. We’ll have to replace them with conservation, solar thermal, photovoltaic, wind, geothermal and biomass.
19 December 2007 at 11:12 AM
“it’s important not to make judgements based on an individual paper, but instead to watch for the follow-up”
Agreed. New science needs some time to season (i.e. weather criticism) before it can be safely taken up by policy makers. Haste makes waste.
[Response: To amplify on that sentiment, though, I do think it is fair to take into account the track record of the investigator, the degree of support for the idea that can be seen in prior work, and the nature of the argument when making a jugement of what the long term assessment is likely to be — while waiting for that assessment to materialize. Thus, while one ought to wait to see how the results of Camp and Tung hold up, given that Tung is quite meticulous and given the straightforward nature of his analysis of the solar cycle in the AR4 archive, I feel pretty confident that that result is likely to hold up. We shall see. Whether the observed solar cycle in surface temperature is as large as .17K (as in Camp and Tung) or more like .1K (many previous estimates) is somewhat more in doubt, as is their interpretation in terms of low thermal inertia and high climate sensitivity in energy balance models. –raypierre]
19 December 2007 at 1:50 PM
Some press coverage of this affair appeared in Liberation today. Check out http://www.liberation.fr/transversales/futur/298894.FR.php
19 December 2007 at 1:59 PM
And a report also in Le Monde:
http://www.lemonde.fr/web/article/0,1-0,36-991405,0.html
I think maybe the word “fraud” used in the headline of this article is going further than can actually be demonstrated at this point, which is why I preferred the judicious phrase used by Damon and Laut in connection with other work of this type: “A pattern of suspicious errors.” Other than that, I think the article captures the nature of the issues pretty well.
19 December 2007 at 2:49 PM
Raypierre, I agree that fraud is too strong. I might choose delusion. The really odd thing is that with 10% of the effort the authors have devoted to deceiving themselves, they could actually understand the physics. It really does emphasize the importance of consensus in science.
19 December 2007 at 2:57 PM
Edward Greisch wrote: “8 years is a very tough timetable to stop the building of coal fired power plants and replace some coal fired power plants with nuclear”
Barton Paul Levenson: “You’re right. We’ll have to replace them with conservation, solar thermal, photovoltaic, wind, geothermal and biomass.”
Conservation and efficiency are by far the fastest and most cost-effective ways to reduce carbon emissions, especially in the USA where we are profligate wasters of energy, and thus can easily reduce our energy consumption and associated emissions by applying readily available conservation and efficiency measures.
On the supply side, there is some very good news today: the California-based company Nanosolar has begun shipping their thin-film photovoltaic panels. The first panels will be used in a solar power plant in Germany, which will initially produce 1 megawatt of electricity. According to Nanosolar, their new ultra-cheap, flexible thin-film PV panels will enable the production of solar electricity for less than one dollar per watt — less than the cost of fossil-fuel or nuclear generated electricity. While the initial product offering from Nanosolar is for utility-scale applications, the same technology will eventually be available for small-scale distributed applications, including residential rooftops. Nanosolar says that their entire planned production of thin-film PV panels for 2008 has already been sold.
19 December 2007 at 5:39 PM
And yet more press:
http://www.20minutes.fr/article/202189/Sciences-Les-sceptiques-francais-du-climat-accuses-de-tricherie.php
19 December 2007 at 6:15 PM
#21, 22, 25…
Yes, a good example of what we call “pensée unique” in France: tomorrow, it will be l’AFP, Le Figaro, L’Humanité, this week-end Le Nouvel Obs, L’Express and Le Point, next month Science & Vie, La Recherche and Sciences & Avenir… But I’m pleased to sea how my French colleagues are now vigilant for dubious curves and how they’re interested in solar effects on climate. I’m sure that beyond the polemic, they will from now on inform their readers on real climatic debates in a more balanced way.
19 December 2007 at 9:18 PM
raypierre (#25) wrote:
Swweeet!!
I had to run it through Google Translator, I’m afraid. (My apologies, but I took German due to Kant — and didn’t do terribly well at that. Not that much point, I suppose: I am told that Kant gets taught in the English translation in Berlin — as he is more easily understood by native German speakers that way.)
While I am sure that more than little was lost in translation, it looked devastating, hitting a number of the major points — and your critique on Real Climate received a fair amount of space. They did far better job than I have come to expect from the US press — but then it would be quite a different world as of recent if the US press generally rose to the level of mere mediocre performance.
Incidentally, I enjoyed your critique. Quite thorough. And it gives us a bit more insight into the kind of politics which can get that sort of paper in print.
[Response: Without divulging any privileged information, I can say — as one who has himself had some experience as an editor — that another factor in such papers getting into print is that it is often hard to find qualified reviewers who are willing to take the time to delve into a paper like Courtillot’s. Everybody has a lot of demands on their time, and it is much more productive to ones’ research to spend time with good and interesting papers rather than bad ones, especially in view of the fact that there are so many of the latter. For every four papers like this that get stopped in review, one is bound to get by, just through exhaustion of the reviewer pool. Some editors are better than others at tapping into a pool of suitable reviewers, and it helps if a paper is bad in an interesting way, and is laid out so one can at least follow the argument. No reviewer is likely to go through the amount of work Bard and Delaygue had to do to dig out the flaws in Courtillot’s paper, especially since work of that sort done at the review stage never sees the light of day. –raypierre]
19 December 2007 at 11:36 PM
I have been in communication with Rob van der Hilst, who is understandably more than a little unhappy about my commentary on the way he handled the Comment/Response to Courtillot et al. I somewhat regret bringing up the issue of possible problems with the EPSL editorial process at all, given that it is a side-show to the main issue at hand, which is exposing the nature of the arguments in Courtillot et al. However, I thought it necessary for the readers to know the full history of how the true data source for the supposed “Tglobe” came to be known, and of who first pointed out the problem with Courtillot’s use of the Tobiska solar data series. I did not see any way to explain this without bringing Rob’s name into it, given that he was the responsible editor and made all the decisions. I tried to present the sequence of events as best I could infer them from what appeared on the Elsevier web site, augmented by a few queries I put out (none of which went directly to Rob; remember I am a scientist, and not schooled in the reflexes every professional journalist has).
I invited Rob to give his view of the editorial process here, but he did not want to pursue it in this forum. In lieu of that, here is a second try by me, to present the basic facts of the matter in the most neutral possible manner, taking into account Rob’s perception of what went on. I would be interested in what the readers make of this. In the same spirit, I emphasize that I stated Rob’s professional connection with IPGP purely as a matter of relevant background information. I of course am not a mind reader, and can have no knowledge of what role this connection may or may not have played in the way Rob chose to handle this. So here goes:
As I stated originally, at the proof stage of their Comment, Bard and Delaygue had the opportunity to see Courtillot’s Response. Noting the peculiarities in the Response regarding the solar and Tglobe dataset, they felt that in light of this new information an additional remark was called for, and for want of any other vehicle proposed handling it as a “Note added in Proof.” This is quite standard editorial practice when there is a late-breaking development, and when such a note is added to a regular journal proof, the Editor generally has leeway to accept or deny the note. In this case, the Editor articulated the opinion that the Comment/Response cycle was closed and no further information should be introduced, and the Editor feels he exercised his Editorial discretion to deny the approval of the Note Added in Proof. Bard was left with a very different impression of the outcome, particularly in view of the fact that his Comment was posted on the Elsevier preprint section with the Note intact. As far as I can tell, there was no further communication with Bard and Delaygue concerning the matter until the final prepublication proofs were sent. When it came time for final publication, the Note had disappeared. I suppose Rob would say that he intended this all along, and that the appearance of the Note on the posted Preprint version was an oversight; I am only guessing about that, though. At some time before final publication, van der Hilst, having declined to exercise his editorial discretion to re-open the “closed” Comment/Response cycle when it came to Bard and Delaygue’s “Note Added in Proof,” decided to exercise his editorial discretion to the extent of re-opening the “closed” cycle in order to allow Courtillot to modify his Response so as to take into account the points raised by the Note Added in Proof.
So there they are, just the facts, Ma’am (as they used to say on Dragnet), in the most unvarnished way I know how to present them, and as best they can be known to me. I would be very interested in what conclusions the readers draw from this sequence of events, what may or may not have been lost by handling things this way, and how the readers feel the matter should have been handled, if they do not feel it was handled correctly.
20 December 2007 at 12:19 AM
Thanks for the great article. Indeed, I do find it very suspicious that you see the same names over and over, regurgetating the same nonsense over and over. Same stuff as well- water vapor, CO2 lag, 1940-70 cooling, MWP, ad nauseum. The number for S&W solar number keeps getting higher and higher, I’m sure we’ll see a “70% solar contribution” in some 2010 paper, but who knows
One point that has been made on and off before, but needs to be repeated was the point on the concept that there is only one way to look at radiative forcings: the sum of them all. The scientific basis for anthropogenic climate change is there, but now we find some unknown forcing, or some forcing is a bit higher than we suspect, etc. You can’t just now “replace CO2.” The logic of “the sun is going up, so now we can have a picnic because there will be no problem or we can’t do anything about it, and CO2 is falsified” is high level nonsense: I’d be much more worried if the sun is going up, and CO2 is going up. Heck, if Svensmark or Shaviv is right, Scafetta and West is right, the CO2 forcings are right, Courtillot is right, etc then we really are screwed!
I do need clarification on one point though. Say we have Total forcing represented by Ft which equals 10 W/m-2 (hereafter just the number), where F1 + F2 + F3 = Ft. Say we think F1 = 4, F2 = 11, and F3 = -5 (so 10). Now say that it turns out through further tests that F1 really equals 7, not 4. First of all, don’t we know the “total” forcing, (that is we can quantify the radiative imbalance and tell you how much Ft is, like now it is ~1.6 W/m-2). So that means if a partial forcing goes up, doesn’t another partial forcing need to go down (or throw in a negative F4)? Since we know Ft = 10 ( i.e. back to the real world, don’t we know the imbalance is 1.6 W/m-2 now so dont all forcings need to add up to the imbalance?)
[Response: We have estimates of the imbalance through looking at heat storage in the ocean and looking at the surface energy budget, but I’ll defer to Gavin on how accurate those estimates are. He was directly involved in that area. So far as I am aware, satellite data isn’t yet accurate enough to detect the top-of-atmosphere imbalance, but somebody please correct me if there are new developments in this area. But the more important thing to note is that the imbalance is emphatically not the same as the radiative forcing. If you doubled CO2 and let the system come into equilibrium, the imbalance you’d measure from space would be zero — but there would still be about 4 W/m**2 of radiative forcing from the change in CO2. Radiative forcing is not a zero-sum game in the sense you laid it out, but it is fairly standard practice to use the observed temperature record to put some constraints on both climate sensitivity and the magnitude of unknown forcing. For example, we know the past CO2 radiative forcing to very high accuracy, but there are more uncertainties in the aerosol forcing; applying a consistent climate sensitivity to both CO2 and aerosols, you can get a match to the observed record for a range of different supposed aerosol forcings, but you can’t take it too far. If you set the aerosol forcing to zero you don’t get the mid-century interruption of warming, and if the aerosol forcing were allowed to get as big as, say, 10 W/m**2 you would get excessive cooling unless you imposed a very low climate sensitivity — which would then make it impossible to reproduce the post-1970’s warming. You get the picture. Crowley’s paper is a nice one to read to see how this is done, since it’s done with an energy balance model where you can see the big picture without a lot of complications –raypierre]
20 December 2007 at 12:46 AM
I’ve had enough experience with the referee process not to believe for a nanosecond that the reason this paper was published was anything other than the name of the first author, pure and simple. I’m sorry, RayPierre, but I don’t buy your argument. Editors are politicians, like it or not.
20 December 2007 at 1:18 AM
#29 response- Thanks, I’ll look into it
#30
things that are wrong, and things that seemingly have the intent to deceive makes their way into peer-review quite a bit (moreso the former, which is good). I am a bit disappointed in the peer-review process, actually, given the abundance of literature that RC and other places need to cover because of errors. I also don’t think that the name of the guy was a significant part of Ray’s argument, and you can focus on issues like the objection paper, as well as why Damon and Laut had to write a paper on “suspicious” papers.
20 December 2007 at 4:09 AM
Raypierre,
Whatever measures you adopt for tactical reasons, please never abandon the 10 foot baguette.
20 December 2007 at 8:39 AM
Raypierre, I have also had a little recent experience with a bad paper that “slips through the cracks”. A paper I reviewed had some very serious errors. I pointed these out and suggested a major revision, thinking (indeed hoping) that the paper would go away. Alas it did not, and the second draft was much improved, though still flawed. Again, I pointed out the flaws and made suggestions. Like a bad penny, it came back for a third revision, then a fourth. After several cycles of this, with the journal editor under significant pressure to publish from the authors and under deadline, I gave my final review, detailing the remaining errors, suggesting corrections (some quite involved), but not requiring further review. I was conflicted. I know the final paper will be quite flawed. It will present some interesting ideas from a different perspective than the community gets, though, and the final product will be much better than it started out. Perhaps I should have held firm against publication of a crappy paper, but one must make a judgement whether the modicum of good in a paper might outweigh the bad. I decided that my peers are big boys and girls and will be able to sort out the good from the bad.
Perhaps Rob made a similar judgement, and I’m certain he is chagrined to find this playing out on the pages of the French media. Unfortunately, however, I think he was in a no-win situation. Had he rejected the paper or had he allowed the Note, he would have been accused by denialists of “being part of the conspiracy,” and that would have played out on the pages of the National Post, the WSJ and other contrarian rags (remember Benny Peiser’s ill-fated “rebuttal” to Oreskes’s work). I suspect that editors face considerable pressure to allow into print the work of contrarians unless it is beyond all redemption. So crap gets into print precisely because contrarians demand a voice and all there is to publish, once you remove all the real climate science, is crap.
20 December 2007 at 9:13 AM
Hello, and thanks Ray for this interesting saga on aour french climate-skepticals. I just updated my website to signal that two major daily newspaper in France have published article yesterday on this story. Here are the links for french speaking people…
On Liberation, http://www.liberation.fr/transversales/futur/298894.FR.php
On Le Monde, http://www.lemonde.fr/web/article/0,1-0@2-3244,36-991405@51-853716,0.html
20 December 2007 at 9:57 AM
#11 and “Civilization may fall anyway well before 2050, but we can avoid going extinct by 2100.” I read SIX DEGREES last summer, and from what I recall, Lynas did not imply this. His idea (as I remember it) was that we would likely COMMIT the world to great harm (as 55 or 251 mya) if we reached 3C warming, in that slow positive feedbacks would eventually push us to 4C, then 5C & 6C. However the harms would take a long time (centuries, perhaps millennia) to completely play out, even after reaching 6C. More like bleeding to death from a thousand small wounds than a sudden (within this century) total wipe-out.
And I think Ray is right, that no matter how bad it gets, we could still lessen the harm, or slow its realization.
20 December 2007 at 10:22 AM
raypierre says:
“At some time before final publication, van der Hilst, having declined to exercise his editorial discretion to re-open the “closed” Comment/Response cycle when it came to Bard and Delaygue’s “Note Added in Proof,” decided to exercise his editorial discretion to the extent of re-opening the “closed” cycle in order to allow Courtillot to modify his Response so as to take into account the points raised by the Note Added in Proof.”
this is a clear-cut case of editorial misconduct. It has happened to me too
in this particular way with the addition that after the comment/response
cycle was closed our refereed reply was shown to the commenter who
was then allowed to modify the comment which was subsequently (re-)accepted
with no further review. At that point we threatened to sue the editorial
board (the comment touched on being libellous as we were advised by an
in-house lawyer). After the threat we got a letter from the editor that
stated the commenter had withdrawn the comment after considering our
reply. We let the matter end there, although we have the editor
admitting on letter-head to a violation of the editorial policy that governs
commets/replies. Go figure.
20 December 2007 at 10:29 AM
>>>>
Courtillot also cites an atmosphere-ocean model simulation by Zorita et al. (2004) as support for his claim that models fail to represent the 20th century response to solar or magnetic variability. However, as discussed here and in the peer-reviewed references cited therein, this simulation suffers from an inappropriate initialization which leads to a spurious cooling in parts of the run, and a large climate drift requiring detrending of the output before analysis. Besides that, the model explicitly neglects anthopogenic aerosol forcing, so how could one expect it to get 20th century climate right?
>>>>>
Dear Raypierre,
your and Courtillot’s discussion of the Zorita et al (2004) simulation are inaccurate. Contrary to Courtillot et al (2007) the NH T trend simulated by the model in the 20th century does by no means differ from observations by a “factor of three”, but rather is about 10% larger than in the observations. I do not know on which grounds Courtillot et al (2007) reach such conclusions.
Your are right when you state that that particular simulation was not driven by anthropogenic aerosols and therefore a match to observations should not be necessarily expected. However, the simulation does not show a “spurious drift” and the output does not need to be detrended at all. You have probably mixed up several things here: another, different and longer, simulation with the same model - which actually your link refers to; the issue of detrending or not detrending in the context of climate reconstructions; and the issue of the use of flux-adjustment (the output of some models that do not use it may display a spurious climate drift - our model is however flux-adjusted).
Unfortunately the Courtillot et al paper and this part of your post can be quite confusing to the readers in this respect
[Response: Thanks for the clarification. I read your paper (which had some very interesting points, by the way) and from the description there it looked to me like the simulation was the same one as we discussed previously on RC. You’re the one who knows for sure, though, so I’ll defer to you on that. Given the number of papers I needed to read in order to check the claims made in Courtillot et al., I was not able to spend as much time with each one as I would have liked. I will point out that with regard to the claims made by Courtillot regarding your results, flux adjustment introduces similar issues to detrending. These issues are not necessarily important for the things you were trying to do with the model, but they are relevant to the way Courtillot was trying to spin the results. –raypierre]
20 December 2007 at 12:03 PM
Gavin, Ray, anybody,
I’ve written a popular article on the saturation argument. It’s got some math in it, but nothing harder than algebra. About 2400 words. Can you think of any place that would take something like this? I emailed Physics Today, but they never replied.
[Response: You might try American Scientist, which is the house magazine of the scientific honor society, Sigma Xi. –raypierre]
20 December 2007 at 1:45 PM
Raypierre and also Chris (comment 29) noted that “sceptics” should not just magically forget about or omit the established greenhouse gas physics when trumpeting exotic solar explanations for current warming. But as far as I can tell, most sceptics don’t flat out deny greenhouse gas warming, but they incorporate their “extra” forcing by assuming a lower climate sensitivity. That way they don’t have to completely deny basic physics, and they throw the exotic stuff in by using the relative uncertainty of climate sensitivity as a free parameter so to speak. By doing so they may actually deny the constraints that there are on sensitivity, that I’m not sure about.
20 December 2007 at 1:57 PM
FWIW, journal editors have the role of bringing the maximum information to the readers not acting as judges between the parties with the sole and vital exception that they must make an editorial decision that the the correction is worthy of consideration. It is all to easy in a controversy to try and cut it off (which is the mistake that the editor here made), but I see nothing wrong with showing the information to the original authors for their comments. There is no “deadline to meet” and the process takes as long as it takes. That does not mean that when one of the parties starts sprouting nonsense the editor cannot rule the nonsense offsides, or cut off the process when no new information is being added.
I have been on both sides of this, and consider myself fortunate in the editors that handled the situations. I have, through the guidance of those editors, learned a lot about these situations. A word of advice to those submitting comments - keep it short, only comment on things you definitely can prove.
[edit]
20 December 2007 at 3:01 PM
#24, SecularAnimist: Here’s another company in the thin film solar panel business that’s just getting started. They expect to be selling their panels for about a dollar a watt also.
http://www.toledoblade.com/apps/pbcs.dll/article?AID=/20071219/BUSINESS03/712190411
I think it’s pretty interesting that just today, Pres. Bush said that nuclear is the “best” way to combat global warming. Oh well.
20 December 2007 at 4:35 PM
My Repulican friends couldn’t wait to inform me of the Senate report just posted to Imhof’s Press blog:
http://epw.senate.gov/public/index.cfm?FuseAction=Minority.Blogs
If anyone ever needed a complete guide to the “scientific Denialist’s”, this report should do it.
The authors of the paper under discussion are prominently featured.
[Response: Yeah, this is pretty much a non-story. All you have to do is look at the names and some of the creative accounting used to bulk up the list. For example, they’ve added pretty much all of the names of Lomborg’s “Copenhagen consensus,” even though most arent’ scientists. Then, there’s the trick of including, say, all the co-authors of the Courtillot article, even though some of them (like Fluteau) certainly would not describe themselves as skeptics. There is Avery, with his “unstoppable global warming” nonsense (and no peer-reviewed scientific publications). There are a few real scientists, like Allegre and Courtillot (’nuff said about that), plus a lot of nonentities whose lack of credentials you can spot just by running their names through Web of Science. If this is the best 400 names that Inhofe can scrape together, then the denialist crowd is really in bad shape. I don’t think it needs any more comment than that. –raypierre]
20 December 2007 at 4:41 PM
Raypierre, re. 29 “We have estimates of the imbalance (energy) …looking at the surface energy budget,”
For determining surface energy budget, do you mean by measuring borehole evidence or other means?
http://www.sciencemag.org/cgi/content/full/297/5579/206?ck=nck&ijkey=TgKv6oKI2SgcE&keytype=ref&siteid=sci
[Response: No, for long term heat storage it’s only the sea surface that counts. What I had in mind were estimates of net surface imbalance using boundary layer models driven by meteorological observations. –raypierre]
20 December 2007 at 7:57 PM
RE #42 Paul Middents:
Yeah that tidbit was brought to my attention as well. It is on today’s Drudge Report. Everything in one overwhelming re-package. BTW, the paper under question is exactly the kind of item that will be brought up again and again to show that there is still a scientific controversy. Excellent critique, Raypierre, and thanks for all the dispatches from San Fran.
20 December 2007 at 8:06 PM
A bit off topic for this thread, but certainly relevant to RC:
Here’s an clever approach to getting people to think about AGW and its consequences:
http://www.switched.com/2007/12/19/high-school-teachers-global-warming-video-a-youtube-hit/
Of course, he probably won’t change the minds of many die-hard skeptics, as is evident from the comments listed below the video window.
20 December 2007 at 8:39 PM
Editorial Handling of Comments and Replies
However necessary, a Comment and Reply procedure always demonstrates a failure of the publication system: noble material appears in full-blown regular papers. During 11 years of editorial tenure in major geophysics journals, I always agonized about how Comments and Replies should be handled, especially when one of the parties is as prejudiced as in the present case. I stick to two principles: (1) the Comment and Reply exchange thread can’t go on forever, and (2) the defense (Replyer) should have the last word and not be opposed arguments that they can’t respond to. Clearly these principles are a potential source of frustration for the Commenter when the Replyer’s good faith is an issue. Finding editors of high stature is already a very difficul task but if you now hold them liable for all the mistakes, lapses, and twists slipping into each manuscript, this task will soon prove impossible.
[Response: Very true words,and indeed an Editor is in a bind when one of the parties (the Reply party, in this case) is acting in bad faith. If I have some complaint about the way the Editor handled this, it is that to me the way out of the dilemma was much more indulgent to the bad-actor (Courtillot) than to the white-knight who put in the work to dig out the errors. Further, it was surely relevant information that in the initial Reply, Courtillot attempted to deceive yet again, by giving the name of a purportedly global dataset that turned out not to exist, and was certainly not the one used by the authors. It was only on the second attempt that the name of the real data (which turned out to be neither global nor annual) came out. Surely this history is relevant information, which should have been preserved. In fact, it was preserved, but only because, by luck, I happened to be writing my post based on the earlier version of Bard and Delaygue’s comment, before the Note was deleted and Courtillot’s Reply was modified. In the end, some critical information did get out, but if it werent for these fortuitous circumstances, some critical information would have been lost as well. –raypierre]
21 December 2007 at 12:26 AM
I have no envy for editors, and I am sure it takes herculean strength to resist the arm-twisting they’re subjected to, but time and again one sees that
(1) Progressive, unconventional ideas from young researchers are biased against,
(2) Regressive, outdated ideas from old farts who should just get out of the way, are biased for.
In other words, scientists are actually phenomenally conservative; something the right wing clearly just doesn’t get.
You can still find papers being published from time to time on non-cosmological redshifts of quasars, for example, which is total nonsense, but it is a regressive idea held onto by old cranks who don’t believe in general relativity and have names big enough to get their ideas to press.
The whole peer-review system is a mess. The public thinks that being peer-reviewed is a stamp of approval, which it isn’t, and editors themselves aren’t clear on precisely what refereeing/editing is supposed to accomplish. Last time I looked, the major astrophysics journals did not publish any basic position statements on what, exactly, being approved for publication was supposed to significate. So how is the public supposed to figure it out if the scientists themselves don’t even know? I’d love to hear it if the situation were different in geophysics.
[Response: I wouldn’t go so far as to say that it’s a mess, but I do think that it is overloaded. The journal Atmospheric Chemistry and Physics has an interesting new angle on this. Reviews are anonymous, but they are posted for the public. In addition, the general readership can post comments and suggestions on a preprint, just as on a blog. As I see it, though, the main problem is that people are writing too many papers, many of which are just not that significant. Everything would work more smoothly if more people held their fire until they had something fairly important to say. Unfortunately, a lot of the reward structure is not set up to foster that. –raypierre]
21 December 2007 at 1:20 AM
Dear Raypierre,
Thank you for your post and clarification. I completely agree with what you wrote (and also with Bard & Delaygue’s paper…).
Just to add my grain of salt, I recently (i.e. before your posts) had a conversation with somebody at IPGP who explained me the context of Courtillot et al.’s EPSL paper:
In 2003, Gallet and others (incl. Courtillot) published in EPSL a study on paleomagnetism from archeologic data over the last 3 millennia. Le Mouel, Kossobokov and Courtillot published a paper in EPSL in 2005 on the magnetic field and climate. For some reason Courtillot wanted to paste the two papers together, hence the list of authors. The latter 2005 paper made (admittedly too little) noise in the climate science community. But nobody, including Edouard Bard, seem to have had the time to respond to the paper. I just remember that I was extremely perturbed by the abundant use of the adjective “significant” in the text, while no real quantification of this signifiance was provided. The other thing that should strike any non specialist is that temperature (whatever its true reference!) always leads the solar and geomagnetic data by a few years… oh well, I just told to myself that the paper would not take long to be forgotten…
So, it appears that the present controversy originates from the 2005
EPSL paper. In the unlikely event that the 2007 paper is withdrawn or whatever, there remains the 2005 paper, which everybody seem to have forgotten and contains the very same flaws outlined by Raypierre, and Bard and Delaygue in the 2007 paper. Incidentally, this also says that Courtillot never cared to improve his physics of climate between 2005 and 2007.
To conclude, with colleagues, we had thought of nominating Allègre and Courtillot for an Ignobel award (say, in the climate nonscience
category), but it turns that the Ignobel awards are given to true
results (albeit strange!) and they probably would not be qualified.
Best to all and joyeuses fêtes,
[Response: The remark about the 2005 paper raises another troubling question about the 2007 Courtillot et al paper — As far as I can tell, there is little if anything new in this paper beyond what has been published by the authors in the authors’ previous works. In essence it is a review article, not a research article. Yet, it does not appear to be one of the invited EPSL “Frontiers” reviews. Does EPSL now publish unsolicited submitted review articles? I wasn’t aware that it did. So how did it happen that this paper was even allowed to enter the review process, let alone survive it? Curioser and curioser. (et joyeuses fêtes!) –raypierre]
21 December 2007 at 6:09 AM
To #47
To paraphrase Churchill, peer review is the worst form of editorial handling except all the others that have been tried. We can also joke about either old farts resisting change (fair enough) or that younger ones see themselselves as creative because they never read anything more than 5 years old (equally true). Junior and senior scientits having a different perception of science is a good thing after all: energy arises from differences in potential. The science you inherit today was left to you by this less than perfect system. We all fell victim to abusive or incompetent reviewers. Good reviewers (and editors) are rare and overtaxed. I fear, however, that if they know their reports will posted, many of them simply will decline the review. Don’t throw out the baby with the bath water!
21 December 2007 at 10:26 AM
Francis Albarede, A very thoughtful post. The thing is that peer review typically serves many functions. Yes, it should serve as a barrier preventing very bad science from seeing the light of day, but more commonly its role is to take decent science and push it into the realm of good science. Often, peer review is problematic for either really great or really bad papers. In the former case, the author may be saddled with lots of trivial changes, or worse yet be asked to make changes that weaken the paper. And in the case of very bad papers, the sheer persistence of an author can result in the paper tunneling through even if it is deeply flawed. Fortunately, science is strong enough to deal with these failings–enough scientists will recognize great work once it is published to ensure it is incorporated, and crappy papers usually get the obscurity they richly deserve (it’s a lot harder to tunnel your way to general acceptance than it is to tunnel through the review process).
The main problem comes when you bring in the lay public or reporters, who often are not sophisticated enough to separate the wheat from the chaff and who often uncritically accept peer review as a seal of approval by the scientific community. People need to understand–peer review is a minimum threshold. The real stamp of approval is scientific consensus.
21 December 2007 at 11:41 AM
Is there any similarity here?
http://www.sgr.org.uk/climate/StormyTimes_NL28.htm
21 December 2007 at 11:53 AM
Parallels:
http://www.csicop.org/doubtandabout/deja-vu/
[Response: Some parallels are apt; in this case, it wasn’t that the article was sent to an obscure journal; EPSL has a fairly high profile in the areas in which it is strong. EPSL isn’t generally obscure, but it is fair to say that work in climate and atmospheric science is not its most familiar territory, and this was compounded by the paper having been sent to an Editor whose own field was completely orthogonal to climate science. That limits both the ability to judge the paper, and more importantly the pool of reviewers that are likely to respond to review requests. What isn’t apt is the analogy between de Freitas and van der Hilst. While de Freitas is described as a known CO2 skeptic in Mooney’s article, I have no reason to believe that van der Hilst is any kind of a CO2 skeptic, and much reason to believe the contrary. If there is any question regarding the editorial process, it stems from the following considerations: (1) It might have been better to hand the paper off to an Editor with more experience in climate, and (2) It might have been better to hand the paper off to an Editor who had less strong professional ties to IPGP. I am not saying that I have any evidence that the latter consideration compromised the editorial process, but I think it is unavoidable that the awkwardness of passing a strong judgement on an author who is both a colleague and a director of an institution at which one might want to spend more sabbatical and summer visits, could make it hard to be as fully objective and as forceful as might be warranted. It is a case where avoiding even the appearance of a conflict of interest could have avoided a lot of possibly misdirected suspicion and misunderstanding (some of it perhaps even on my part). –raypierre]
21 December 2007 at 2:06 PM
This controversy is ridiculous and it is getting worst. Some reporting in this post is worthy of the worst tabloids. Courtillot’s paper maybe garbage, it is sloppy, it may be completely wrong, but it is certainly not worth such turmoil. And had Edouard Bard done his job and reviewed the paper when he was asked, Courtillot’s paper would not have been published in the first place. What is clear from the reporting in the French press is that this post is being used for some kind of power struggle within the French scientific community. I hope Raypierre is not a willing party in this campaign of slander. I personally find that there is no excuse for using innuendos to try and tarnish the reputation of someone like Rob van der Hilst who did his job. “misdirected suspicion and misunderstanding (some of it perhaps even on my part)” You are not very subtle, Raypierre.
[Response: I never claimed to be subtle. May I ask what is your source regarding the people asked to review Courtillot’s paper? It was my understanding that such information is usually considered confidential. One can only speculate on what would have happened with a different set of reviewers; I myself, when acting as a reviewer, have seen many papers published over what I considered to be quite well-reasoned objections. Regarding the “academic power struggle,” the only struggle I see is the struggle to expunge the stain of Courtillot and Allegre’s junk science from climate policy debate in France in particular, and on the world stage in general.
If this were a routine sloppy paper by some unknown, the errors would have received little attention, even if there is a pattern that appears to systematically overstate the authors’ thesis. By becoming the public face of French climate skepticism, however, Courtillot has made himself a public figure, so how can it be surprising that this paper becomes news? As the responsible editor, van der Hilst has just been caught in the crossfire, but it’s hard to see how a journalist could avoid mentioning whose watch this all occurred on, and what the full history was. –raypierre]
21 December 2007 at 2:30 PM
In reply to Peter Wilson #13
“It would be nice to have an explanation of the physical mechanism that Courtillot supposes, and a back-of-the-envelope calculation giving the order of magnitude of the effect he would expect based on theory, independently of the empirical results. That’s the sort of thing I’d expect as a referee, anyway.”
I would be interested in others thoughts on this subject. Has anyone else looked at geomagnetic field intensity variance with time? Does the geomagnetic field vary over time? Is there any evidence of a cyclic change in the geomagnetic field?
“Time variations in geomagnetic intensity”, by J.P. Valet
http://ssn.dgf.uchile.cl/home/informe/2001RG000104b.pdf
Last 75 kyrs.
Look at figure 9, in this paper.
Geomagnetic field intensity during the interglacial period is 2 to 3 times the intensity, of the field strength during the glacial period, over the last 75,000 years.
Comments:
1)Note figure 9, shows a determination of geomagnetic field intensity over the last 75,000 years using two different methods. A)The analysis of volcanic data which is not temperature sensitive and B)The analysis of ocean floor sediment which is temperature sensitive.
2)The controversy in determining the geomagnetic field intensity, beyond 75,000 years is to appropriately correct the ocean floor sediment data for temperature affects. Valet believes that the geomagnetic field intensity cannot track planetary temperature and hence has “corrected” the ocean floor proxy data for temperature, beyond 75,000 years. (i.e. The geomagnetic field intensity correlates closely to planetary temperature before correction.)
3)There are claims that the geomagnetic field intensity has a 100 kyr cycle.
21 December 2007 at 3:08 PM
You are not subtle, but you pretend to be naive. “the only struggle I see is the struggle to expunge the stain of Courtillot and Allegre’s junk science from climate policy debate in France in particular, and on the world stage in general”. Come on! They have all the influence they deserve, i.e. zero, in France or on the world stage.
[Response: I hope that at least the latter part of what you say is true; others don’t see it that way. As for the first part, I’m not pretending, I really am naive
Seriously, a problem with blogging is that sitting in my pajamas late at night in front of the fire with my laptop open, it does sometimes become difficult to remember that there are thousands of people out there listening. –raypierre]
21 December 2007 at 6:21 PM
May I submit what might be a hopelessly oversimplified question? In paragraph three of the article above, you say:
“(T)he basic prediction of warming is founded on very fundamental physical principles relating to infrared absorption by greenhouse gases, theory of blackbody radiation, and atmospheric moist thermodynamics. All these individual elements have been verified to high accuracy in laboratory experiments and field observations. For a time, there was some remaining uncertainty about whether water vapor feedback would amplify warming in the way hypothesized in the early energy balance models, but a decade or two of additional observational and theoretical work has shown that there is no real reason to doubt the way in which general circulation models calculate the feedback. When modified by inclusion of the cooling effect of anthropogenic aerosols, the theory gives a satisfactory account of the pattern of 20th and 21st century temperature change.”
Now as a layman, when I read something like that from someone of your obvious expertise, I’m inclined to believe that AGW hypothesis is firmly rooted in fundamental physics and that its hypothesis has been properly tested.
Then, however, I read this article: http://www.realclimate.org/index.php/archives/2007/12/tropical-troposphere-trends/#more-509
I see in that article that the range of outputs from the GCM models is, to this laymen, quite large. How — if the physics are so certain and so thoroughly tested and properly understood — can the range of model outputs be so large?
[Response: First, notice that they all show warming. Second, while the basic physics behind the CO2 effect on warming is very secure, there is uncertainty in the physics behind some of the amplifying feedback factors — principally clouds. That uncertainty leaves much more room for bad things to happen on the high side than it does for the warming to be much more moderate than the mid-range. Third, if we are looking at the warming so far, the signal is still relatively small because of ocean delays and because we’ve only gone a modest way toward doubling CO2. That means that offsetting factors with some uncertainty, like aerosols, have a lot of potential to make large relative swings in the amount or pattern of the warming. As time goes on and CO2 increases, the greenhouse gas radiative forcing will increasingly dominate such things. However, the uncertainty regarding how much clouds amplify the warming will remain, though there will be more data to use to test cloud behavior. –raypierre]
21 December 2007 at 7:25 PM
Ray, thank god.
I’m looking for some help on data posted by GISS. This is what they wrote:
“GISS-ER
Data issues:
All rlus/rlds files were initially incorrectly saved. Values over the ocean have however been retrieved and are available by ftp for all experiments.
rsdscs fields were calculated by sampling only clear sky boxes and cannot be compared to other models that calculated clear sky values for all boxes.
As described in Hansen et al (2005; 2007a (in press); 2007b (in press)), stratospheric ozone depletion over the period 1979 to 1997 was originally underestimated by a factor of 5/9. Simulations with the corrected ozone changes are available: 20C3M and AMIP experiments. ”
what does the 5/9 factor have to do with? it seems vaguely familiar…Struugling with physics here perhaps you can help me.
[Response: I appreciate your confidence in the comprehensiveness of my knowledge, but the factor of 5/9 doesn’t immediately ring a bell with me. 2/7, yes, 1/4 definitely, but not 5/9. I am not familiar with everything in all three of the Hansen et al papers you mention; I’d take a look but I’m about to shut down for Christmas and there are a few other critical things I need to clear off the desk first. Try me again in the New Year if you haven’t gotten an answer from Gavin or one of the others by then. –raypierre]
[Response: The 5/9 came from applying an 18 year ozone trend as if it were the decadal trend. It was just a simple mistake and was fixed in the online data. - gavin]
21 December 2007 at 10:36 PM
I guess it’s time for me to begin winding down, and to commence the preparations for Christmas. My thanks to all who have commented here, and to all who have shown an interest in this article. My apologies to any I may have inadvertently offended, and may they find it in their hearts to forgive me if my passion for this subject (and my frustration with efforts to obscure the truth) may sometimes lead me to rhetorical excess. I will leave this thread open, and look forward to catching up with you all in the New Year. Meanwhile, to all a jolly Waes Hael!
21 December 2007 at 11:03 PM
raypierre, anything else to add on the topic of “ocean delays” (#56) and “rhetorical excess” (#58)? Hank Roberts is patiently trying to help me out on another thread, but it isn’t really working out. (I enjoyed your book, BTW. Good luck with that in the New Year.)
21 December 2007 at 11:30 PM
Is there a scientific interest in discussing geomagnetic field intensity variance or in research concerning solar modulation of clouds?
1) In terms of modulation of GCR, the geomagnetic field variance (full variance from Laschamp minimum to interglacial maximum, according to Svensmark) only results in a 10% affect on GCR over the geomagnetic field intensity range. Therefore, according to Svensmark, geomagnetic field variance is not a first order climatic forcing factor, which I believe is supported by most in this forum.
2) Solar modulation of clouds is, however, according to Svensmark, a first order climate forcing function which is in disagreement with what has been stated in this forum.
3)There must a physical reason/cause for the apparent cyclic geomagnetic field variance and its apparent correlation with temperature. As an aside, if you are interested in the geomagnetic field and reversals (which is a separate subject from climate change if Svensmark is correct), I thought Ryskin’s hypothesis is interesting. I have reviewed all papers Ryskin’s referenced in this link and have found that they do support his hypothesis.
Origin of the Geomagnetic Field by Ryskin.
http://arxiv.org/abs/astro-ph/0312617
Comment:
There are a number of researchers that have presented interesting data and analysis to support the solar modulation of cloud hypothesis (such as Palle, Svensmark, Shaviv, etc.) I do not understand why we are discussing Courtillot’s weak paper.
22 December 2007 at 1:47 AM
Mr. Astley, put the other names into the Search box; they’re all discussed extensively at RC in earlier threads.
22 December 2007 at 6:16 AM
Could 5/9 be about the conversion of Deg F to Deg C?
[Response: Not in this case - gavin]
22 December 2007 at 9:20 AM
EPSL has currently 8 editors and the tradition is that authors “shop” for whichever editor they see as the most suitable for their paper. The upside is that they can pick up an editor for being more competent or less biased (I used either virtue as an author). The downside is that the editor will have to edit papers outside of his field of competence. One of the most seminal and most cited papers of my long term with this journal was one I accepted in spite of three unfavorable reviews. Ray Ladbury’s concept of “tunneling” tells it all. We have to live with the fact that such a system has pros and cons.
Another aspect that does not show in the discussion is that solid earth geophysics is a damn small community. It is not because van der Hilst would not spend July in Paris that he would not closely relate to Courtillot or Allegre! Van der Hilst is Chair of the Seismology Section of the American Geophysical Union and as such voted last week the AGU motion calling for a reduction of greenhouse gas emissions. Do not make him one of the CO2 sceptics.
Do not expect this incident to remain isolated, whether Bush and its likes will use it or not. Talk to biologists and geneticists: they are under the barrage of the creationists. Ask Pinker how much garbage he got for claiming that much of the human behavior is in the genes and not imprinted by the capitalistic society. We have to learn how to live and work amidst permanent hostile reactions to even the strongest concepts that we all struggled to establish. And, in the interest of science, I see some advantage in such a situation.
Edouard Bard and Gilles Delaygue did their job, an expert job, and they must be commended for it. Let now the French scientific community and IPGP heal their wounds.
Ray Ladbury: thanks you, your message will mean a lot to all the editors.
22 December 2007 at 11:46 AM
Francis Albarede, I think that it is useful to remember that while science is a noble endeavor, it is a human endeavor. This is why science advances by no single research result or scientific paper, but rather by the collective efforts of the scientific community. Any of us can be wrong. All of us have our biases. It is our colleagues (and reviewers and editors) that keep us honest.
The current story is actually a success story for science. A really bad article found its way into print, but was discovered for what it was, vivisected and can now sink into the obscurity it so richly deserves. That’s science. It is one of the few human endeavors that works consistently. Anti-science types can rail against it. They can attempt to subvert it. They can even try to imitate it (as with ID, climate denial,…). However science is predicated on the premise that the evidence will support the truth, so if you reject the evidence, you can’t arrive at the truth. As long as we cleave to the high ground, we cannot lose.
22 December 2007 at 12:25 PM
The “cannot be found” file “monthly.land_and_ocean.90S.90N.df_1901-2000mean.dat.txt” can be easily downloaded on the following NOAA site : http://www.ncdc.noaa.gov/oa/climate/research/anomalies/anomalies.html.
It is a little surprising to see that Bard and Delaygue were not able to find this kind of file.
For people familiar with temperatures series, this format is the signature of a NOAA ascii files.
Concerning their fig. 1, I agree that there are discrepancies between the original set of figures and the Courtillot’s one. But :
- the sharp rise/dip pattern between 1940 and 1970 which is seen in Courtillot’s figure come simply from the number of plots taken for the running average. The rise/dip are strongly pronounced with a small number, and become almost invisible with a big one.
- it seems that there is a 5 - 10 years offset for the temperature values.
- a last important remark : when one plot a running average curve for time series, it is obviously stupid to put the calculated point in the middle of the averaged values : temperature for a given time does not depend at all on future values. For instance, if you plot the temperature of a bullet between it leaves the gun and the moment it reach the target (where temperature grows suddenly), according to this way of plotting, you will see a sudden increase in temperature before the bullet reaches the target…
22 December 2007 at 4:52 PM
Dear Ray,
As I explained to you privately, I will not engage in this electronic debate. Anything that I have to say about the Editorial process concerning this ‘comment’ and ‘reply’ will be done in EPSL (in print and on-line).
I offer this entry (motivated by one sentence in #53) only to state unequivocally that Edouard Bard did not review and was not asked to review the paper by Courtillot et al. that is now at the center of the dispute. If in the heat of the moment I have suggested otherwise, I was wrong and I apologize. I will submit, however, that the editorial process of this and related papers would have benefitted from a better response from the climate community to my (many) requests to help evaluate them.
Best wishes,
Rob van der Hilst
Editor for EPSL
22 December 2007 at 5:47 PM
As Raypierre argues the essence of contrarian arguments at many levels is to play down the physics. This is particularly true of contrarian propaganda in the media. This tends to work because many people are not that knowledgeable about physics. The difference between the Clinton/Carville slogan and that of Raypierre is that many people will be more directly interested in the economy than in physics. In addition people who get all their information from the media rather than from scientific papers have been starved of scientific explanations. In the UK the BBC is now rather sympathetic to climatology but they still tend to rely on the authority of the expert witness or the authority of numbers. This approach tends to disenfranchise people who are by nature anti-authoritarian and skeptical and hostile to the BBC. In my opinion such people have often been poorly served. When UK’s Channel 4 came along with the Great Global Warming Swindle (GGWS) they were watching an attack on a theory which had never been described. They were told that the consensus was based on an ASSUMPTION that man made global warming was entirely caused by CO2. It is not surprising that the programme has influenced people over here. Channel 4’s defence has been that the media had been biased in favour of people who believe in global warming theory and that this was an opinion piece providing balance. The policy of deleting the physics has continued. As far as I know there has never been a programme on UK’s TV to set the record straight in this respect. There is a more comprehensive coverage on the BBC’s web site but many people will never go there.
Every now and then another major piece of misinformation is launched at the media. It is like a volcano. I believe that these eruptions do have some success in influencing public opinion as intended. In the UK we have had the House of Lords report organised by Nigel Lawson, followed by the several pages in the Sunday Telegraph devoted to Christopher Monckton’s unpublished ‘paper’ and ‘review’, and then the Great Global Warming Swindle on Channel 4. As far as the media was concerned Monckton’s paper was almost the first devoted to climate sensitivity (the issue was touched upon in a muddled way in BBC2’s Global Dimming programme) and the GGWS was the first devoted to the detection and attribution problems. The only place where I encountered the hockey stick was in Radio 4’s “Moral Maize” (highly biased against) and the House of Lords report. I hope the experts will try do something to remedy this deficit.
——————————————————————————–
(Incidentally I prepared a line by line critique of the transcript of the ggws with my own opinions and those taken from everyone else: It is at http://tinyurl.com/2pxmnu or http://zcarb.net/wordpress//uploads/ggws.html)
22 December 2007 at 7:09 PM
I just see that the link I’ve given does not work, due to the final dot…
here is the correct site link:
http://www.ncdc.noaa.gov/oa/climate/research/anomalies/anomalies.html
And the file link to download:
ftp://ftp.ncdc.noaa.gov/pub/data/anomalies/monthly.land.90S.90N.df_1901-2000mean.dat thank to moderation to correct my first text.
22 December 2007 at 8:29 PM
Re #65
“The “cannot be found” file “monthly.land_and_ocean.90S.90N.df_1901-2000mean.dat.txt” can be easily downloaded on the following NOAA site : http://www.ncdc.noaa.gov/oa/climate/research/anomalies/anomalies.html.
It is a little surprising to see that Bard and Delaygue were not able to find this kind of file.
For people familiar with temperatures series, this format is the signature of a NOAA ascii files.”
One of the problems in tracking it down of course was that that file wasn’t the data that was actually used in the paper!
23 December 2007 at 4:05 AM
#67, Geoff, I was pleasantly surprised about the French press actually picking up on Raypierre’s corrections, they even added substance and are investigating further. Lets hope that this starts a media habit of redressing rampant disinformation about AGW, I believe there would be a feeding frenzy if only they paid a little closer attention, as there are plenty of modern myths out there. There are so many unchecked propaganda pieces, like a recent letter of 400 contrarian scientists including Allegre, Courtillot et al :
http://www.huffingtonpost.com/joseph-romm/inhofe-recycles-unscienti_b_77945.html
none of them, I am sure, predicted this recent significant warming period, having based their science on incorrect reasoning or even worse, not recognizing that there was any recent significant warming at all. I’ll know when there would be a societal about face when the famous contrarian logic drought is further exposed, like no one has picked up on another large contrarian fantasy: carbon taxes are bad for the economy, all while the price of petroleum nears $100 a barrel (without any carbon tax). I suppose contrarian claims are based on some discerning philosophy, if the price of petrol goes up (without a valid explanation) 4 times more , its not bad for the economy, but lo and behold a carbon tax, and its the end of the free market. The main distinction between contrarians and AGW proper science is pollution, seen as a necessary evil for the benefit of society, vs achieving the same thing without pollution, the moral high ground leads to a cleaner, healthier and happier planet.
23 December 2007 at 4:24 AM
Re: post #53. The suggestion that Bard might have been asked to review was a wild guess from my part. It did not come from Rob vdH. I was wrong: I apologize.
23 December 2007 at 5:18 AM
Re: 66. (53). I am very sorry to have contributed more confusion to the confusion. I never heard anything from Rob vdH about reviews of the paper, or about the paper. My statement was an uneducated guess. It was silly, and doubly wrong. I do apologize. I hope the rest of my comment can still be heard: there is no need or reason for such turmoil.
23 December 2007 at 7:44 AM
#65
I don’t think it matters whether you label a - say - 10year running average covering 1980-1989 1980, 1985, 1989 or whatever as long as you explain that you did so. An average is just a way to reduce some noise and make it easier for our imperfect human minds to see the forest despite of the trees. You always loose much of the data when doing so and no matter what you “call” the average (1980, 1985, 1989) it will never be anything else but the average for 1980-1989 and any other label will be there just for convenience. Despite all that - I thought it has become kind of a standard to label running averages using the middle label.
23 December 2007 at 12:01 PM
I don’t know where Pierre Allemand got “cannot be found” to put it in quotes - raypierre does not seem to have said it. Nor does it matter; it is a red herring. We are talking about Tglobe, and Tglobe was both misattributed and misrepresented, and moreover, when it’s correctly represented, it discredits the conclusions of the paper.
It’s an interesting bit of info, the actual URL where they yanked their data from, just not germane here.
============
1-Representation and Meaning.
(raypierre)
2-Questioned.
(raypierre)
3-Misrepresentation and Misattribution Acknowledged.
(raypierre)
23 December 2007 at 1:22 PM
We can also joke about either old farts resisting change (fair enough) or that younger ones see themselselves as creative because they never read anything more than 5 years old (equally true). Junior and senior scientits having a different perception of science is a good thing after all: energy arises from differences in potential. The science you inherit today was left to you by this less than perfect system. We all fell victim to abusive or incompetent reviewers
23 December 2007 at 4:12 PM
#74, Charles, corrections should be made whenever exaggerations are created. I read the french press as well, I find it in most times just as good or bad as anywhere else. The twist is actual media following up on a lead given by a scientist such as Raypierre. If a lot of that continues contrarians or bad science would have themselves as their audience. It comes down to accepting the point of view of a minority of scientists incapable of predicting future temperature trends, the same scientists who contend that those who have predicted this warming correctly; Hansen, the IPCC group etc, are wrong about the future. This same gang have also claimed that a carbon tax (for renewable energy production and GHG reductions) would wreck the economy. Wrong again they are, close to $100 a barrel without a carbon tax and still the economy survives. The key point is communicating when bad science is propagated, tag the contrarian chaps for their stance or lack of success in climate projections as a prerequisite, a media passing mark, especially in commenting about the future.
23 December 2007 at 6:22 PM
#76 Euh… which comment ? The #74 you’re answering is not mine. And my recent comment concerning Pierre #65, Raypierre #16 and yours #70 is not published yet. Or maybe it was #74, I don’t know.
23 December 2007 at 6:51 PM
#77 Charles, Curious, I did read something . thought it was by you… It is not there anymore..
24 December 2007 at 11:32 AM
[Response: Yes, indeed. That is the best-supported explanation for the interruption in global warming in the 50’s, and indeed in some regions this even shows up as an actual decline in temperatures. There is more uncertainty in aerosol forcing than in GHG radiative forcing, but what I said about “it’s the physics” applies to cooling influences like aerosols as well as warming influences like GHG — if somebody wants to say phlogiston (or magnetic fields) explain mid-century cooling, they can’t just ignore the known influences of aerosols when trying to do an attribution. –raypierre]
Could you, please, given to me some other references about the role of aerosols in the temperature decreasing from 1950 to 1970 ?
Thank you very much
24 December 2007 at 12:25 PM
Flageolet, have you looked for that with Google Scholar?
http://scholar.google.com/scholar?q=aerosols++temperature+decreasing++1950++1970&num=100&lr=&newwindow=1&safe=off&scoring=r&as_ylo=2002
Just one example:
http://www.copernicus.org/EGU/acp/acpd/6/4897/acpd-6-4897.pdf
[PDF] A global emission inventory of carbonaceous aerosol from historic records of fossil fuel and biofuel … -
C Junker, C Liousse - Atmos. Chem. Phys. Discuss, 2006 - copernicus.org
… France show a levelling off or a decrease of BC … A global emission inventory of carbon aerosol for 1860–1997 … a steep increase between the years 1950 and 1970.
On RC, using the Search box (top of page) for “aerosol” will also find several discussions.
24 December 2007 at 5:03 PM
You say:
It is actually very easy to determine what Courtillot plotted. The Courtillot Tglobe plot can be replicated by using the column entitled “Observed temperatures from Jones et al. (1999) Rev Geophys” from the data archive for Briffa, Jones et al 2001 located at NCDC at ftp://ftp.ncdc.noaa.gov/pub/data/paleo/contributions_by_author/briffa1998/briffa2001jgr3.txt,
and by carrying out the following operations: filter using a an 11-year running mean without end-period paddding, then normalizing on 1900-1990. [edit]
[Response: I suggest you read the post in it’s entirety. It will therefore be clear that the ‘We may never know’ comment was written before the location of the real data used was revealed in the update to the Courtillot response (now available at http://dx.doi.org/10.1016/j.epsl.2007.09.031). Well done for reading it though. -gavin]
Even though Briffa, Jones et al 2001 was published in 2001, it only contained temperature data to 1997 - something that should have been picked up by reviewers at the time. Authors in 2007 should obviously not be using this sort of vintage data version, as modern versions are readily available, as others have observed. [edit]
As others have observed, it appears that the data is a 20-90N composite. The description in the Briffa, Jones et al 2001 archive is not as precise as one might like, as it only says that the series is “Observed temperatures from Jones et al. (1999) Rev Geophys”. Jones et al 1999 only illustrated GLB, NH and SH indexes. The archived version for Briffa, Jones et al 2001 differs from vintage versions of these three series, being most similar to the NH version. The most plausible interpretation of the archive is that it is a 20-90N composite calculated in the course of Briffa, Jones et al 2001 (rather than one of the series from Jones et al 1999 itself.)
Given that Jones is a coauthor of Briffa, Jones et al 2001 and the data in Briffa, Jones et al 2001 used data from Jones et al 1999, it is incorrect for Dr Pierrehumbert to say that the Courtillot temperature record is not “from any of Phil Jones’ datasets” regardless of [ad hominem comments and baseless allegations removed]. In my opinion, these allegations in Dr Pierrehumbert’s post should be withdrawn.
[Response: Jones was asked what he knew about the file monthly_land_and_ocean_90S_90N_df_1901-2001mean_dat.txt (which was named as the source in the original response by Courtillot). He very helpfully and accurately stated it was not one of his (a file of that name is available from the NOAA/NCDC analysis but this is not what was plotted in any case). It only subsequently emerged that the data was from Briffa et al 2001. So it ends up that the data were derived from Jones’ data, but how anyone was supposed to know this without being told is a mystery. (PS. posting comments at 5pm on Christmas eve is not conducive to a rapid response). - gavin]
25 December 2007 at 5:15 AM
je crois que vous êtes français , c’est pourquoi je vous ecris dans cette langue.Je vous ai envoyé 2 commentaires ces derniers jours mais ils n’ont pas eu l’heur de vous plaire et en moins d’une heure ils ont disparu. Censurés. Il est vrai qu’ils allaient à l’encontre de l’opinion établie et qu’ils étaient politiquement incorrects.Je trouve que Mrs Allègre et Courtillot que vous massacrez joyeusement ont des théories différentes des vôtres mais elles sont neammoins estimables. Vos querelles me font penser au concile de Nicée en 425 au cours duquel les plus hautes sommités savantes de l’époque s’étaient penchées sur le sexe des anges.Des arguments de grande technicité s’étaient alors échangés.
Vous êtes certainement un chercheur prestigieux mais moi je vous assimile plutôt au savant Cosinus._regardez où vous mettez les pieds.
Vous estimez que 90°/° de la production de co2 est provoquée par les activités humaines mais moi je soutiens que c’est faux.
1) elle est provoquée à 80°/° par le volcanisme terrestre. Des milliers de volcans sur terre et sous les mers emettent des gaz 24h/24.
2)La respiration des ^etres vivants-6 milliards d’êtres humains-beaucoup plus d’animaux-des myriades d’oiseaux,de poissons,d’insectes et même de bactéries qui respirent 24h/24 emettent 15°/° du co2
Certes il y a beaucoup d’automobiles mais 50°/° d’entre elles ne roulent pas tous les jours, et 50°/° roulent moins d’une heure par jour. En tout cas pas une seule ne roule 24h/24.
Un chercheur français-dont je tairai le nom car je ne veux pas vous le voir flingué par vous lui aussi a calculé que si par un coup de baguette magique on stoppait à 100°/° la production de co2 en France la température sur la planète diminuerait de 1 à 2 millionnièmes de degré. Est-il raisonnable de nous casser les pieds pour si peu? et de nous pénaliser si lourdement au point de vue financier?
Moi j’affirme(j’ai peut-être tort mais ça me paraît tout à fait rationnel)que le global warming est dû à l’activité solaire. Comme sur la terre les calottes polaires martiennes son en régression permanente. Qu’ont en commun ces deux planètes? Elles ont le même soleil.
Je suis pour le globalwarming. Il faudrait encore un effort. Il y a certes des inconvénients mais beaucoup moins que si la température baissait ce qui ne manquera pas de se produire et peut-être plus tôt que vous ne le pensez. Et c’est là qu’on ira à la catastrophe.
[edit]
25 December 2007 at 10:50 AM
Jean Segalen, Vraiment, je pense peut etre vous avez mal compris. Les activete’s humaine sont responsible pour presque tout de la augmentation de CO2. Les volcanes ne sont pas un contribuant tres grande, et nous connaissons que au cause de le rapport isotopique que le source de la plupart de CO2 et une source fossil.
Les changement solaire ne peut pas explique le chaufement de la terre–meme les regiones palaires martiennes. Le climate martienne et domine’ par le tempete de la poussiere.
Il faut apprendre un peu de la science.
25 December 2007 at 1:38 PM
Monsieur Segalen, Ray a re-explique cette fois ci, en francais, ce qui est chose certaine, vos conclusions sont bases sur des references scientifiques? Priere les decrires. Le conceil de Nice n’est pas la meme chose que le IPCC, tu as la liberte de t’exprime, mais faut tout de meme s’appuye
sur des fondations scientifiques solides, et non pas seulement a une croyance basee sur des idees simplistes.
25 December 2007 at 5:49 PM
Monsieur Segalen, vos commentaires revelent un ignorance assez grave de l’etat actuel de la science du climat. Il n’y a pas penurie de references serieuses pour mettre vos convictions a l’epreuve. La masse de dioxide de carbone provenant des activites humaines est a peu pres 150 fois celle de l’activite volcanique. De nombreuses etudes sur l’activite solaire et les reconstructions de l’activite solaire passee demontrent sans l’ombre d’un doute que les variations recentes ne peuvent expliquer le rechauffement observe depuis 1975. Les lois physiques qui gouvernent le comportement thermodynamique du dioxide de carbone constituent une realite incontournable. Si vous voulez vraiment comprendre ce qui se passe, je vous recommende les sources vraiment serieuses.
Par ailleurs, il est tout a fait abusif de traiter Mr. Ladbury de “savant cosinus,” alors qu’il a derriere lui une carriere tres productive au sein d’institutions prestigieuses et bon nombre de publications traitant de sujets qui, a l’evidence, vous echappent.
Pour l’attribution du dioxide de carbone:
http://cdiac.ornl.gov/trends/co2/contents.htm
Pour l’activite solaire:
http://www.astro.phys.ethz.ch/papers/fligge/GL264W01.pdf
Ces deux liens sont des exemples. La recherche qui supporte l’hypothese du dioxide de carbone est plus que considerable et il n’existe, a ce jour, pas d’alternative satisfaisante.
25 December 2007 at 7:39 PM
Re # 81 For the benefit of non-French speaking (or reading) visitors, I offer here a translation of jean Ségalen’s post (courtesy of Babel Fish Translation, http://babelfish.altavista.com/tr):
I believe that you are French, this is why I you ecris in this langue.Je sent 2 comments to you these last days but did not have the hor you to like them and in less than one hour they disappeared. Censured. It is true that they went against the established opinion and that they were politically incorrects.Je finds that Mrs Allègre and Courtillot that you massacre joyeusement have theories different from yours but they are neammoins estimable. Your quarrels make me think of the council of Nicée into 425 during which the highest erudite celebrities of the time were leaning on the sex of the anges.Des arguments of great technicality had then been exchanged. You are certainly a prestigious researcher but me I rather assimilate you to the Cosinus._regardez scientist where you put the feet. You estimate that 90°/° production of CO2 is caused by the human activities but me I support that they is false. 1) it is caused with 80°/° by terrestrial volcanicity. Thousands of volcanos on ground and under the seas emettent gases 24h/24. 2)La breathing of the ^etres alive-6 billion human-much beings more animal-of the myriads of birds, fish, insects and even of bacteria which breathe 24h/24 emettent 15°/° CO2 Certes there are many cars but 50°/° of them does not roll tous.les.jours, and 50°/° roll less than one hour per day. In any case not only one does not roll 24h/24. A researcher French-to which I will conceal the name because I do not want to as see it to you flingué by you calculated to him as if by the waving of a magic wand one stopped with 100°/° the production of CO2 in France the temperature on planet would decrease by 1 to 2 millionnièmes by degree. Is it reasonable to break us the feet for if little? and to so heavily penalize us from the financial point of view? Me I affirme(j’ am perhaps wrong but that appears completely rationnel)que total the warming to me is due to the solar activity. As on the ground Martian polar caps sound in permanent regression. What has these two planets in common? They have the same sun. I am for the globalwarming. An effort would be still needed. There are certainly disadvantages but much less than if the temperature dropped what will not fail to occur and perhaps earlier than you think it. And it is there that one will go to the catastrophe.
25 December 2007 at 9:11 PM
Chuck, that is truly funny!!!!
26 December 2007 at 1:00 AM
Re # 86 Philippe Chantreau
Funny, but I think it was easier to understand in the original French, and I don’t read or speak French.
26 December 2007 at 9:07 AM
Chuck, Babelfish did a reasonable job of translation–though it seems to have trouble with pronouns, interestingly enough. It is reassuring to know that other countries have their loons, too.
26 December 2007 at 10:10 AM
Re #81 I notice that Jean Ségalen even managed to get the date of the (first) Council of Nicaea wrong: it was 325. Among its decisions on dogma was that angels are non-physical beings, hence unsexed. Sneers at what appear, taken out of their cultural context, to be absurd beliefs or disputes, are tokens of ignorance rather than sophistication.
26 December 2007 at 11:13 AM
Google Translator
http://www.google.com/translate_t
does a rather better job of rendering.
26 December 2007 at 11:22 AM
#19: Conservation will be an important part of the answer for the United States but it does very little for the under-developed and developing world. At the end of this Century there will be nine billion people. Supporting them with a Western-style standard of living, even assuming a European level of energy efficiency, will require roughly 4x the current energy supply. Economic democracy and environmental responsibility together require both conservation and every non-fossil energy source we can bring to bear: Solar (ultimately space-based), nuclear (first uranium-fuelled breeders and later thorium), wind, geothermal, et cetera.
#85: Yes, Mars and Earth share the same Sun, but they do not share the same orbital dynamics. Milankovic forcing would be about to send Earth into another ice age, but this is being overwhelmed by CO2 forcing. Mars’ Milankovic cycle in contrast is now warming Mars unopposed by any artificial forcings.
26 December 2007 at 11:34 AM
“Wrong again they are, close to $100 a barrel without a carbon tax and still the economy survives.”
Its not the price of oil that would really ever harm the economy, its the addition of more fingers in the pie that does, especially if they fail to put back into the economy in timely and distributed manner
26 December 2007 at 12:48 PM
Ray P wrote:
“In the revised “Response” Courtillot now admits that the temperature record called “Tglobe” is not from any of Phil Jones’ datasets at all. Courtillot now claims that the data came from a study by Briffa et al. (2001), giving the address of a file stored at NCDC”
And HERE is the header to that file:
Data file to accompany Plate 3 of Briffa et al. (2001)
The following reconstructions have been taken from the source
“references listed below, and then RECALIBRATED to obtain estimates”
of April-September mean temperatures from all land regions north
of 20N. All series are temperature anomalies in degrees C with
respect to the 1961-1990 mean. Note that in Plate 3 of Briffa
“et al. (2001) all the series had been smoothed, while the data”
listed below are unsmoothed (though column 5 never had any
sub-5-year variability even when unsmoothed).
Full references and details of the recalibration are given in
“Briffa et al. (2001) J Geophys Res 106, 2929-2941.”
Columns are:
1: Jones et al. (1998) Holocene
2: Mann et al. (1999) Geophys Res Lett
3: Briffa et al. (2001) J Geophys Res
4: Briffa (2000) Quat Sci Rev
5: Overpeck et al. (1997) Science
6: Crowley & Lowery (2000) Ambio
7: Observed temperatures from Jones et al. (1999) Rev Geophys
And Phil Jones is a co-author on this Briffa paper, correct gavin?
Low-frequency Temperature Variations from a Northern Tree Ring Density Network
Journal of Geophysical Research,
106 D3 (16-Feb-2001) pp. 2929-2941
K. R. Briffa*, T. J. Osborn, F.H. Schweingruber, I.C. Harris, P. D. Jones, S.G. Shiyatov, and E.A. Vaganov.
26 December 2007 at 1:02 PM
Une bonne compréhension des justifications du réchauffement climatique nécessite des compétences dont je ne dispose pas.
Je remarque néanmoins que le démontage des idées des uns et des autres passe souvent par la critique des modalités de fabrication des courbes. Oskar Morgenstern expliquait déjà cela trés bien dans les années 30. Il est vrai qu’il s’agissait d’économie, mais peut être assiste-t-on à une convergence des techniques d’argumentation des sciences molles et des sciences dures.
J’aurai à ce sujet une question qui porte sur un argument souvent employé par les opposants à l’idée du rôle majeur du CO2 dans le réchauffement climatique.
Il s’agit de l’écart inverse qui existerait entre la hausse du CO2 et l’élévation des températures.
Certains critiques radicaux de la présentation d’ Al Gore expliquent en effet que la lecture fine des courbes présentées montre que le réchauffement précède l’augmentation du CO2 et non l’inverse.
Je suppose que cette question a été tranchée. Merci de me donner les éléments de compréhension en votre possession.
[Response: La correlation entre CO2 et température n’est pas ‘inverse’ du tout. Par apport la précédence d’un ou l’autre, il faut penser qu’il y a deux effets qui sont couplé - l’effet de climat sur la cycle carbonique et l’effet de serre. Si le climat change a cause d’un autre processus, le CO2 va suivre et ajouter (comme on trouve dans les cycles glacial/inter-glacial), et aussi, si le CO2 change a cause d’un autre chose (les activités humaines), la climat va suivre aussi. Voir ici pour un peu plus d’information. - gavin]
26 December 2007 at 2:14 PM
Max # 93, “If they fail to put back into the economy in timely and distributed manner” , Re-investing in green energy technology has its own feedback process, which would ultimately require less oil,
such as the “normal” market goes, a lesser demand would decrease the price of this commodity. With price of oil so high, without purpose all while not having economists frantically panicking about its damaging effects, leads me to conclude that the idea of a carbon tax dedicated for green energy investment is more than doable, even good for a “normal” economy, with a little more concern about the price of energy.
26 December 2007 at 3:08 PM
Drifting of topic but when is the last time a government actually spent tax dollars on the purpose it was collected for. That is a pipedream to think there is a hardline dedication to causes in which money is collected for. For an example have a look at the tax which the Canadian Government collects for national road infrastructure, and how much it actually spends. The problem with governments is that they will collect the money for a cause and spend it on something else.
26 December 2007 at 4:43 PM
#81. Gavin, you said:
Well, after the updated response was available, Dr Pierrehumbert stated:
Given that Jones was a coauthor of Briffa et al 2001 and that study cited Jones et al 1999, Dr Pierrehumbert is incorrect to assert that Courtillot “admits” that the temperature record in question is “not from any of Phil Jones’ datasets at all”. It obviously is from one of Phil Jones’ datasets. Why not simply acknowledge this and move on?
You also say
In this case, Courtillot did cite Jones et al 1999 in their original article and that was one way that a reader might have known that Jones’ data was used. I agree that the absence of an accurate URL made it pointlessly difficult to decode precisely what Jones version was used, especially given the use of an obsolete version. I strongly endorse the principle of authors providing detailed data citations (with URLs) although Courtillot et al are hardly unique offenders in this respect.
[Response: Is this the sound of a dead horse being beaten? It’s clear that the data was derived from Jones’ dataset. Yet you accuse me of not acknowledging that, one line prior to quoting my acknowledgment. Huh? There is a distinction between “derived from” and “one of” but frankly, I’m not interested in this kind of semantic micro-parsing. The issue is not the lack of URL but the mis-statement of what the record was (twice!). Let’s “move on” shall we? (PS. If RayP has anything to add it will come after the New Year). - gavin]
26 December 2007 at 4:49 PM
richard schumacher (92) states Milankovic forcing would be about to send Earth into another ice age, but this is being overwhelmed by CO2 forcing.
Well, it turns out that the Holocene is one of the long interglacials. The soonest another stade (massive ice sheets) could arise, baring AGW, is in 20,000 years. But that forcing is so weak that it is the next chance, 50,000 years from now, that the next stade will certainly arise (baring massive AGW).
26 December 2007 at 5:21 PM
I’m sorry, I guess I should have pressed the “1″ to get the replies in English…
26 December 2007 at 8:28 PM
Gavin: Steve M. said “I strongly endorse the principle of authors providing detailed data citations (with URLs) although Courtillot et al are hardly unique offenders in this respect.” With respect to your concerns cited in this blog you must agree with Steve M on this point…right? Just throw your considerable weight behind the release of detailed citations from all scientists, modelers,… Makes sense.
[Response: I’m in favor of motherhood and apple pie too. - gavin]
27 December 2007 at 12:03 AM
Not even Panco Poultry can eviserate a chicken with more dispatch than Raypierre has shown in his truly nifty reduction with this episode of the Annals of Denial. And, to switch the analogy, he even has time to take Stevie Wonder into the boards, with time to spare to come back and give him another shot, just like that guy who used to play for Boston whose theory of Hockey was “always finish a check.”
It is truly wonderful to see how Real Climate has matured as seen in the comments. We now see a whole audience familiar with the science as generally informed lay persons, and also familiar with the realities of politics in the varied fields of academic writing, science controversy, and plain polemics (ie, there is now very little seen of the last mentioned). And this is on top of a wide readership of people in science who really do know what the topics are all about. And no longer is it a tiny band of climate scientists, there now seems to be a whole regiment of them ready to step in and whale away at the deniers and their like. The writing is apt, the mix of politics and science comes across as comfortable, and the conclusions are beginning to show steel edges.
It was a real pleasure to see how swiftly and neatly this oeuvre mal, it is their word after all, was trussed up and ready for the oven. I visualize the carver going home with a toothpick in anticipation of Christmas dinner. Three cheers for a really great year at Real Climate and may there be many more.
27 December 2007 at 3:17 AM
#97 Max, since its off topic I’ll keep my powder dry for when the appropriate subject comes up, its do or don’t, $100 a barrel and how much for renewable now?
I find the arguments given in #82 from a french man, coming from a completely different culture not entirely familiar with North America, very revealing, they are extremely similar if not identical
to the same lame extremely tired contrarian points we’ve been bombarded with in the Americas. This suggests a thread
of ignorance crossing cultural borders, coming definitely from identical sources. A deliberate world wide effort to stall GHG abatements until someone learns to crack Hydrogen from a crude oil molecule.
27 December 2007 at 1:15 PM
Re #103: [A deliberate world wide effort to stall GHG abatements until someone learns to crack Hydrogen from a crude oil molecule.]
Err… Don’t we know how to do that now? And what would be the point? You’d still have the carbon sitting around, either emitted as CO2 during the cracking reaction, or as solid carbon - which I’m sure someone would ship off to the nearest coal-fired power plant
27 December 2007 at 2:42 PM
Re #104
“Re #103: [A deliberate world wide effort to stall GHG abatements until someone learns to crack Hydrogen from a crude oil molecule.]
Err… Don’t we know how to do that now? And what would be the point? You’d still have the carbon sitting around, either emitted as CO2 during the cracking reaction, or as solid carbon - which I’m sure someone would ship off to the nearest coal-fired power plant”
Yes we do, and the point would be to run the gasifier to produce H2 with which to generate power and remove the CO2 prior to combustion and sequester it in a hole in the ground (check out BP’s website, e.g. DF-I Peterhead or Google Rob Socolow and sequestration)
27 December 2007 at 3:08 PM
I’m not a scientist, however, on the issue of academic manipulations of facts, I did raise this concern back in the 80’s during my college days.
When the purpose of an ‘argument’ is to magnify what supports the argument and suppress what is contrary, it makes for a tight persuasive paper at the expense of the truth. How unfortunate for all of civilization, when garbage is recorded in a reference library to later be used by another bad theory trying to prove itself. Could there be a more effective way to keep all of civilization spinning it’s wheels, at best going nowhere in a hurry, at worst sliding back to medieval times? What have we won when we win by these methods? A moment of limelight, or a weekly paycheck for a while, at the expense of your childs future.
While I understand that this post travels well beyond the boundaries of my native USA, I feel compelled to offer some constructive criticism of our American system. Ultimately it should prove a cautionary tale to all regardless of borders.
I’m old enough to recall the time in history when professions had a sacred honor in service to the greater good. Doctors were committed to the Hippocratic oath, Judges and Lawyers were committed to the spirit of the law, Editors in the media were committed to fact finding in current affairs, and Professors in academia were committed to the expansion of knowledge and reason.
Please see the force that has eroded social ethics. Doctors are not obliged to pledge harm none, but are having their studies extended to include business management to prevent themselves from being crushed by two opposing forces wanting the lions share of medical market share: the pharmaceutical industry and the insurance industry.
Lawyers are rewarded monetarily and with media prestige to exonerate the guilty, and Judges are rewarded by exonerating special interest groups for political futures. Editors, like professors in academia, answer to their corporate sponsors, and may not speak contrary to the party line under the duress of loss of tenure/employment. False science, such as what was generated in service to the tobacco industry, and todays argument regarding global warming (what industry ‘fuels’ that false science?), is a direct example of how this trend affects the scientific community.
The common thread bringing harm to social ethics of professions is capitalism, which unchecked, is a sociopathic exploitation of resources for the benefit of a few, at the expense of the truth, and ultimately of the many. Faceless, ruthless, & unaccountable, it will continue to dominate cultures globally until we stop feeding it our power and/or money.
History being interested in honesty, isn’t it long past time to create international laws to limit what should be a mere economic tool from the short sighted harming of the greater good on our long term planet?
27 December 2007 at 4:08 PM
RE#102 amongst many others- My question to you is this:
What is repartee in service to, relative to scientific exploration, scientific method, parsing true from false, or anticipating the ramifications of our current energy policy direction?
When science cannot stand on the merits of proven fact, relying more upon the same zero sum game of win or lose a limelight, we all lose.
Blog moments like these, I imagine the cut up comments made by the experts of the time when Galileo was arguing that the world was round. Anyone remember those experts names? LOL
27 December 2007 at 5:07 PM
Re #107
“Blog moments like these, I imagine the cut up comments made by the experts of the time when Galileo was arguing that the world was round. Anyone remember those experts names?”
To the best of my knowledge Galileo never made such an argument, but one of the experts he argued with was Kepler since he thought Kepler’s theory that the tides were caused by the moon was a “useless fiction”. LOL
I assume you’re referring to his advocacy of heliocentrism in opposition to church dogma, he was actually allowed to publish as long as he kept in on a theoretical level. The real problem arose when he put the words of the Pope in the mouth of the character Simplicius! A analogy would be Hansen calling the president a fool, of course we live in more enlightened times.
27 December 2007 at 5:28 PM
Kelley Sullivan: “The common thread bringing harm to social ethics of professions is capitalism, which unchecked, is a sociopathic exploitation of resources for the benefit of a few, at the expense of the truth, and ultimately of the many.”
Yes, the truth fared so well under Soviet Communism. Are you old enough to remember Lysenko? How about the fact that Soviet chemists were not allowed to study Rare Earth Chemistry because it was of no use in the workers’ paradise.
Kelley, the problem is not capitalism or communism, or religion. The problem is people. And those institutions which most advance civilization are those which have found a way for the self-interests and prejudices of individuals to struggle and cancel each other out (at least mostly). Science is one such institution. Representative democracy another. The competition of free and fair markets a third. Trial by jury, possibly a fourth. In order for all of us to win, we must agree to rules that none of us can win it all.
[Response: This is OT - I’ll delete any further exploration of economic systems on this thread. - gavin]
27 December 2007 at 6:14 PM
Isn’t the bigger issue here that such scientific papers accurately disclose their data sources?
Gavin, you say “I’m in favor of motherhood and apple pie too.” Isn’t that a bit flip when discussing the real meat of this issue, the transparency of data in published climate research? You seem to be for this, why not throw your support behind the general principle of accuracy and full disclosure in climate science? We know there are other cases where data is not properly referenced and in some cases not archived at all.
[Response: The issue here is the manipulation of data to make a case that is not supported by the data at all. As for the rest of our point, how could anyone be against accuracy? and the more openness the better. But there are plenty of issues in data archiving that remain problematic - how to deal with age model changes or updates, what’s an appropriate level of detail, how to encourage publication of data directly and have people be properly credited, how to rescue old data from floppy disks etc. I might do a general post on the subject at some point, but none of this has anything to do with the case here. To make the point that data management is much more important that simple archiving, look at the PCMDI CMIP3 archive. The same data from GISS is there as is on our website, but so is data from another 20+ groups in the same format and for the same experiments. It’s much more useful than 20 separate and incompatible websites would be, and took enormous effort to put together (I might do a post on that as well). The equivalent effort has not been made for most kinds of climate data, and. yes, it needs to be. - gavin]
27 December 2007 at 6:44 PM
1st post from a total novice and non-scientist to AGW. I am persuaded by RealClimate, Stewart Weart, IPCC, and a variety of other sources that AGW is real and potentially problematic, with real effects currently manifest. Nevertheless, I am glad for sites like Climate Audit and some others that raise (what appears to me) legitimate questions and criticisms forcing attention and response from RC, etc,; including to possible missteps by RC and others.
Question: 500K years from now, when looking at a 1M year timeline of Temperatures as a continuation of current ice core graphs, and assuming a medium to worst case AGW scenario, will the graph show a blip or a spike that is obviously and totally anomalous or otherwise out of the ordinary compared to the type of ’saw toothing’ the current ice core graphs or other proxie graphs show? At that time, of course, one will be able to label the spike and sequelae “Fossil Fuel AGW”, but will that spike and following graph line be readily apparent as a gross catastrophic anomaly? Or could it just as well be viewed as a more or less chaotic climate shift not terribly unlike the innumerable other ones in the preceding 1 million years on the graph?
27 December 2007 at 8:09 PM
Shelama (111) — That depends on how much carbon is added to the active carbon cycle. A good paper is A movable trigger: Fossil fuel CO2 and the onset of the next glaciation by Archer & Ganopolski.
27 December 2007 at 8:36 PM
Richard, you’ve drifted off again from the words, you’ve taken a specific description of a specific graph, this one:
http://www.realclimate.org/BD3.jpg
The description _of_that_chart_ uses the words you’re stuck on.
Look at the chart. What do you see there?
Solar goes up and down. Temperature goes up.
You wanted a more general explanation of … something about how the ocean lag time works.
You said you’ve read about that somewhere.
What did you read? Where did you read it?
You said you don’t want to do the equations, you want to do words. This isn’t working for you.
_Can_ you follow the equations? If not please say so.
27 December 2007 at 9:15 PM
JimR, One is reminded of the jibe by Andrew Lang:
“He uses statistics as a drunken man uses lampposts - for support rather than illumination.”
The preponderance of the evidence has pushed scientists to accept anthropogenic greenhouse gasses as the cause of the current warming epoch–nobody started out with that hypothesis and then looked for “evidence” for it. The denialists seem to be willing to torture any dataset until it tells them what they want.
27 December 2007 at 10:14 PM
#113
1. I did not say I read it, I said I *heard* it. The source is not known to me. Perhaps the source is not even reputable. For the purposes of argument, the source doesn’t matter.
2. I did not say I “don’t want to do the equations”. I suggested it would be best to avoid them if possible. If not, go for it. (You and/or Ray were the ones who suggested it would be a challenge in a text blog, not me. Gavin didn’t seem to have any difficulty with it.) My only concern about an overly simplistic proof involving differential equations is that it might not capture the relevant aspects of ocean dynamics.
3. I’ve seen the graph - just as I’ve read Wunsch and Pierrehumbert. These are the source of my question. What do you hope to prove by pointing to something I’ve already seen?
4. You can berate me all you want. You can cheer on other readers who find raypierre’s argument intuitive and encourage them to mob me. That is not a proof. That is not how science works. I would encourage you to forget the messenger. Argue the argument.
5. Again, for the 3rd time, I suggest we drop this for now and pick it back up when raypierre is back.
6. I will not reply to the numerous red herrings raised in the other thread. I think it would be counterproductive.
28 December 2007 at 6:14 AM
#110 Gavin - I appreciate the comments on the need to properly archive data. While much of this article was about other things an important factor was the confusion over the source of data used by Courtillot. There seem to be many cases similar to this where it is difficult to find the actual source data and in some cases it is not made available at all. My comment about accuracy was regarding accurately referencing available data upon which a paper is based, a problem in this situation as well as in other areas in climate science.
I look forward to reading your post on properly archiving of data. As a layman it baffles me that in many cases data paid for with tax dollars is not made publicly available, at times in spite of NSF rules regarding such archiving. [edit] It would be a shame for all their data to be lost.
28 December 2007 at 1:54 PM
JimR, the issue being raised in this article isn’t that the data wasn’t available it is that the data used in the paper was noticeably different then sources it cited. Had the paper properly cited the source of data to begin with no search for the real source would have been required. The greater issue, of course, remains that when the correct data was used and handled/presented properly the results directly weakened or contradicted the conclusions of the paper.
29 December 2007 at 3:10 AM
Richard:
The best response to you is that you appear not to have done enough searching of this very site to avoid raising points that are settled, and that have been explained patiently so many times everyone but you is completely sick of rehashing it all.
Grist, coby beck, realclimate, tamino, eli rabbett, deltoid, many others have well organized lists of reasons the objections raised by Climate Audit are wrong across the board (with mostly trivial exceptions).
The rest of your posts seem to be the very abuse you are projecting on others.
No one is mobbing you, you are raising the red herrings, not us. Nor do you, in fact, understand how science works - or if you do, you’re choosing not to demonstrate that fact.
29 December 2007 at 12:16 PM
Marion, 113 was my mistaken posting — in this _wrong_thread_ — meant to be a reply to Richard in the other thread. As a kindness, please don’t extend the digression here. My bad.
In AGU news, from the top of the atmosphere:
GEOPHYSICAL RESEARCH LETTERS, VOL. 34, L24707, doi:10.1029/2007GL031409, 2007
A strict test in climate modeling with spectrally resolved radiances: GCM simulation versus AIRS observations
http://www.agu.org/pubs/crossref/2007/2007GL031409.shtml
“We compare the clear- and total- sky spectra simulated from the Geophysical Fluid Dynamics Laboratory GCM using a high resolution radiation code with the AIRS observations. …”
There are some interesting bits in the abstract that suggest someone with access to the full article might find it worth reading and talking to us about. Hint hint (grin) …
29 December 2007 at 2:48 PM
“Say it three times every night before going to sleep: Temperature goes up. Solar stuff goes up and down and up and down and up and down. You can no more make a trend out of that than you can make a silk purse out of a sow’s ear.”
I guess I’m one of the stupid ones that doesn’t get the physics here. In the past we have had many trends, and like today, the “solar stuff” was going up and down. But we didn’t have man made CO2 and the CO2 increases that did happen followed temperature by centuries. So if the volcanoes had cycles, the solar irradiance had cycles, etc. How did we get trends in the past that exceeded the cyclic period of what we are calling natural components of climate variability. Do you consider a hundred year trend to be an anomally in the temperature record? Regarding solar cycles going up and down, can we account for the effects of a number of very active cycles, shortly spaced together, as opposed to a number of very inacative cycles, widely spaced apart, by simply saying they go up and down. Can cycles not have a cumulative effect?
29 December 2007 at 3:31 PM
Tilo, look at the chart, that’s what the words are describing. They are not describing the entire long timeline of climate on the planet, they’re describing the directly measured period we know best. The past hundred years are an anomaly because we are here, active, and able to measure our own effect.
29 December 2007 at 3:47 PM
Tilo, First, think about the mechanisms by which CO2 would be released in a natural warming event–warming begins, say via increases insolation due to Milankovitch cycles, melting permafrost and warming the oceans. CO2 begins to be emitted from peat bogs and from the warmer oceans (remember CO2 solubility decreases with temperature). The released CO2 acts as a feedback, intensifying and prolonging the warming event past the end of the orbital confluence that started it. There are at least a few events where the onset seems to have been due to increased CO2, but these were in atmospheres very different from our own.
As to cyclic input giving rise to monotonically increasing output. Think about a harmonic oscillator. In general it will tend to follow the input driver. It oscillates at its resonant frequency, and if an input drives it at this frequency, you will see oscillations of increasing magnitude. However, system response is still oscillatory. This is very different from what we are seeing in the climate. First, the drivers (insolation, etc.) are not really periodic. Second, the global temperature is increasing at a pretty steady rate–there’s no way you can get this from a quasi-periodic forcing function. it would violate conservation of energy.
29 December 2007 at 6:08 PM
Ray, I probably failed to explain my point about cyclical output very well. Let’s consider a sine wave representing power. Let’s say the sine wave moves between 0 and 1 Watt. We would then expect the average power to be related to the area under the curve. So if our sine wave moved from 0 to 2 Watts, the average power would increase proportionately. So I’m assuming that, say, 5 solar cycles with a high TSI, when averaged over a number of such cycles, would send more energy to the earth than 5 solar cycles with a low TSI. So if we can assume that the oceans act as heat buffers, then couldn’t it take longer than a single solar cycle to see the effects of a number of high activity cycles on temperature? It seems like this effect could be amplified by modifying the sine wave such that the bottoms were longer than the tops during the low activity cycles. This would send even less power to the earth during the weak cycles. We seem to be in a period right now where the normal cycle time of 10.7 years for a cycle has been extended to at least 11.7 years - and it may go longer. The quite time we are spending between cycle 23 and 24 seems to be extended.
29 December 2007 at 10:26 PM
You say on your website “But even if we had enough values of the cycle lengths for a reliable statistical analysis, there is another difficulty that is inherent with the lengths: they are measured from a cycle minimum to the next minimum, but the definition of a cycle minimum is not based on any theory. …
…
the next Jovian perihelion is in late March in 2011. I predict that the length of the cycle 23 is in the range of 12.2-13 years. This means a minimum earliest in October 2008 and latest in July 2009 (I use the minimum of 1996.6). This means that the cycle 24 is very low, in the range of 40-70, or a Dalton level. This means that the maximum will be reached only in 2014….”
The predictions are welcome because they’re for the near term; which of the several definitions of ‘minimum’ are you using? In other words, what observation would prove your prediction wrong?
here: http://personal.inet.fi/tiede/tilmari/sunspots.html#alert
29 December 2007 at 10:36 PM
Tilo, first, wrt solar cycle–it’s not really periodic. Typically you have 7 years of Solar Max, followed by ~4 years of Solar Min, but Solar max can vary from ~6 to ~9 years, and Solar Min from ~3 to 6 years. Solar cycles lasting up to 14 years have been seen–that’s all “normal” variation.
Second, it you are thinking that somehow the oceans have been storing solar energy from the 1940s, the question is where has it been? Moreover, how can the Oceans be heating the atmosphere when they are also warming? Moreover, when it comes to solar variability, we’re talking more like 1.01 vs 1, not 2:1. If you have a reservoir, all it will do is introduce a phase shift and possibly damping of the output vs the input. It won’t give you a steady rise, like we are seeing now. Moreover, the energy can’t just disappear and reappear 50 years later. It has to be stored somewhere.
Anthropogenic greenhouse gasses explain what we are seeing both qualitatively and quantitatively. There’s no need to posit some exotic mechanism that we understand only dimly or not at all. Science explains the unknown in terms of the known.
5 January 2008 at 11:47 AM
I am neither a scientist nor an academic but I am interested in this topic and will be impacted by the effects of climate change.
In my reading and viewing I seem to remember reference to a measurement that calculated the percentage of CO2 in the atmosphere. I believe that the IPCC assumptions are based on 1% but these other numbers indicated that in 10 year increments over the past 30 years the percentage was something like .43%, .46% and .42%.
The points were:
1. Even though industrialization has increased dramatically in past 30 year, why has CO2 volume not increased if human activity is the cause of the problem?
2. If the levels have in fact hovered at about the same levels for 30 years, how does that impact IPCC estimates that assume a more than double 1% level.
If anyone has any information on this, I would appreciate it.
A plain English response is preferred.
No I have not read all 125 posts.
Thank you.
5 January 2008 at 12:42 PM
Kelly, try the ’start here’ button at the top of the page.
If you can remember where you got what you believe, please post a reference or link so we can see what it said.
Once you have a few of the basic terms it’s easier to look these things up. The level of CO2 measured is called the “Keeling Curve” after the man who began making the measurements. Here are some pictures of it, try any of the links:
http://images.google.com/images?q=keeling+curve
The numbers you think you remember seeing look precise, but it’s not clear what they might have meant, even if you remember them exactly.
5 January 2008 at 2:08 PM
Kelly, I’m not sure where you are got your info from, but it is incorrect. CO2 has risen from about 280 parts per million by volume (ppmv) to >380 ppmv in the industrial era. It continues to rise rapidly–as indicated by the Keeling curve Hank refers to. And indeed we know the CO2 has come from human activities, since the proportion of the isotope carbon-13 (C-13) continues to diminish–a sign that the carbon going into the atmosphere is from a fossil source.
What you may be remembering is that not all of the carbon we have released has gone into the atmosphere. About 50% of it has gone into the oceans, but their ability to absorb more is not unlimited, and may already be decreasing.
6 January 2008 at 11:57 PM
Hello all,
I’m back from a very refreshing holiday break. I have enjoyed reading everything people have posted while I was away, and have especially appreciated the fine responses posted to issues that have been raised. I have very little to add to Gavin’s comments and the comments and responses made by the RC readership, but I have read everything. Thanks to you all for contributing to such a high quality discussion. I will continue reading this, so if there are any points that anybody would like to see addressed at greater length, please do post your query.
At a few points there have been comments on the interest in this story on the part of the French press. In fact, it was also picked up by Figaro, though the story mysteriously didn’t appear in the online version. I want to underscore how impressed I am at the attention the French press has given to such a science-heavy story, and contrast it with a somewhat analogous case where the US press completely dropped the ball. I refer to the issue of the severe criticism leveled by Von Storch et al against the MBH Hockey stick paper, which actually had much bigger consequences for MBH than the Courtillot et al paper had for anybody. The Von Storch et al criticism contributed to what could well be described as an inquisition against MBH, involving even Congressional hearings. A Comment was published showing that the Von Storch criticism was based on a number of errors, some of which seem to have been actively concealed. The comment was peer reviewed and published, just as Bard and Delaygue’s was, and then RealClimate blogged on it to make the issues known to a wider readership. Unlike the case with the French press in the present instance, the response in the US press to the exposure of Von Storch’s errors was deafening silence –even though the papers in question had given prominent space to the inquisition against MBH.
The US press has published some outstanding investigative reporting on climate change issues, but I think that on the whole the French press comes out of this incident looking very good, and the reporters who covered this story at considerable risk to themselves have shown themselves very courageous.
7 January 2008 at 1:17 AM
Thanks for the responses.
Let me see if I understand this. IPCC scenarios are based on a 1% ppmv assumption. Does that mean a CO2 level of 10,000ppmv?
[Response: No. You are perhaps confusing a single kind of scenario run (the 1% per year increasing CO2 amount), with the actual amount (which is currently 380 ppmv, and increases to 560 ppmv by ~2080 in that scenario). In the current IPCC report, the scenarios are based on more ’storylines’ that are not as simple of the 1% increase per year ones from a few years back. - gavin]
7 January 2008 at 1:47 PM
What I meant was that the IPCC predicts some terrible climatic changes in the future based on the assumption that CO2 will reach the level of 1% of earth’s atmospheric gasses. Does that mean that CO2 would have to be 10,000ppmv (10,000 is 1% of 1,000,000) for it to equate to IPCC’s 1% ?
[Response: You are more confused than ever. IPCC CO2 scenarios don’t do any such thing. Mostly they ’stabilise’ at 550 or 750 ppmv. No one is talking about CO2 being 1% of the earth’s atmosphere. - gavin]
7 January 2008 at 4:26 PM
Kelly, what source are you relying on for what you believe?
7 January 2008 at 4:32 PM
Kelly,
I dimly recall seeing something like your .43%, .46%, .42% series, though unfortunately I can’t remember the source at the moment, either. However, I’m pretty sure that those numbers referred to the observed percent increase in atmospheric CO2 per year. They definitely do not refer to the percent of the atmosphere consisting of CO2. If I recall correctly, the discussion at the time centered around why the yearly increase did not seem to be accelerating, despite the fact that emissions had been accelerating over the same time period. But 1) atmospheric CO2 has consistently been increasing, contrary to what you seem to have taken from what you read, and 2) none of the numbers you have mentioned are close to the observed or projected amount of CO2 in the atmosphere–380ppmv currently, for instance, and projections in the range Gavin mentioned above. Often the sensitivity of the climate to changes in greenhouse gasses is talked about in terms of how much temperature would increase as a result of doubling atmospheric CO2, but a doubling from current levels is still only 760ppmv, a far cry from the 4,200-10,000 ppmv you’re talking about.
13 January 2008 at 10:14 AM
Having read your blog for a few years now, I have always been impressed with your evenhandedness in terms of pointing out problems with data sets, analysis, models, etc.
I also understand your annoyance with Dr. Pielke’s statements. Today I find a post at his blog making claims regarding your post that are truly misleading.
He suggests you believe “asking questions about forecast verification is to be tabooo” because you call him a skeptic. Yet, your blog is full of examples were you do question the science and make suggestions on how it could be improved. He has failed to make the distinction between questioning a poorly done critique of the forecast models and an outright ban on making such critiques.
22 January 2008 at 10:40 PM
I know both Vincent Courtillot and Edouard Bard quite well. The first one because he belongs to this IPGP “clique” you mentionned and because of which I decided to move to USA (I froze my position at the CNRS and I am now working at the Colorado School of Mines where I am very very happy to work in a wonderful atmosphere). I know also Edouard Bard very well because I spent 9 years in the same institution than him (the CEREGE at Aix en Provence). He is someone very honest, quiet, and I have a high respect for him. I think he was really fed up to listen all this sh… from the IPGP to write this comment. About the IPGP clique, Le Mouel called several years ago the head of my institution, Bruno Hamelin, and asked him to find a way to impede me to work on the french volcanoes (Bruno Hamelin himself gave me this information). Another story: Dominique Gibert, who did his Ph-D thesis with Courtillot, published in EPSL a paper entitled “Electrical tomography of La Soufrière of Guadeloupe Volcano: Field experiments, 1D inversion and qualitative interpretation”, (Earth Planet Sci. Lett. 244 (2006) 709-724). This is my belief that this paper should not have passed the peer-review process and would not have been accepted if reviewed by a real expert in the inversion of electrical resistivity data. However, the Editor of EPSL was at that time… V. Courtillot and the paper was reviewed by phone by … Le Mouel. I co-wrote a comment about this paper: Linde, N., et A. Revil, Earth Planet Sci. Lett. 244 (2006) 709-724), Earth Planetary Science Letters, 258, 619-622, 10.1016/j.epsl.2006.02.020, 2007 (http://www.andre-revil.com/. Now Dominique Gibert has been appointed recently as responsible for the EM effects in the volcanological french observatories. He got few months ago the Dolomieu medal from the french Académie des Sciences (see http://www.geosciences.univ-rennes1.fr/article.php3?id_article=726) for his exemplary work in geoelectrical methods. I let you conclude !!!! This is right that these people have no shame.
9 February 2008 at 2:54 AM
Regarding the Global Warming Petition Project by the Oregon Institute of Science and Medicine (http://www.oism.org/pproject/),
do you have any information, pro or con?
Is there more information available on the _peer review(s)?
Names, titles, letters, other documents, conclusions, comments, etc.?
Frank Rapallo
11 February 2008 at 6:39 AM
Every example of coerelation without an underlying physical mechanism comes down to the “Lack of Pirates Causes Global Warming” theory doesn’t it? (See Pastafarianism and the Flying Spaghetti Monster).
The so-called debate over global warming, climate change, whatever you want to call it, is a big waste of time. People on both sides of the issue have made up their minds, and are not going to change them, no matter how much time you waste and how many thousands of words you put on the Internet.
If you are actually concerned about AGW, you need to realize that wasting all your time in pointless psuedo-debates is exactly what the deniers want you to do.
Instead, work on getting your side into power, so that the appropriate changes can be implemented as soon as possible.
12 February 2008 at 12:39 PM
You wrote: “The piece de resistance of Courtillot et al., is the following graph …”
However, the graphs aren’t visible anymore. Help! I’d greatly appreciate it if you could repair this - I’ve got a colleague who just read the report in the Jan 11 Science and I wanted to show him your analyses.
Thanks so much.
19 August 2008 at 7:44 PM
#129
Thank you, raypierre, for your generous invitation to continue the conversation. The “AGU dispatch #4″ thread - where some of the discussion on solar-driven ocean heat content took place - is now closed for comments, but perhaps this is the place to follow up.
What do you make of this paper:
Compo,G.P., and P.D. Sardeshmukh, 2008: Oceanic influences on recent continental warming. Climate Dynamics, in press.
They seem to suggest that we have new insights into ocean heating dynamics that could help inform the tuning exercise by which GHG forcing effects were calculated. Is it time yet to revise our estimate of the magnitude of GHG effects? Or is it always a bad time to do that?
As before, I’m interested in the details of how warming gets “in the pipe”, so to speak. This idea that the ocean can not possibly smooth out global temperature fluctuations by storing heat and releasing it over slow time scales relative to atmospheric dynamics.
(Especially relevant given the criticim on other threads of “narrow-minded electrical engineers” who are not so familiar with the dynamics of slow-response systems. Is Earth’s climate a “slow-response” system? (Feel free to define as you like.))
19 August 2008 at 10:07 PM
The published version of the paper is:
https://commerce.metapress.com/content/au9×40l201105273/resource-secured/?target=fulltext.html&sid=30gk1gymv3yoqe45c2xige45&sh=www.springerlink.com
DOI 10.1007/s00382-008-0448-9
SpringerLink Date Thursday, July 31, 2008 — $32.00
The August 2007 draft “Submitted to Climate Dynamics” is available:
http://scholar.google.com/scholar?num=50&hl=en&lr=&newwindow=1&safe=off&cluster=18313781490556654380
For anyone with access to both — how does last year’s draft compare to the published text?
19 August 2008 at 11:28 PM
I don’t see any differences, Hank. The abstract is identical:
Abstract
Evidence is presented that the recent worldwide land warming has occurred largely in response to a worldwide warming of the oceans rather than as a direct response to increasing greenhouse gases (GHGs) over land. Atmospheric model simulations of the last half-century with prescribed observed ocean temperature changes, but without prescribed GHG changes, account for most of the land warming. The oceanic influence has occurred through hydrodynamic-radiative teleconnections, primarily by moistening and warming the air over land and increasing the downward longwave radiation at the surface. The oceans may themselves have warmed from a combination of natural and anthropogenic influences.
I quickly scanned sections 1-4. No difference there.
The Acknowledgements are also identical:
Acknowledgments
We thank the following colleagues and observational and modeling centers for providing data and model output: P. Brohan, P. Jones, the UK Met Office Hadley Center, and the University of East Anglia Climatic Research Unit for HadCRUT3v; N. Rayner and the UK Met Office Hadley Center for HadISST1.1; J. Hansen and NASA GISS for GISTEMP; T. Smith and NOAA/ NCDC for MLASST; D. Dewitt and the IRI for ECHAM4.5 and
ECHAM5 data; S. Schubert, P. Pegion, and NASA/GMAO for NSIPP data; M. Alexander, C. Deser, A. Phillips, G. Meehl, and the CCSM Climate Variability Working Group for CAM3 data; J. Kinter and the Center for Ocean–Land–Atmosphere Studies for COLA data; and N.C. Lau, J. Ploshay, and NOAA/GFDL for AM2 data. We thank M. Wallace for thoughtful comments. We also thank two reviewers and the editor E. Schneider for suggestions which improved an earlier version of this manuscript. This work was supported by the NOAA Climate Program Office.
20 August 2008 at 12:03 AM
Re #118, Marion Delgado:
“The best response to you is … ”
I think the best response to me would have been to answer the question with the best available science.
I don’t think Tilo Reiber in #120 was satisfied with his (or my) responses either. (Tilo, your suggestion in #123 is the question that I asked to start this discussion.)
Raymond, neither Tilo or I understands this so-called physical argument that oceans can’t store heat and cough it up later in the form of smoothed out temperature trends. That is more or less what deep ocean circulation such as THC does. What are we missing?
20 August 2008 at 7:39 AM
Richard Sycamore, Well, the question is where would the oceans be storing heat that we couldn’t measure it, and how would it get to the surface without our knowing it. It seems to me that you are engaged in an activity that is fundamentally unscientific–you are trying to explain the unknown in terms of the unknown. You are positing some HIDDEN heat reservoir that manages to somehow unobserved transfer its heat to the atmosphere. Now even if you were to succeed, there’s the small matter of the stratosphere cooling as the troposphere warms. That is very hard to explain without a greenhouse-type mechanism. I am always wary of a single paper that claims to revolutionize a field. It is very difficult for a single paper to overturn a mountain of evidence. Creationists and other anti-science types keep confronting that, but it never seems to sink in.
20 August 2008 at 8:19 AM
Ray, what percentage of the ocean’s volume has been sampled by continuous-time temperature sensors over the last 30 years?
I’m not being “unscientific”. I’m pointing to a scientific paper, asking whether it is true that the atmospheric GHG effect has been overestimated, with the solar-ocean connection correspondingly underestimated. How is it “unscientific” to examine new data?
As far as the underlying physics of the GHG mechanism: enough already; I believe, I believe! The question - as always - is the *estimated* magnitude of GHG forcing, NOT whether it is ZERO. “Estimates” require statistical analysis of samples, and are therefore are prone to sampling error, and therefore ought to be periodically revised. So the question here is whether you think this paper will trigger a re-evaluation of that estimate. Looking forward to Raymond’s review.
[Response: Despite what you might have read, this paper offers no information on the forcings at all. It is a very standard procedure (google ‘AMIP’) to run models with observed SST changes and see what happens - most models did that for AR4 and similar experiments can be downloaded at the GISS website. These runs are good at testing teleconnections to ENSO for instance, but they are not any use for attribution of trends since increases (in the real world) in the atmosphere-to-ocean heat flux, emerge as ocean-to-atmosphere heat fluxes (ie. precisely the wrong way around) in AMIP experiments. They also have systematic differences in land relative humidity and variability even when using SST derived from the coupled version of same model. Much of the noise surrounding this paper is based on this assumption that one paper is going ‘to trigger a re-evaluation’ of global warming. It just isn’t going to happen, and thinking (as some appear to), that it is happening every other week is just self-deluding. - gavin]
20 August 2008 at 9:58 AM
Re #144
What’s “self-delusional” is supposing that I made assertions that I did not make. Shall I list them? I suppose not, as it doesn’t move us forward. Please, as always, just answer the questions with straight facts. No need to discredit yourselves by labelling my comments as “unscientific” and “delusional” and so forth.
I look forward to your noise-free review of this paper, and your signal-rich replies to my still-unanswered questions on ocean heat content dynamics. Which - as you will recall - stem from Raymond’s poetic remark:
“Say it three times every night before going to sleep: Temperature goes up. Solar stuff goes up and down and up and down and up and down. You can no more make a trend out of that than you can make a silk purse out of a sow’s ear.”
… a remark that suggests to me there is no way, physically, mathematically, to get a periodic power input to produce a temperature trend output. And yet each morning I plug my kettle in, and using AC current channeled through a resistance coil, produce a temperature trend that boils water. Forgive us - Timo and I and a bunch of electrical engineers - we are just trying to understand the mathematical difference between these two systems.
Thanks as always for your patience and interest this question.
[Response: The Earth kettle has been on for millennia (and longer!) - you’d have more of a point if the sun didn’t exist 50 years ago. Except that it did. Without a trend in the long term output of the sun, you aren’t going to see a trend in the Earth’s temperature. It really isn’t that hard. - gavin]
20 August 2008 at 10:19 AM
I’m not sure why this is in the ‘Geomagnetic’ thread?
The paper said they were addressing:
“To what degree is [global warming] directly attributable to local GHG increases?”
Is there any model or theory suggesting that warming on land is due to _local_increases_ in greenhouse gas?
Do they mean local _emissions_ as distinguished from, say, locala increases in humidity when wet air blows in from the ocean in a weather front?
It seemed to me as an amateur reader that they were ruling out an unlikely possibility, nothing more. Were they trying to do anything else? Were they trying to show that something (geomagnetic?) is heating up the oceans in some way that doesn’t show up in the oceans but increases humidity over the land? Bu
20 August 2008 at 11:21 AM
Hank #146 asks:
“I’m not sure why this is in the ‘Geomagnetic’ thread?”
It’s in the thread where raypierre in #129 said:
“Thanks to you all for contributing to such a high quality discussion. I will continue reading this, so if there are any points that anybody would like to see addressed at greater length, please do post your query.”
Like I said, the original thread where raypierre made the “solar up down, temperature up” comment is now closed. Thread it wherever you like.
But to the point: you disagree with the statements in the abstract?
1 September 2008 at 12:42 PM
Re #145
“Without a trend in the long term output of the sun, you aren’t going to see a trend in the Earth’s temperature.”
The last six solar cycles exhibited higher peak sunspot activity and higher TSI than the previous five. There is your trend. That the change in solar activity was fairly sudden and preceded the 1950s temperature rise by a decade or so is not surprising given the time constant of the ocean. The effect of solar is not instantaneous, but is lagged, due to its effect on ocean heat content. How do you account for this lag (of uncertain magnitude) in the attribution model?