 The main theme of the European Meteorological Society (EMS) annual meeting was high impact weather. This includes extreme weather and the predictability of these.
The majority of the presentations focused on the science, but aspects such as the utility and the benefit of meteorology and climatology were also discussed. A media session also provided some thoughts about outreach and presented some examples of how weather is presented on TV. While gender and educational issues were discussed, the underrepresentation of other minorities was neglected.
A large number of presentations was devoted to the THORPEX-project, studying predictability. The use of so-called ‘ensembles’ in forecasting and climatology is still a central topic, but there was also some focus on ‘targeted observations’. Targeted observations means that scientists use the weather models to estimate which sensitive parts of the world we need to know more exactly for more accurate forecasts.
One example is the forecast for tropical cyclones in the US, which routinely employ targeted observations through dropsondes from research planes to get more accurate forecasts of the cyclone trajectory and intensity.
Some presenters talked about ‘ET’, which is the acronym for extra-tropical transitions, when tropical cyclones become extra-tropical storms. ETs are often associated with larger forecast errors and they interact with the ambient atmospheric flow. Thus, ETs can provoke disturbances in the large-scale flow with implications for the subsequent weather forecasts. Tropical cyclones which become extra-tropical storms can also have a severe impact in the mid-latitudes.
In many respect, weather forecasting/meteorology has been leading climatology in terms of progress, and advances in meteorology has often subsequently benefited climate research. This is true for numerical models for simulating the atmosphere, ensemble forecasting, re-analysis, and observations. A new buzz-word is the concept of ‘seamless prediction’, in which predictions ranging from nowcasting all the way to future scenarios are provided with a sliding time scale and that doesn’t make distinction of incremental types such as ‘weather forecasts’ ‘seasonal predictions’ and ‘climate scenarios’.
Weather and climate studies can be regarded as converging in seasonal forecasting, which can be regarded as both an initial value and boundary condition problem. The former because the state of the slowly varying ocean must be known in order to compute how it will change in the future, and the latter because the oceans condition the atmosphere (provides boundary conditions) even beyond the time limit when chaos makes the prediction of the exact (deterministic) weather evolution impossible (variations are must faster in the atmosphere than in the ocean). The skill in seasonal forecasts is still low outside the tropics.
The conference also had a session on solar-terrestrial connections, which was a mixture of real and weird science. Some of the talks were completely impossible to understand. Somehow, it was a bit nostalgic with (digitized) hand drawn curves, small invisible figures, and pages crammed with text (the presenter might as well have spoken Russian – I wouldn’t have understood less). Some speakers went on and on, even after their time was up (bad presentation skills – including hand drawn graphs and overrunning one’s time – are of course not exclusive to solar enthusiasts). It was funny to note that the different presenters believed in different ways solar activity can affect each other, but often didn’t believe in each other ideas. There were quite a few critical comments about the GCR-hypothesis.
The EMS has established a new website with a forum for debates concerning of more applied character than here at RC: Planning of future conferences; EMS Strategy & Discussion on the implementation of the strategy; Hot topics (scientific issues, societal impact, recent weather anomalies); Communicating information about weather and climate; and Open discussion.
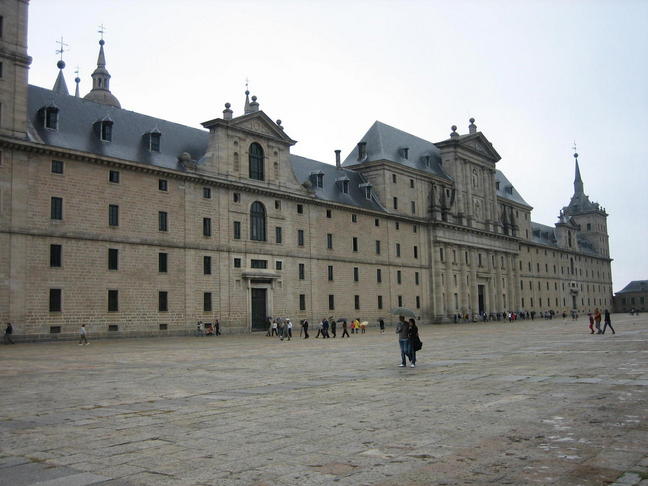
Because of the rain in Spain, the lecture theatres were often quite crammed, and people often had to sit on the floor or peer in from the corridors. Sometimes the it was difficult to get a seat in the climatology sessions – every conference has it’s share of more-popular-than-expected sessions. The only exception was the session on solar-terrestrial connection in which the lecture room – surprisingly – was almost empty.
Semi-related: Speaking of extreme weather, has there been any recent discussion/observations regarding what is being experienced in the Southeast of the U.S. (and to a lesser extent the Southwest) and how the unusually dry, hot season relates, if at all, to climate science? (I mean aside from the obvious trends of rising temperatures associated with AGW.)
My understanding is many regions are actually facing the prospect of running out of water.
J.S. McIntyre — Here is my amateur take on this. The Intertropical Convergence Zone (ITCZ) has been moving north over the last several years. The result in Brazil is that the southern part of the Amazon Basin is turning into a warm and dry savanna.
I suspect much the same effect is occuring in the Southeast United States, but don’t ask me to explain why. :) The Handley Centre report on regional climate changes for the year 2050 predicts this conversion to savanna, I believe.
Just got a solicitation from Frederick Seitz. What the hell is he talking about?
Thanks
I’ve read that you need 40 inches + inches of precipitation for forests to grow and thrive. Savanna’s require 10 to 30 inches. 30 to 40 inches yield savannas with some trees to areas of sparse woodland. Average rainfall per year drives the bio-geography.
John, re Seitz/Oregon petition, see: http://rabett.blogspot.com/2007/10/those-who-dont-remember-history-are.html
Re: #4 The Llanos in Venezuela receives 40-60″ of rain a year and is a beautiful, seasonally inundated, savannah http://www.venezuelatuya.com/llanos/indexeng.htm?yPPip8duSp8M Whether or not an area supports forest or grassland is dependent upon rainfall timing (winter or summer), rainfall intensity (long duration or short, intense events), soil type (permeable or impermeable) and the presence and type of grazing animals. Fire, natural or anthropogenic is also critical. Here in Houston I live on what was a savannah despite getting 52″ of rain a year that is equitably distributed. It’s the horrid clay soils that does the trees in along with a flat landscape that contains few natural fire breaks. Our soil might as well be brick once it dries out. Hopefully the folks at GISS who are publishing the stuff on how the Amazon Rain Forest does well in reduced rainfall conditions are aware that fire and soil type can have a synergistic effect that leads to forest retreat with even small drops in rainfall. Factoring in human behavior is even more difficult. If climate scientists are going to include vegetation changes as drivers in long term predictive models, they need to get this right. As always, better interdisciplinary cooperation is needed. For example, I think the folks in the western US were caught off guard on how intense the reaction of pine beetles and fire season intensity to warmer weather would be.
J.S. McIntyre (#1) wrote:
To add to what David B. Benson wrote, although in a slightly different language I believe, climate models have predicted the expansion of the Hadley cells – which has been observed, although I believe what has been observed has been somewhat larger than was predicted. With the expansion of the Hadley cells, you move the high pressure zone between the Ferrel cells and the Hadley cells northward, and with this bring about a drier climate. This is what is expected to result in a permanent dust bowel in the US South West under Business As Usual, and I believe it also in part explains the drying out of California which is already taking place.
Same latitude, I would expect the same sort of thing in the US South East. Climate models show a considerable rise in temperature in the South East – roughly to the same degree as the South West. (Central US? Not as much – but then there is there is the drying out of the continental interior which is supposed to be strongest during the summers.) Likewise, the climate is supposed to change by 2080 in the continental US to the point that we won’t be able to grow wheat south of the Canadian border.
However, as of yet I know of nothing regarding the present situation in Atlanta being attributed to climate change. Not saying that it isn’t out there. Just that I haven’t run into it as of yet.
I will do a little digging, though.
PS Incidentally, I have seen some attribution of the considerable drop in water level in the Great Lakes to climate change – but nothing technical as of yet.
Re: Atlanta drying out?
I found this in the news, but it is dealing with conflicting projections…
Yes, and the issue with running out of water is that what looks like a relatively low but sustainable supply turns toxic as algal blooms grow in the warm water drop toxins. So even where volume of water available is not a major issue yet, the toxins from the algae are seeing supplies becoming unusable very rapidly. This is a global problem and is hitting big cities.
Sydney is recognising the issue exists but is still head-in-the sand about the potential rapidity of a turnover of the water quality. Algal blooms are not called blooms for nothing – they can happen over a sunny afternoon to an entire water body.
http://www.theage.com.au/news/National/Algae-covering-most-of-Warragamba-Dam/2007/09/27/1190486462486.html
September 27, 2007
The layer of blue-green algae on the surface of Warragamba Dam – Sydney’s main water supply – now covers 75 per cent of the surface area and is likely to remain all summer…
…”It is not a health risk whatsoever, even though part of the rigorous testing that Sydney Water and Health undertake has detected some microsystems – which are a group of molecules which contain some toxicity…
But the toxicity is well documented as being acute…
http://www.nzherald.co.nz/section/1/story.cfm?c_id=1&objectid=10468612
3:20PM Monday October 08, 2007
Toxic blue-green algae had already killed dogs, sheep and cattle that drank from the lake, Dr Barbara Dolamore, a Christchurch Polytechnic Institute of Technology (CPIT) senior lecturer in biochemistry and molecular biology, said today.
http://article.wn.com/view/2007/10/08/Drinking_water_advisory_in_Dunes_City_to_stand/?section=StoryResults&template=cheetah-search%2Findex.txt
Drinking water advisory in Dunes City to stand
October 08, 2007
Residents near Siltcoos Lake who draw their drinking water from the lake are being told it will be at least another week before they can use their main source…
…rather than collapsing as hoped, algae levels are actually holding steady
So in every locality where water flow is low and temperatures are high the residents are in real danger of total cut off of municipal water supplies.
IPCC is a bit too broad brush to identify these point failures, but these are surely evidence of climate change and its impact on people. Again, we should stop haggling over the cause and start global efforts at providing means for the people of Dunes City, Adelaide, Sydney and hundreds of others to efficiently make potable water out of toxic supplies. Maintaining sterility at source is now a dream of better times gone by – we have to adopt personal responsibility for water quality and supply within our own property.
Thanks, Andrew Sipocz. As usual the real world is much more complicated than a simple idea. There are many contributing factors to the creation of a savanna in addition to rainfall.
So how long does the drought in the Southeast have to last before it’s recognized as ‘climate change’?
Re #11
If the experience in Australia is anything to go by, about 15 years.
Also speaking of extreme weather, but to be filed under the heading of anecdotal evidence is the statement yesterday by the Director of the Rockefeller Center ice skating rink yesterday on the occasion of its opening day in Manhattan.”This is the first year we’ve competed with the beaches.” The high temperature in Central Park was 87F. Normal high for the date is 66F.
The beaches were indeed open over the weekend, as temperatures were above 80F, all weekend and well past the official closing date of the beaches on Sept.16.
Maybe more — any single llocal event is going to be lost in the local variation (California has had droughts of hundreds of years, looking at the lakebed sediments — the last couple of centuries have been a rare wet spell, unfortunately for city planners who assumed they were normal).
You have to look beyond the local record, to detect a climate change signal unambiguously.
RE #s 3 and 5: There’s more on the Oregon Petition revival over at DeSmogBlog. John, the author of that DSB post would really like a copy of the package you received.
Timothy Chase (#7):
Does this mean the Northwest back passage will be open?
Regarding the sun-earth interactions.
We know, that the warming during 1910-1940 was largely contributed by the increased sun activity. We also know, that this increase in glob. temps. was only slightly smaller than modern era of warming. It is proposed, that even if we stopped CO2 now, we have additional warming of cca. 0.5C for several decades, mostly due to thermal inertia of the oceans. Is similar warming “committment” to be expected from the warming during 1910-1940 and if so, can that be observed now?
Or, put it differently, when did the climate fully equillibrated after 1910-1940 increased sun activity?
Re 8
i.e. no one has any idea what is going to happen to climate in the SE USA. The only thing for certain is that it won’t be the same in a hundred years as it is now – there’s a stunning revelation for you!
Re #40: [I’ve read that you need 40 inches + inches of precipitation for forests to grow and thrive.]
You can get forests on much less rainfall than that. Here on the east side of the Sierra Nevada we get about 8″ average annual precipitation at the base (most of that falling as snow in the winter). That of course increases as you go upslope, but mixed pine forests extend down to 6000 feet and lower. On the mountains to the east, there are even drier forests that are mostly juniper & pinon pine.
In response to #1:
There is no GW in the Southeast, at least where I am (SC). As far as I know, that is not disputed (the Southeast is a cool spot on all the maps in the IPCC report).
As far as droughts go, it’s pretty dry, but I tend to think that is largely due to the AMAZING lack of hurricanes over the past two years. August-September is normally the wettest part of the year in this region, due to the high number of tropical storms and hurricanes that sweep through in those months. Haven’t seen one of those things in a couple of years now … *cough!*
I heard on 60 Minutes today that, due to increased forest fires in the western U.S. due to global warming, that by 2100 50% of the forest cover will be gone (fires will be too frequent for the trees to regrow). They showed an ancient Ponderosa Pine forest in Arizona where centuries-old trees have been killed by this year’s fires and won’t regrow (and the big Ponderosa pines have been able to survive the pre-global warming fires). I live near Oregon and was driving over the Cascades a couple of weeks ago, and was astonished to see that all the trees at the top of the pass I was driving over had all burned (and all looked dead). 60 Minutes noted that the fire season is now 2 months longer than it used to be, and there never used to be forest fires at the higher elevations and now they occur every summer, since the snow melts earlier and isn’t there to stop them.