Tropical tropospheric trends again (again)
Many readers will remember our critique of a paper by Douglass et al on tropical tropospheric temperature trends late last year, and the discussion of the ongoing revisions to the observational datasets. Some will recall that the Douglass et al paper was trumpeted around the blogosphere as the definitive proof that models had it all wrong.
At the time, our criticism was itself criticised because our counterpoints had not been submitted to a peer-reviewed journal. However, this was a little unfair (and possibly a little disingenuous) because a group of us had in fact submitted a much better argued paper making the same principal points. Of course, the peer-review process takes much longer than writing a blog post and so it has taken until today to appear on the journal website.
The new 17-author paper(accessible pdf) (lead by Ben Santer), does a much better job of comparing the various trends in atmospheric datasets with the models and is very careful to take account of systematic uncertainties in all aspects of that comparison (unlike Douglass et al). The bottom line is that while there is remaining uncertainty in the tropical trends over the last 30 years, there is no clear discrepancy between what the models expect and the observations. There is a fact sheet available which explains the result in relatively simple terms.
Additionally, the paper explores the statistical properties of the test used by Douglass et al and finds some very odd results. Namely, that their test should nominally inadvertently reject a match 1 time out 20 (i.e. for a 5% significance), actually rejects valid comparisons 16 times out of 20! And curiously, the more data you have, the worse the test performs (figure 5 in the paper). The other aspect discussed in the paper is the importance of dealing with systematic errors in the data sets. These are essentially the same points that were made in our original blog post, but are now much more comprehensively shown. The data sources are now completely up-to-date and a much wider range of sources is addressed - not only the different satellite products, but also the different analyses of the radiosonde data.
The bottom line is best encapsulated by the summary figure 6 from the paper:

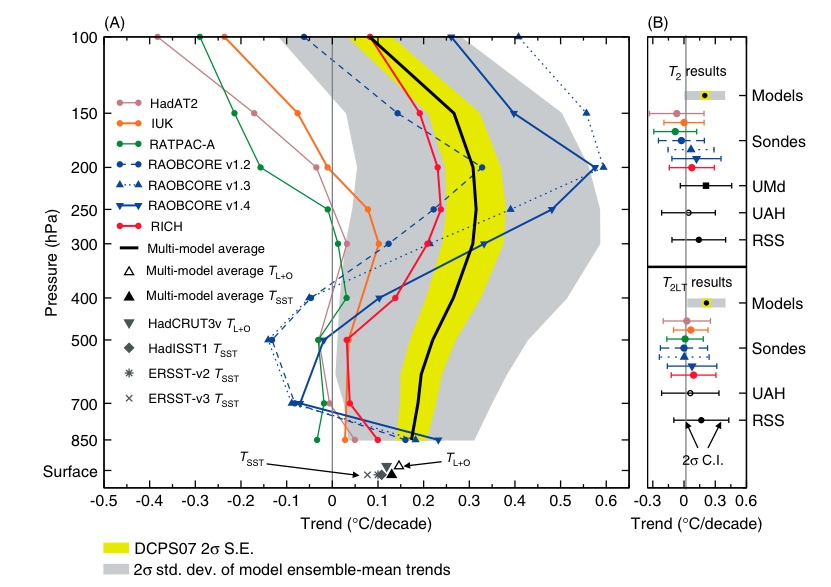
The grey band is the real 2-sigma spread of the models (while the yellow band is the spread allowed for in the flawed Douglass et al test). The other lines are the different estimates from the data. The uncertainties in both preclude any claim of some obvious discrepancy - a result you can only get by cherry-picking what data to use and erroneously downplaying the expected spread in the simulations.
Taking a slightly larger view, I think this example shows quite effectively how blogs can play a constructive role in moving science forward (something that we discussed a while ago). Given the egregiousness of the error in this particular paper (which was obvious to many people at the time), having the initial blog posting up very quickly alerted the community to the problems even if it wasn't a comprehensive analysis. The time in-between the original paper coming out and this new analysis was almost 10 months. The resulting paper is of course much better than any blog post could have been and in fact moves significantly beyond a simple rebuttal. This clearly demonstrates that there is no conflict between the peer-review process and the blogosphere. A proper paper definitely takes more time and gives generally a better result than a blog post, but the latter can get the essential points out very quickly and can save other people from wasting their time.

12 October 2008 at 7:55 PM
I just want to say that I (as PhD-Student) agree on what you are saying; blogs can be a good contribution in the scientific debate. Not least by keeping the public alert on different discussions on going behind the “scenes” of peer-reviewed journals.
12 October 2008 at 8:41 PM
This 17-author paper basically says that the models would only be “incorrect” if observations were roughly outside the 0.0 to 0.5 degree-per-decade window.
This means that no warming whatsoever over the next century would not invalidate the models.
Interesting.
[Response: But not true. These are hindcasts for a specific period (1979-1999) and the variance is in large part due the shortness of that period and the degree of ‘noise’ - both internal and forced (i.e. volcanoes) - that confuses the estimate od the long term trends. Our previous post dealt with what the models expect for periods in the future - and the longer the time frame the less influence the short term variations have. - gavin]
12 October 2008 at 10:38 PM
Well done. It is also worth noting that the earlier work by Douglass et al. (2004) on this subject had issues in observational data sets pointed out by Fu and Johanson (2005), Mears and Wentz (2005), and Sherwood et al. (2005).
12 October 2008 at 11:41 PM
Many thanks for this site yet again!
Please don’t forget that many papers are not readily available to the public (most have to buy them). This means that the best insights the average person can get is what the blog postings and following discussion reveals about the papers and their weaknesses/strengths.
Also, many out there don’t have the technical expertise or time to read the papers even if they could get hold of a copy.
Therefore, the general public relies on sites like this one to help keep up to date with the state of climate science. This is such an important issue that blog sites like this one MUST be maintained.
[Response: Thanks. We realise that access to papers is limited for most of the public and we link to free versions where possible. In this case, I recommend reading the fact sheet (linked above) to get a good sense for what was done. - gavin]
13 October 2008 at 12:22 AM
Good post gavin. I think I’m reading the trend chart wrong, but is the mean of the models higher than the mean of all 10 data sets? What do the error bars at the surface look like? Did all the models include volcanic forcing? Err maybe I should read the paper first
13 October 2008 at 4:26 AM
How did Douglass et al get published in a respectable journal? Did the editors let it through despite being aware of the errors?
13 October 2008 at 6:49 AM
What do Messrs Santer et al mean by surface temperature? The surface I live on comprises two lawns, some areas shaded, some not, flower beds, a new black tarmac drive, a new white stone patio, and a fairly fast flowing river. How would they propose to measure its temperature? Like all the other surface temperatures (apart from the 75% of the surface covered by the oceans) they would probably suggest placing the thermometer a few meters up in the atmosphere.
Satellites are by far the best way to measure atmospheric temperatures across the planet.
I do urge all contributors who are so certain of the AGW theory to at least look at the UAH data (Google Global Warming at a Glance). [edit]
From 1978 to 1996 neither the lower or mid-troposphere data show any warming. The warming which lends credence to the AGW theory occurred over three years from 1999 to 2002. Thereafter, temperatures remained “high” (plus 0.2 degrees above the long term average) and fluctuating for 4 years to 2006. (You would find it difficult to detect this change in the average temperature of your house).
Thereafter the temperatures fell back to 1978 levels.
The mid-troposphere chart experienced the same relatively sharp increase from1999 to 2002, but the increase was much lower, and more rapidly reversed – hence the difference between the long term trends.
The models follow the CO2 concentration, which is why the Hansen “B” line and the “surface” temperatures are diverging.
Santer’s fact sheet does not display troposphere temperatures after 2005.
If the satellite data is anything like accurate then AGW warming theory is either plain wrong or nothing to worry about. If current (1978) temperatures persist for the next 5 to 10 years, challenges to the AGW consensus will increase rapidly, both in number and volume.
[Response: Wrong again. But feel free to continue ignoring all previous corrections of your faulty thinking. - gavin]
13 October 2008 at 7:38 AM
I am not an expert by any definition, but just a layman keenly interested (concerned) about the future of the planet and my children, all our children.
I am also very concerned that the current debate on global warming gets so specialized that the forest may well be missed out for the trees.
There seems to be a lurking expectation in some of the climate scientists and others that a new ice-age may be dawning that will yet save mankind from the apocalypse of melting polar ice and significant rise of sea levels in our lifetime. In other words, there is no warming effect of greenhouse gases and
humans can carry on with Business As Usual, including massive burn of fossil fuels.
There is also little or no awareness among the lay public that greenhouse gases are cumulative and the accumulation is exponential in scale today and has been in the last 150 years since the industrial engines appeared.
Somewhere I read that the current production of greenhouse gases is twice as much as what the green plants (on land and in the sea)can neutralize. In other words, the “tipping point” is already far exceeded and there cannot be any new equilibrium of production/neutralization of greenhouse gases.
So any real solution would only come through total and serious cutback in human lifestyles and corresponding energy use.
Please start educating the lay public about global warming in a simple(and stark)way that they can understand. Please also provide a forum for getting some expert advice on what the alternate lifestyles of the future world must look like, in order that we may have a future.
13 October 2008 at 8:06 AM
Steve (6) Peer review will never be a guarantee that published papers are free of (even obvious) errors, reviewers editors and authors are all only human and there will always be a chance that none of them will spot the error in time. However here we have seen good science in action in that the error has been spotted and corrected (well done Santer et al!). It also highlights the advantage of pre-prints being made available by the publisher as it means that the correction is made more rapidly that would otherwise be the case (well done IJC).
It is important however that the correction to high profile or contraversial papers are made both in the blogs and in the peer-reviewed litterature, as otherwise the correction is all too easily dismissed by saying “RealClimate, well they would say that wouldn’t they?” ;o)
13 October 2008 at 9:31 AM
I agree with “the other Gavin”. Peer-review isn’t the end-all filter for good science. It is simply the first one. And reviewers are often very pressed for time, so sometimes errors fall through the cracks
13 October 2008 at 10:12 AM
The paper is available at LLNL page
https://publicaffairs.llnl.gov/news/news_releases/2008/NR-08-10-05-article.pdf
Its final conclusion is as follows:
“We may never completely reconcile the divergent observational estimates of temperature changes in the tropical troposphere. We lack the unimpeachable observational records necessary for this task. The large structural uncertainties in observations hamper our ability to determine how well models simulate the tropospheric temperature changes that actually occurred over the satellite era. A truly definitive answer to this question may be difficult to obtain. Nevertheless, if structural uncertainties in observations and models are fully accounted for, a partial resolution of the long-standing ‘differential warming’ problem has now been achieved. The lessons learned from studying this problem can and should be applied towards the improvement of existing climate monitoring systems, so that future model evaluation studies are less sensitive to observational ambiguity.”
13 October 2008 at 10:37 AM
Please don’t forget that many papers are not readily available to the public (most have to buy them).
On the contrary, most university doors are WIDE OPEN to the public, joe six pack merely needs to get off the couch and wander down to his or her local world class university research libraries and look them up. There are costs involved, page charges run anywhere for a few pennies up to a dime a page for the venda copy machines or the laser printer. Many of these papers may be available on a preprint server as well, and if you dig deep enough, they are available as fair use copies on the author’s web pages.
Captcha : concluded for
13 October 2008 at 11:30 AM
“On the contrary, most university doors are WIDE OPEN to the public, joe six pack merely needs to get off the couch and wander down to his or her local world class university research libraries and look them up.”
For most of us that is more than enough, unfortunately, to preclude the use of the term “readily available.” I live in an area boasting 10+ universities in the metro area, and I’d still have to budget about 2 hours of round trip driving, and a minimum of an hour–and probably more–to get in, find the material, copy what I need, and get out again. Not so practical. I’m really doing more than I should–”should” in relation to the practicalities of daily life–when I take 40 minutes online to browse a few climate papers that I *can* access.
(captcha: “tieing booked”)
13 October 2008 at 12:28 PM
> [Response: Wrong again. But feel free to continue
> ignoring all previous corrections of your faulty
> thinking. - gavin]
Is there a search string that will find posts by an individual userid that include inline responses?
[Response: Yes. Add “class=response” to the string. This picks out the html that we use to colour the inline responses green. - gavin]
13 October 2008 at 12:34 PM
Nice work! You all should consider featuring your “Fact Sheet” a bit more prominently, perhaps even before the fold, because it seems to be a definitive resource providing refutations to nearly every single claim advanced by skeptics in the wake of the Douglass debacle.
I’ll third the assertion of Figen and “other Gavin”; blogging can be a way of disseminating information to a large group of people rather quickly, but it is most effective in cases like this where it is paired with the traditional, rigorous academic exercise of peer-review.
13 October 2008 at 2:14 PM
Re #s 9 and 10: In addition to the errors in the paper seeming like the sort of thing a peer-reviewer ought to have caught, the presence of Fred Singer as a co-author ought to have singled the paper out for special attention. So, as I said, it begins to seem plausible that the editors were aware of the problems and published it anyway. IMHO there’s a reason to have done so, i.e. that it’s useful for such things to get corrected in a reasonably prominent place. But is that what happened?
13 October 2008 at 2:27 PM
For the past year, the satellite troposphere anomalies (20S to 20N) have been negative (as much as -0.5C) - La Nina obviously.
But wouldn’t that change the analysis - first, the linear trend is now only 0.06C per decade and secondly, the Nina 3.4 region and ENSO are bigger influences than previously thought.
13 October 2008 at 3:30 PM
So, am I reading that graph wrong or does the mean of the models exceed the mean of all 10 observation sets , and that the mean of the surface hindcast for both Land and Ocean and SST exceed the 4 observation means as well.?
Also, how about a quick list of the models used?
13 October 2008 at 3:40 PM
The thing is even if Fred Singer’s name is probably a flag for a lot of people, as an editor you have to treat everything fairly. if the reviewers did not find fault then one would have to either send the paper to more reviewers (which would take an inordinate amount of time) or rejecta a paper based on its authors list. While that may have been appropriate in this case in hindsight, it opens the door to a slippery slope. Then new or untenured scientists will have a harder time getting published than established ones “in the old boys club.”
To avoid all that, I think peer review should be double blind so the work is judged on its own merits and not its authorship or familiarity with specific authors or their affiliated institutions.
13 October 2008 at 4:06 PM
In #8 Vinod Gupta wrote … “Please start educating the lay public about global warming in a simple(and stark)way that they can understand”. …
However,
although Realclimate has done well in their efforts to do that, the required resources and responibility to succeed on the large scale exist only in governments (who have so far failed, miserably)
13 October 2008 at 4:32 PM
Just had a quick glance at the fact sheet.
Have the authors considered the possible effects of El Chichon and Pinatubo in diminishing the relative tropospheric temperature peaks of the ~1983 and ~1992 El Ninos, thereby steepening the tropospheric trend?
[Response: The volcanic effects were taking into account in the models, but the precise timing of El Nino events is going to be different in each model - that in fact is a big factor in the variability of the 20 year trends. - gavin]
13 October 2008 at 5:53 PM
As a non scientist, but (I would like to believe), a fairly scientifically literate layman, it seems that the evidence for AGW and the physics based explanation for it are irrefutable. The denialists in my opinion are similar to those who believe in the efficacy of accupuncture, homeopathic remedies, and chiropractic medicine. They will seize on any tiny scrap of data supporting their claims while ignoring the vast amount of objective scientifically based evidence to the contrary.
13 October 2008 at 11:46 PM
Figen Mekik: “then one would have to either send the paper to more reviewers (which would take an inordinate amount of time) or rejecta a paper based on its authors list. While that may have been appropriate in this case in hindsight, it opens the door to a slippery slope.”
You must be joking! Are you seriously suggesting that the Douglass et al paper should have been rejected on the basis of the authors? What are you? The thought police?
Who is to say that the Santer et al paper is correct and free of mistake? Papers are accepted because they are based on sound research and the methodologies are also sound. That is not to mean that they are error free.
Santer et al have produced a paper that argues a different hypothesis to Douglass et al. It does not mean by any means that Santer et al is more correct or more free of potential challenge.
Because Gavin SAYS that it does a better job of comparing trends does not make it so.
[Response: … though it does make it a little more likely
- gavin]
14 October 2008 at 3:40 AM
Thomas Lee Elifritz writes:
Some of the most crucial journals are no longer available in paper; if you don’t have a multi-hundred-dollar-a-year subscription, you’re SOL. The premier planetology journal, Icarus, is an example. Paywalls matter. They are effectively restricting scientific data to professional scientists, which is a bad thing.
14 October 2008 at 6:04 AM
As Einstein said, Mr White (22) 10,000 observations may support a theory - it only takes one to refute it. Science would not progress without the one observation out of step.
For example, at my University, many years before the discovery of radioactivity, a professor of Physics noticed that sealed photographic plates in a drawer had been darkened. They were adjacent to a cupboard containing Radium.
He solved the problem by moving the plates to another room.
The tiny scrap of data to which you refer are the satellite temperature records from 1978, which was the year of the global temperature trough following the previous peak in the 1940’s.
Because it contradicts AGW theory, that data has been very thoroughly analysed and criticised. Adjustments have been made for all kinds of systematic errors, and at least one arithmetical error has been acknowledged and corrected.
The results (surely worth a glance) reflect all known temperature perturbations, including the 1988 peak. They are published and plotted every month, (Google Global Warming at a Glance), and overlaid onto the GISS surface data on which Anthony Watts (Watts up with That) labours so strenuously.
You might also be interested in Tamino’s very interesting post (Open Mind) on the long running Central England Temperature record. His polynomial form fitting suggests a new “hockey stick” shape with an up-tick of 0.5 degrees this decade. Temperatures at the start of the decade were about 10.5 degrees centigrade – high but not remarkably so. His data suggested a temperature up-tick this decade from 10.5 to 11.0 degrees centigrade, which would be absolutely unprecedented.
With 15 months to go there is no sign of the up-tick. This year looks like coming out at 10.2 degrees, the 25th warmest year in the record.
14 October 2008 at 7:27 AM
Richard says “Santer et al have produced a paper that argues a different hypothesis to Douglass et al. It does not mean by any means that Santer et al is more correct or more free of potential challenge.”
No, that is not correct, both papers seek to determine whether the observational data are consistent with the models, however Douglass et al use a statistical test that actually answers a different question, namely “is there a statistically significant difference between the mean trend of the ensemble and the observed trend”. The two questions are not the same, and indeed AFAICS one would not expect the observed trend to be exactly equal to the ensmble mean even if the models were perfect, so it is hardly a reasonable test of the validity of the approach!
14 October 2008 at 8:09 AM
Richard,
Please read my earlier post carefully. I said it would not be right to reject papers because of their authorship. That is what my comment was all about.
You say “What are you? The thought police? ” Again, please read everything one posts before jumping to conclusions about what they are saying. I encourage double blind peer review so no one will act as the thought police.
14 October 2008 at 9:57 AM
most university doors are WIDE OPEN to the public, joe six pack merely needs to get off the couch and wander down to his or her local world class university research libraries and look them up.
That’s a pretty high bar. If you’re an ordinary person and simply want to check something you’ve read in a newspaper article, you’re unlikely to want (or be able) to invest several hours in doing so.
14 October 2008 at 11:33 AM
Re: #25 (Fred Staples)
Gavin is right, you staunchly continue ignoring all previous corrections of your faulty thinking.
You’re assigning far too much certainty to the UAH satellite reduction. Yet it’s in disagreement with similar satellite reductions from RSS (which is the subject of *this* post), and from the U. of Washington, and from the U. of Maryland. If the satellite data are as surefire as you believe, why do 4 separate groups come to different conclusions based on the SAME raw data?
You completely ignore the fact that satellites don’t *measure* lower-troposphere temperature. They measure temperature in very large segments of the atmosphere, and the “T2LT” channel for the lower troposphere is *inferred* from the data of those other channels by attempting to correct for the stratospheric influence and other factors.
As for the CET record, in the context of *this* post you’re just trying to change the subject. But for your information, the *data* (which are not mine, but are freely available from the web) suggest a rate of increase of 0.5 deg.C per decade. Anyone interested in what the rate of increase presently is should download the data and fit a regression line from, say, 1975 to the present.
As for “this year coming out at 10.2,” are you completely ignorant of the variation present in year-to-year results? The standard deviation of the residuals from a linear regression to annual averages 1975-2007 is 0.472, so we expect a range of variation of roughly +/- 0.94 deg.C from the long-term trend. I guess you’re just a member of the “it was cold yesterday in London, so global warming must be false” brigade. You’re seriously in need of an education about the statistical nature of noise; this is one of many posts I’ve done on that topic.
Finally: any flattering reference to Anthony Watts and his blog casts doubt on both your objectivity and your competence. Those interested in the “quality” of the work of Watts and his collaborators should read this and this and this and this and this and this.
14 October 2008 at 12:03 PM
Outeast — your local library can borrow any journal they don’t carry. Ask about “Interlibrary Lo-an.”
(Hyphen for the spamhallucinator software.)
The Reference Librarian will have additional suggestions for searching.
It’s easier to find than complain about.
14 October 2008 at 12:20 PM
Hopefully this is not too much off topic, but i was reading this article by Lomborg and am wondering where he goes wrong:
http://www.guardian.co.uk/commentisfree/2008/oct/14/climatechange-scienceofclimatechange
He doesn’t give any sources for his statements about lower temps and sea level rise, so i wonder if they’re correct, and if not, what the correct numbers are. Apart from exact numbers, isn’t his main error that he’s looking too much at short term variations instead of looking at the longer term trends and projections?
14 October 2008 at 2:01 PM
“You’re seriously in need of an education about the statistical nature of noise;” (Tamino)
Ah that wonderfully scientific term ‘Noise’
Here is the full data set from UAH since satellite data became available.
1978 - 1994
http://woodfortrees.org/plot/uah/from:1978/to:1994/trend/plot/uah/from:1978/to:1994
1995 - 2000
http://woodfortrees.org/plot/uah/from:1995/to:2000/trend/plot/uah/from:1995/to:2000
2001 - Date
http://woodfortrees.org/plot/uah/from:2001/to:2009/trend/plot/uah/from:2001/to:2009
So Tamino, you often state that ‘noise’ can mask the true signal. So what is the true signal here? The cooling periods 1978 - 1994 and 2001 to date being masked by a warming trend from 1995 -2000? Or a warming trend from 1995 - 2000 being masked by cooling trends from 1978 - 1994 and 2001 - 2009?
I cannot see why people are tring to kick up the most almighty panic on these trends especially when this is combined with no visible acceleration in sea level rise to anywhere near the levels predicted by the models.
Also these trends this century are against a background of higher than estimated man made CO2 emmisions and also that the forcing factor of this affect must have already been at its highest level during the 21st century and can only decline as total atmospheric CO2 increases. After all we know the climate does not have a linear response to rising CO2 levels or the Earth would have already suffered a runaway greenhouse effct in its past.
So how do you justify some of the apocalyptic predictions people seem happy to bandy about?
Alan
14 October 2008 at 2:32 PM
Also just to emphasise this noise versus signal idea.
Here is the data from 1940, when the CO2 signal started to become strongly apparent, to 1977. I use Gis temp data because of course satellite data is only available from 1978.
http://woodfortrees.org/plot/gistemp/from:1940/to:1977/trend/plot/gistemp/from:1940/to:1977
Again what is the real long term signal and what is the noise?
Alan
14 October 2008 at 2:50 PM
Noise is the random variability that the system you’re not interested in is putting on the signal.
E.g. if you’re trying to listen to someone talking, the engine is making noise.
However, if you want to find out where the bite is, that “noise” IS your signal.
So anything that is of a shorter period than climate is noise.
And what period is “climate”? Well if you ONLY had temperatures to go on, and “midsummer” was the warmest day (lets ignore thermal inertia), how many years would you have to sum to find out “the day of midsummer” to within a week? About 50?
Check it out, go back through the temperature records and see.
14 October 2008 at 3:30 PM
Alan Millar says “So what is the true signal here? The cooling periods 1978 - 1994 and 2001 to date being masked by a warming trend from 1995 -2000? Or a warming trend from 1995 - 2000 being masked by cooling trends from 1978 - 1994 and 2001 - 2009?”
One way to decide would be to compare the plausibility of the supposed mechanism behind each hypothesis. One advantage of the theory that there has been a warming trend occasionally obscured in the short term by natural variability is that we have a mechanism that explains why there should be a warming trend (CO2) and mechanisms for explaining the variability (IIRC ENSO is responsible for quite a lot of it). Can you provide a more plausible mechanism explaning a cooling trend occasionally masked by natural variation?
A long term trend (e.g. 1978-2008) is much less affected by ENSO-related natural variability, and that shows a clear warming trend
http://woodfortrees.org/graph/uah/trend/plot/uah
The fact that the observed long term trend shows warming strongly suggests that there isn’t an underlying long term cooling trend and the overall warming is unlikely to be due to natural variability.
BTW isn’t the 1940-1977 cooling is attributable to aerosols?
14 October 2008 at 3:36 PM
Re #32, Millard,
“Let us spend one day as deliberately as Nature, and not be thrown off
the track by every nutshell and mosquito’s wing that falls on the rails”.
Henry David Thoreau (1854)
http://data.giss.nasa.gov/gistemp/
14 October 2008 at 4:01 PM
Re: #32 and #33 (Alan Millar)
You’ve illustrated, far better than I could, just how naively some people approach trend analysis.
You say “The cooling periods 1978 - 1994 and 2001 to date…” Did you actually bother to do any analysis? What’s next? Will you tout the “cooling period from 8:15 am to 8:23 am”?
To answer your question: it can’t be called “true signal” if it fails statistical significance tests.
Here’s a question for you: if 1978-1994 and 2001-present are “cooling periods,” then what are the rates of cooling, AND what are the uncertainties (confidence intervals) associated with those rates? Be careful: I’m not the only professional statistician who comes around here, and you can bet we’ll all be checking your work.
14 October 2008 at 4:37 PM
Just thinking on trends.
Last year a friend of mine, who is a skeptic, proposed that the loss of arctic ice was just part of a 20 cycle. So, I asked him when was the last time that the NW passage was fully navigatable? I think it was more than 20 years ago.
Permafrost is melting; the timing of animal migrations is changing; and a host of other things that have great inherent stability are changing. I was wondering how much more energy there must be in the arctic to melt so many more cubic miles of ice. It can be estimated, but suffice to say it is a lot. Why does anyone cling to data sets that are open to interpretation to refute the basic trends that are so readily observable?
14 October 2008 at 6:15 PM
“BTW isn’t the 1940-1977 cooling is attributable to aerosols?” (Gavin, no not that one, a different one)
Well there is conjecture that that is so (unproven but). If that is a fact, what trend is it actually masking?
There was a long term warming trend upto 1940 that did not seem connected to any man made CO2 emissions.
http://woodfortrees.org/plot/hadcrut3gl/from:1880/to:1940/trend/plot/hadcrut3gl/from:1880/to:1940
If the aerosols were, subsequently masking this, apparently natural, trend of recovery from the LIA then continuing that underlying trend to the present time would account for most of the subsequent observed warming and leave only a small amount due to mans CO2 emissions.Indicating a much lower sensitivity to CO2 than the models hypothesise. This seems a perfectly reasonable supposition.
It seems a hell of a coincidence to me that this long term natural trend should cease at precisely the moment aerosols become a factor and man made CO2 start to drive the long term climate. But that is what we are required to believe if we are to see the models hit their targets.
I don’t believe that the Earths climate is cooling most indicators say otherwise. What I find hard to believe is the hypothesised rate of change forecast by the models and that the Earths climate is mainly driven by three or more factors ie CO2, CO2, and CO2!
Alan
14 October 2008 at 6:28 PM
Alan Millar, did you never take a course in data analysis? The “signal” is the portion of the measurement, you are interested in, while the “noise” is that which interferes with your observing the signal. In this case, the theory predicts a “warming” signal, and the data confirm this to high confidence.
You are welcome to try and see how it does with a “cooling” signal, although I expect you will have trouble finding supporting data with out cherrypicking it. Here’s a clue. “Climate” is very noisy on short timescales. Measurement errors across satellite systems increase both noise and systematic error. (Note: A couple of colleague of mine has direct experience with this in reconstructing galactic cosmic ray measurements and plasma fluxes far from Earth–no one satellite has produced enough data for a decent model, and yet there are little problems going from one dataset to another.) Best advice, though: Learn the physics and you’ll understand your signals and noise much better. CO2’s effects last for decades to centuries–it’s a trend that’s pretty easy to spot.
14 October 2008 at 7:05 PM
Re: #31 (Lennart)
See this for a closer look at Lomborg’s “statistics.”
14 October 2008 at 7:36 PM
Ray Ladbury says that the theory predicts a warming signal and the data confirms this to high confidence.
It seems a bit odd that no warming trend at all this decade is confirming to high confidence a warming trend. Imagine how confident he would be if temperatures were actually going up rather than down on GISS since Jan 2001.
14 October 2008 at 8:02 PM
Gavin, Ray, Tamino.
I have already answered but my post has disappeared! I will try again to see if my post can beat the censorship on here and whether true discussion is allowed.
“BTW isn’t the 1940-1977 cooling is attributable to aerosols?”
It is conjectured that this is so. It is not proven but assuming that it is a fact what trend is it actually masking?
This is the long term trend upto 1940 when it is hypothesised that aerosols started to become a significant masking factor.
http://woodfortrees.org/plot/hadcrut3gl/from:1880/to:1940/trend/plot/hadcrut3gl/from:1880/to:1940
Now if you extrapolate this, long standing underlying but masked natural trend, visible from the Earths recovery from the the LIA, to the present date it explains most of the observed warming. It leaves only a fairly small amount of warming attributable to CO2 emissions and therefore indicates a low sensitivity to increased atmospheric CO2.
This seems an entirely reasonable conjecture. If this is not so then one has to assume that this longstanding natural trend came to a complete halt at precisely the same moment that aerosols became a factor and that man made CO2 started to drive the Earths long term climate.
Unless one can produce an accurate model of the Earths climate and I admit I cannot, how do you prove this with any degree of confidence? ( I take comfort in the fact that no one else can either ) Even if I understood completely and could hypothesise the effect of the huge number of factors and correlations and feedback mechanisms that drive the climate I would not have accurate measurements over any significant timescale to prove this. Technolgical man has not been around long enough to measure these things. I would guess that we would have to be present and measuring over a couple of glacial and inter-glacial periods to have great confidence in any models.
Of course we are talking 100s of thousands of years for this to happen, a small period indeed when we are talking about the Earths climate but daunting if you are looking for a rush to judgement.
So do I think the Earth is on cooling trend? No, I think most indicators suggest a moderate medium term warming trend that started well before any significant man made CO2 emissions and continues to this date.
Alan
14 October 2008 at 8:28 PM
Not all people have easy access to a university library, or even a library of any description. Even when I lived in a major city, it was not easy to get to the university library, but now my nearest physics library is an 8-hour drive away. The closest public library is a little over 3 hours away, in a different jurisdiction so I am unable to borrow books or use interlibrary loa^n. (The ^ is to defeat the spam detector).
14 October 2008 at 8:48 PM
@ Tamino
What are you talking about ?? Confidence intervals are estimate intervals of a true endpoint, which could be human population parameters, distance to the moon or temperature trends. You don’t apply confidence intervals on the true endpoint but on proxies or measures to estimate the true endpoint. A - 0.1 temp trend from 2001 to 2008 is a -0.1 temp trend from 2001 to 2008 - period. There are NO confidence intervals. It is the true final endpoint, if you define it that way. You may argue that a short-term trend from 2001- 2008 is not a proper TRUE endpoint. Fine. You may then apply statistics (but which ones ??? good luck) to determine the confidence intervals to estimate the TRUE endpoint. But tell us - what is the TRUE endpoint ? Temperature trend from 1980 to 2030 ? From 2000 to 2099 ? Up to you to cherry pick but PELEASE DO NOT apply confidence intervals on the true endpoint.
14 October 2008 at 8:50 PM
Re: #37 (Tamino)
What would you say is the minimal period of time that one should use to ensure that it contains a “signal” (and not just noise). What is the formal statistical method that one would use to ensure that the time frame is long enough?
Thanks.
14 October 2008 at 9:21 PM
To Figen Mekik,
My apologies for not understanding your meaning. It was just the part about “While that may have been appropriate in this case in hindsight” that worried me. I thought that the statement implied that you approved of elimination on the basis of the authorship.
I apologise for getting it wrong in this case.
Regards
14 October 2008 at 10:27 PM
Richard, no worries at all.
14 October 2008 at 11:03 PM
Raobcore different versions giving different results is quite confusing for me.. From what I gather, Raobcore 1.4 should be considered the better most perfect version, if so, why show the older ones?
I suggest a flaw in analysis which is the apparent segmentation of the Upper Air profile, in the Arctic, the real action is happening between 1000 and 650 mb, segmenting upper air levels 850,700, and 500 mb reduces resolution and misses some real important air volumes at higher pressures, where anything can happen between 1000 and 850, 850 and 750 mb etc… Raobcore profile looks a little unrealistic, and it is likely that the models are more correct for the lower troposphere than Raobcore.
However, its very curious, oblate sun refraction method agrees with Raobcore calculated trends at the same location, which is for a warmer lower troposphere at virtually every year, but not with the actual radiosonde measurements varying a lot, which is strange…… This leads me to conclude that Raobcore resolution needs to be increased… But this depends on whether my interpretation of Raobcore is right, which is the most accurate, corrected perfect data available.
15 October 2008 at 2:01 AM
As a lurker, it seems to me that Allan Millar makes a good point. Most models seem to have a very large margin of error, so that almost any recent temperature result can be said to fall within the M of E and validate the model. It is therefore difficult to ‘disprove’ the theory. But the basing of the AGW theory upon a short warming trend 1995-2000 seems to be a stretch if you can (I think reasonably) argue that the facts can also support a contrary view. It comes down to \We have a theory of what causes the warming and you don’t - So we’re right and you’re wrong.\ Why are \deniers\ castigated for saying \We don’t know what causes the warming\ when the AGW theory cannot explain what initiates the warming that CO2 exacerbates?
15 October 2008 at 3:57 AM
Alan Millar Says: ““BTW isn’t the 1940-1977 cooling is attributable to aerosols?” (Gavin, no not that one, a different one)
Well there is conjecture that that is so (unproven but). If that is a fact, what trend is it actually masking?”
As I said in my earlier post, you need to look at the plausibility of the mechanism underlying each hypothesis to decide. If you can provide a plausible mechanism for long term cooling or switching between warming and cooling phases then go ahead and we can discuss their merits relative to the existing explanations (contained for instance in the IPCC reports), which IIRC suggest warming in the first part of the 20th century due to solar forcing, warming due to greenhouse gas since approx 1970 and a plateau in the middle due to aerosols.
BTW it is rather doubtful that any hypothesis can be unequivocally proven based solely on observationsal data (only refuted). If you are willing to dismiss an explanation as being unproven conjecture then there is very little that you will be willing to accept on either side of the debate if you are to remain consistent!
15 October 2008 at 4:35 AM
Re: #41 (Tamino)
Thanks for explaining part of the story. I can’t really judge how correct your explanation is, although it seems plausible to me, but maybe more knowledgable people can comment? Also the question about Lomborg’s sea level statements still stands. I read Lomborg’s book Cool Climate and think he’s very selective and doesn’t take extreme risks into account, but he’s sort of smart and influential people (can) use him to postpone radical climate policies endlessly. So it seems important to keep following his ‘arguments’ closely and to correct him where he’s wrong.
15 October 2008 at 4:37 AM
Hi Gavin
In the figure of your factsheet, why did you compare SST and LT tropical temperatures?
Why not to account a mix of SST and land temperatures to compare it to LT temperature?
I don’t think it’s very important because there is a high proportion of ocean’s area, but I think it’s worrying because, in principle, the trend of land temperatures is higner than SST’s trend.
15 October 2008 at 5:56 AM
Alan Millar writes:
It’s a technical term in information theory. A communication is made up of noise and signal.
The World Meteorological Organization defines a climate as mean regional or global weather over a period of 30 years or more. The periods you are mentioning are considerably less than that, thus more likely to represent noise than signal.
What in the world are you talking about? More CO2 in the air leads to greater forcing, not less.
It’s true that the response is not linear. It’s not true that a linear response would have led to a runaway greenhouse effect. Do you understand what a “runaway greenhouse effect” actually is?
Extrapolating from trends, I guess.
15 October 2008 at 5:59 AM
Anyone who thinks the climate hasn’t warmed significantly since 1978, as several of comments on this blog imply, hasn’t been outside enough. If you’re trapped in the office and haven’t had any direct observations of nature in the last 30 years ask someone who has. Talk to a local forester or farmer who has been “in the field” for a couple of decades. They can add to your knowledge base considerably.
15 October 2008 at 6:00 AM
Alan Millar writes:
Do you know what a straw man argument is? No climate scientist has ever said CO2 was the only influence on climate. Where are you getting your information? I’m guessing denialist web sites. It certainly isn’t anything you’d get from a climatology textbook.
15 October 2008 at 6:03 AM
Patrick Hadley writes:
How many times does this urban legend need to be refuted?
There is not a recent period of “no warming.” Eliminate the spaces and look here:
http://www.g e o c i t i e s.com/bpl1960/Ball.html
http://www.g e o c i t i e s.com/bpl1960/Reber.html
15 October 2008 at 6:46 AM
RE: #25
The results (surely worth a glance) reflect all known temperature perturbations, including the 1988 peak. They are published and plotted every month, (Google Global Warming at a Glance), and overlaid onto the GISS surface data on which Anthony Watts (Watts up with That) labours so strenuously.
Global Warming at a Glance takes you to JunkScience.com. Oh, my, what junk it is!
They make the reader compare an anomaly of satellite observations with base value 1978-2008 (?, they just say ‘average’) with a surface temperature anomaly of GISS with base value 1951-1980!
No wonder the values differ.
15 October 2008 at 7:26 AM
50 Bobzorunkle falls for the fallacy that the warming trend is short.
Uh, Bob, look at this graph:
http://www.globalwarmingart.com/wiki/Image:Instrumental_Temperature_Record_png
Now, what I see is a pretty consistent trend of warming from about 1900 through the present. Yes, there are drops and rises, but the thing about climate–and especially CO2’s influence on climate–is that the longer the time series, the more it is evident.
Now look at this one:
http://www.globalwarmingart.com/wiki/Image:Instrumental_Temperature_Record_png
Doesn’t the 20th century look a bit anomalous to you? What Alan Millar has is a conservative talking point–if you chop up the temperature record into tiny little bits and don’t look at the whole thing, it doesn’t look so scary.
15 October 2008 at 7:48 AM
Alan Millar posits a “natural trend” is responsible for climate change. So, Alan, how does this “natural trend” create energy and can we harvest it to solve all of our energy needs. Moreover, look closely at your temperature graph–the first half shows no warming. What is more, if you extrapolate to the left and right, the dichotomy between 18th and 19th centuries becomes more dramatic.
http://www.globalwarmingart.com/wiki/Image:Instrumental_Temperature_Record_png
Now, since the LIA was an 17th-18th century phenomenon wouldn’t you expect “recovery” to be most rapid early and not to accelerate the further away we get? I anxiously await your resolution of this little problem with your theory, as well as the amazing new discovery of how to create energy you posit.
15 October 2008 at 8:48 AM
#59
Ray, the problem here is that the first half of the century is attributed to natural causes, the second half to CO2. Why is this a problem? Well, we hear that the 1980-present warming is “unprecedented” when in fact it’s very close to the warming from 1910-1940, which supposedly is natural. This is easily verified if you use the HadCRU data. So how can this be “unprecedented” when it’s happened before?
Also, what drove the warming during 1910-1940? The sun? Not according to Leif Svalgaard. He has theorized that TSI has had no appreciable change since the 1700s. If he’s correct, then our understanding of the role in TSI on climate is fundamentally flawed.
One of the main areas where analyses gets into trouble is in not understanding our assumptions. We assume 1950-1980 was driven by aerosols. we don’t “know”. We assume the natural phenomenon are well understood, we don’t “know”. Each of these assumptions carries with it a likelihood of being correct. As an example of this, we do have a pretty good understanding of how large volcanic eruptions affect global temperatures.
Another example, no climate model predicted the melt-off of the arctic last year. not a single one. Even if we assume AGW had an impact, it would not have melted so much of the arctic. Therefore, something “natural” overcame/supplemented the warming and caused the ice to melt. What was this natural cause?
Also, on the subject of noise: How can the short term variations in temperature be considered “noise”? Noise has no impact on the overall trend (it averages out to zero over long time frames). In this case, however, variations in temperature when averaged ARE variations in climate! To say that variations in temperature is purely noise is to de-link temperature from climate. You can assume it’s noise and show that the variation isn’t out of the typical range of the noise (Tamino has done just this on his blog), but you cannot claim for certain that the variation IS noise. You can gain confidence in trying to rule out other causes, but again, that’s only as good as your knowledge of said causes.
As Jimmy Buffett says, “don’t ever forget that you just may wind up being wrong”.
15 October 2008 at 10:36 AM
ENSO indexes suggest:
La Nina drove the cool 1950s - mid 1970s.
El Nino drove the warm and humid mid 1930s - 1940s.
–
What drove the warm and dry dust bowl years in early 1930s?
But what drove the warming during 1910-1940?
15 October 2008 at 10:51 AM
#61:
Another example, no climate model predicted the melt-off of the arctic last year. not a single one.
Pray tell, what climate model would be used to make a point prediction about the near future? I work with the CCSM, and I can’t imagine using it to make a short-term prediction about a seasonal fluctuation in a parameter such as Arctic ice.
Now, if what you really mean is that the models used to predict ice-sheet fluctuations were off, then we can start talking from there. The simple answer is that the anomalous melt last year can be attributed to weather conditions that tended to amplify melt. It was sort of a “perfect storm” convergence of parameters which amplified melt - a relatively warm season, coupled with wind patterns which tended to push ice into warmer waters, increasing the probability that it would melt.
I don’t think anyone here will defend the models as “perfect.” If they were perfect, then some of us would be out of jobs, because there wouldn’t be any work to be done on them. Instead, models are just as their name implies. They’re useful tools which do a large number of calculations for us. There are bound to be uncertainties and poor parameterizations in them; however, as time goes on, we are ironing out those deficiencies intrinsic to the model or developing the understanding necessary to cut them out as smoothly as possible.
Last year’s melt isn’t some death-blow to the idea of modeling, particularly because there is an accepted hypothesis (the pro-icemelt weather conditions) which supplements the model predictions to explain what we observed.
15 October 2008 at 10:59 AM
#59 - Thanks Ray, but the graph suggests to me a 100 year cycle where temperature anomolies were 0.2 to 0.4 degrees below (whatever the baseline was) for the 100 years from 1850 to 1975 and then perhaps a new cycle where the anomolies flip to 0.2 to 0.4 above. And since this graph is based upon the instrumental temps, the recent warm anomolies would be even smaller if the graph used the satellite temps and were continued to 2008. I’m not denying there has been warming - just saying that instead of closing our minds in favor of the AGW/CO2 arguments, there could be other “natural” factors we haven’t yet properly assessed.
15 October 2008 at 11:01 AM
I can’t see anything wrong or implausible with Allan MiIlar’s suggestion #39 that we are riding on a long term natural warming trend as we are coming out of the LIA, a trend temporarily interrupted in the period 1945-1975 due to aerosols and slightly accelerated by CO2 emissions (but with far less climate sensitivity than assumed) thereafter. Indeed, as long as we are not able to pinpoint the cause of the warming between 1910 and 1945 it is quite conceivable that this natural trend continues to play a role in today’s climate change/global warming.
15 October 2008 at 11:05 AM
Dean, your attribution of early 20th century warming to natural forcers is false. Look at this graphic:
http://www.globalwarmingart.com/wiki/Image:Climate_Change_Attribution_png
Yes, insolation did increase about 1900. However greenhouse gasses also play an increasing role that runs a close second to insolation. It is only in about 1960 that ghgs predominate, but to dismiss them entirely is inappropriate. In any case to average across the boundary of the 19th/20th centuries is incorrect, as there is clearly a change in the importance of the forcers in the middle of this period.
Your contention on noise doesn’t make sense, it is only by averaging over short-term variations that the long-term trend (climate) emerges. Of course you can’t say whether any short-term trend is only noise–that’s because it’s a short-term trend! And again, what do you propose as a “cause”. Climate science has a model that explains most of the observed trends (real trends, not short-term variation masquerading in the fevered denialist mind as a trend) quite well. The denialists have bupkis, which, incidentally is why they don’t publish.
15 October 2008 at 11:38 AM
Alan (32), a minor (??) clarification. Forcing from increased CO2 is greater than a linear response.
[Response: No it isn’t. It’s logarithmic which goes up much more slowly than linear. - gavin]
15 October 2008 at 11:38 AM
From around 1940 to 1975 there was a period of about 35 years with no long term warming trend. In 1975 a strong warming trend began and in 1988 James Hansen went to Congress and made a big deal about a warming period of just 13 years. If you read his talk you will see he talked about the statistical significance of the near 0.4C anomaly of a period of just one year. I cannot find any contemporary reports of climate scientists condemning him for make long term conclusions about climate change based on a warming period of just 13 years.
15 October 2008 at 11:59 AM
> no single model
Except several. Look up Dr. Bitz’s more recent work in Google Scholar after reviewing the older topic here:
www.realclimate.org/index.php/archives/2007/01/arctic-sea-ice-decline-in-the-21st-century/
15 October 2008 at 12:03 PM
Mike (55), that’s the Ted Turner school of analysis: “Have you been outside today? It’s hotter than hell out there!”, which I find totally unconvincing.
15 October 2008 at 12:20 PM
Gavin (re 57), I think that is incorrect. I don’t recall the exact figure but the increase is not just logarithmic but 4-5 times the ln of the concentration ratio (or the ln of the ratio to the 4th or 5th power) which increases much faster (initially) than linear until you get to a concentration ration of 10-15. Is this not accurate?
[Response: The forcing is ~ 5.35 log(CO2/CO2_orig). If you linearise at today’s concentration, the forcing would be approximated by 0.014*(delta CO2). So at 560ppmv it would be an increase of 2.52 W/m2. But actually the additional forcing is 2.07 W/m2 - i.e. less. Therefore forcing goes up less than linearly. - gavin]
15 October 2008 at 12:50 PM
Dean, et al,
I’m not following your logic. The modelers have indicated the climate is heading in a certain direction, based on increases in CO2 and other factors. Some sample data indicate we might be further in that direction than the modelers have estimated, and you use that as evidence to reject the prediction of what direction we are heading, or what is causing the movement?
15 October 2008 at 1:05 PM
Bobzorunkle says “I’m not denying there has been warming - just saying that instead of closing our minds in favor of the AGW/CO2 arguments, there could be other “natural” factors we haven’t yet properly assessed.”
Gee, Bob, and what might those “natural” factors be?
[cricket’s chirping]
Nothing? It’s OK, nobody else has come up with anything concrete and credible either. OK, how about we do science instead. You know, make a hypothesis and then look and see if the data support it. Climate science has done that, and the data are pretty darned supportive of anthropogenic causation. We’re waiting for alternative hypothesis.
Patrick Hadley–Nobody condemed Hansen because he was doing SCIENCE. You know, looking at trends since the dawn of the industrial age, seeing if they were consistent with his models, and finding that both those and the modern data (however limited) were consistent, he made a prediction. Anybody else you know of got a proven 20 year track record of climate prediction?
15 October 2008 at 1:30 PM
Re Patrick Hadley @68: “From around 1940 to 1975 there was a period of about 35 years with no long term warming trend.”
False. As has been discussed here repeatedly, there was a sharp drop in global mean temperatures between roughly 1945 and 1950, which was followed by a shallow warming trend until roughly 1975, when the slope of the warming trend increased sharply:
http://www.globalwarmingart.com/wiki/Image:Instrumental_Temperature_Record_png
Why rely on faulty analysis or repeat deliberate disinformation when the facts are readily available?
15 October 2008 at 1:34 PM
Or (re #73) the natural factor is our natural ability to think of how to burn oil and CO2’s natural ability to cause GW.
15 October 2008 at 1:37 PM
Re Ray Ladbury @73: “Gee, Bob, and what might those “natural” factors be?”
And Bob, don’t forget to explain just how these natural factors would negate the known and demonstrated radiative physics of greenhouse gases.
15 October 2008 at 2:47 PM
Gavin (re 71), maybe I’m not grasping the linearization part. What is the formula that arrives at F = 0.014*(deltaCO2)? i.e: how is the 0.014 derived? are the units of delta_CO2 raw ppmv? is F in watts/meter^2? I was using straight linear math as in when X doubles, so does Y, but it now occurs to me this gives me a big units problem. Similarly, where does the 5.35 come from, mathematical formula or laboratory observation? I assume the units of the “5.35″ number must be watts/meter^2; how does that happen?
0.014*280 = 3.92 (280 is delta_CO2 = 560 - 280);
5.35Ln(2) = 3.71.
Where am I going wrong here?
Thanks for any help.
[Response: This stuff is not hard to find. the formula F=5.35*log(CO2/CO2_orig) comes from a fit to line-by-line calculations in Myrhe et al (1998). If you linearise at 380 ppm (noting the d(log(C))/dC=1/C), the linear formula is F=(5.35/380)*(CO2-380). Plug in 560ppmv to get what I said above and compare with the full formula. Whatever value you pick, the log formula is always smaller than the linear one. - gavin]
15 October 2008 at 3:54 PM
#57 Barton Paul Levenson
“How many times does this urban legend need to be refuted?
There is not a recent period of “no warming.” Eliminate the spaces and look here: …..”
I agree that the lack of warming since 1998 is often over-emphasised. However, those who mention it do have a point. Here’s one way to rationalise it:
(Temperatures from Hadley http://www.cru.uea.ac.uk/cru/data/temperature/hadcrut3gl.txt )
By 1990 the global temperature anomaly had already reached +0.25C in an ENSO-neutral year (average ONI ~ +0.25, threshold required for weak El Nino = +0.5) http://www.cgd.ucar.edu/cas/ENSO/enso25.jpg )
Also the AMO was starting to switch to positive phase, just as it did in the late 1920s incidentally:
http://en.wikipedia.org/wiki/Image:Amo_timeseries_1856-present.svg
In the first 7 months of 1991 the temperature anomaly was +0.26C, and a strong El Nino was in the pipeline, later to peak in 1992. We will never know how warm temperatures *should* have got by 1995, when ONI finally went below -0.1 for the first time since 1989….. +0.45C perhaps? - see later…
Instead Mt Pinatubo erupted in summer 1991, and global temperatures were lowered as a result for several years.
Finally the knock-on effects wore off and a return to a particularly strong El Nino culminated in the record global temperatures of 1998. Let’s note the average global temperature in the 2-year period 1997-1998: +0.45C.
Then we had 2 years of La Nina, keeping temperatures down at +0.28C for the period 1999-2000.
From second half of 2001 to first half of 2007
(see also http://www.cgd.ucar.edu/cas/ENSO/enso26.jpg )
ONI showed only El Nino (weak to moderate) or neutral (apart from 3 months where it crossed the threshold into weak La Nina Dec 05 to Feb 06). Thus global temperature anomalies not surprisingly went higher again: +0.44C for the period 2001-7, slightly below the +0.45C noted earlier for the period 1997-8.
Therefore, I think it would be reasonable to suggest that the underlying trend without Pinatubo was a rapid warming in the 1990s from 0.25C in 1990 to ~0.45C by 2000, then a levelling off where the 1997-8 average was never substantially eclipsed (highest was +0.48C in 2005), even with years of broadly ENSO-positive conditions and no massive volcano-induced cooling earlier in the decade (unlike in the 1980s and 1990s).
Unlike others, I’m not saying that because of all this, “global warming stopped in 1998 therefore CO2 has little effect”. All I’m saying is that it’s a reasonable way of looking at the facts, and trying too strenously to refute it is perhaps not the best way to convert reasonable newbies to the subject to consensus views on global warming.
Also according to HadCrut, we’ve seen a global increase in temperature of ~0.4C from the peak of the early 1940s (last time strongly +ve AMO and PDO http://en.wikipedia.org/wiki/Image:Pdoindex_1900-2006.gif coincided) to the recent peak. If I’m correct in saying that the bulk of that increase was up to the late 90s, and *should* have been by the mid-90s or even earlier, then this leaves a tiny bit more room for changes in solar forcing - since it’s only after the solar max of the early 90s that the trend in solar activity from 1940 took a dive http://en.wikipedia.org/wiki/Image:Temp-sunspot-co2.svg#file. Let’s take a conservative +0.1C for solar forcing. This leaves 0.3C to be explained by natural variation in 50 years. Urban heat effects? Conservative +0.1C beyond what is already factored into the temperature series/models? That leaves about 0.2C for CO2. For the sake of argument.
I think what happens in the next few years could be very telling. At the moment, I genuinely don’t know how to call it. But with every year that the global temperature fails to break new ground (say +0.50 on the Hadley measure) the more receptive I will be to arguments for lower-than-consensus climate sensitivities.
Note: please don’t people accuse me of not seeing the wood for the trees. I got that in spades on the sea ice thread when I argued that 2008 was not on a surefire course to surpass 2007’s record, and rather was likely set for an earlier and stronger recovery - yet I was correct (and incidentally ice extent is now ~1.5 million km2 more than a year ago.)
15 October 2008 at 5:58 PM
OT: This interesting new paper (public access) claims to have found evidence for significant atmospheric CO2 fluctuations from 1000 to 1500 CE (and so including the MWP). They think the scale of these changes is enough to account for some of the climate change previously ascribed to solar and volcanic forcings (although note that the recent trend of the science has been to heavily discount the importance of solar forcing for that period), and that ocean changes drove the CO2 since there is a correlation with North Atlantic SSTs. (IIRC at least one of these authors [Wagner] has done some past similar work that used the same proxy [leaf stomata] to draw some conclusions that turned out to be unreasonable.)
15 October 2008 at 6:29 PM
> I argued that 2008 was not on a surefire course
> to surpass 2007’s record
So did Connolley. So did others. It’s not the ideas, it’s the verbose argumentative confusing presentation.
15 October 2008 at 6:37 PM
I note that even though the 2007/8 La Nina was (at least judging by ONI data) not as deep or certainly nearly as long as the 1999/2000 back-to-back La Nina, the three-month-average tropical LT temperature anomaly dipped even lower in 2008, to -0.54C (Mar-May) which was lower than at any time during the satellite era, apart from during the strongest La Nina of the era i.e. 1988/1989. The recent tropical LT anomalies have been way below the surface temperature as far as I can tell, and thus ought to bring down the tropical tropospheric temperature trend relative to the surface.
http://vortex.nsstc.uah.edu/data/msu/t2lt/uahncdc.lt
15 October 2008 at 7:24 PM
#73 - “Gee, Bob, and what might those “natural” factors be?”
I am not a climate scientist so I don’t have a clue. All I know is that, as I said in my first post, it doesn’t help for AGW theorists to keep saying “We’ve got a theory and you don’t, so we’re right and you’re wrong.”
In the past, various theories were put forward on the causes of earthquakes: the Gods are angry; herd of elephants; meteors striking the earth; volcano activity; plate tectonics; elastic rebound theory; etc., etc.. At any given point in time, a theory was accepted by a consensus - until new information came to light. Just because the volcanic activity theory contained some “science”, did not make it correct. Similarly, just because the CO2 theory is based on valid science, it may not correctly explain the cause of the recent warming. A new theory may well come along which supplants CO2 as the most important cause in warming of the planet. It does not make sense to bend ourselves out of shape trying to justify a theory if the facts don’t fit. If the current models didn’t predict the levelling off of the warming, or the unusual melting of the arctic icecap, then shouldn’t a reasonable scientist acknowledge that the confidence in those models should decline? Even a little bit?
15 October 2008 at 10:36 PM
Re #78: “Urban heat effects? Conservative +0.1C beyond what is already factored into the temperature series/models?” Tch.
Unscientific guesswork about short-term trends is boring unless you’re willing to bet on it. I believe there are still open offers on that here and here. If you just want to speculate, the Watts Up With That blog would be a better place.
15 October 2008 at 10:36 PM
78 Chris said, ” I argued that 2008 was not on a surefire course to surpass 2007’s record”
Arctic sea ice set a new record low in 2008. Ice has three dimensions, not two. Extent is an improper metric, especially since thickness is far more important than either of the other two dimensions. Thickness is inversely proportional to salt content, so it trumps all. 2008 set a new record for thinness, and also for lowest volume. Extent is a red herring which has been reported ONLY because it used to be difficult to measure thickness and volume. (NSIDC says that is changing right now)
http://nsidc.org/images/arcticseaicenews/20080924_Figure3.jpg
Age is an excellent proxy for thickness and inverse salt content. First year ice is almost irrelevant - movie set ice is a good description, while older ice tells the tale. Even with a cold winter and cool summer, arctic ice STILL declined to a new record low. Age^2 * extent is a reasonable first order approximation, at least for the first 3 years. After that, the increase gets more linear. Note that 2007 was mostly >2nd year ice, while 2008 was mostly 1st year ice.
16 October 2008 at 12:46 AM
RichardC’s point about the ice volume reaching a new minimum is worth repeating. It’s also true that this summer saw the most rapid rates of ice retreat yet:
“Arctic Saw Fastest August Sea Ice Retreat On Record, NASA Data Show”
ScienceDaily Sep. 28, 2008
Recall also that the record low area coverage last summer was also due to the wind / ocean circulation pattern at the time. This was used by some bloggers to claim that “wind was responsible”, but if climate skeptics are known for anything, it’s for oversimplifying complex issues.
Thinner, young sea ice is more susceptible to being compressed by wind than is older, thicker sea ice. The discussion of the role wind played in the record 2007 low is here:
http://www.nasa.gov/vision/earth/lookingatearth/quikscat-20071001.html
This kind of complex interaction should be expected - relative to the larger question of arctic warming and land-sea temperature trends, such complexities create “noise” - even though the so-called noise is itself of interest and is not all random. Like many other climate issues, the complexity lies in the interaction between the atmospheric and oceanic systems.
It is harder to measure ice volume, but this year was probably also a record low for sea ice:
http://www.sciencedaily.com/releases/2008/10/081002172436.htm
Given that Arctic warming is predicted to lead other signs of global warming, what are other regional indicators?
1) 99% of Alaskan glaciers are retreating or stagnating - Yes, a few have seen record snowfalls, but those are in Pacific coastal regions, where more moisture is evaporating off the Pacific, which is also in line with predictions about increasing water vapor, the main feedback-forced component of CO2-induced warming.
2) The largest ice shelf (Ward Hunt) in the N. Hemisphere fractured again this past year. That’s after losing much of its mass in 2003. Similarly, in 2006, Ellesmere Island’s Ayles ice shelf collapsed. Warming ocean and atmospheric temperatures appear to be why these shelves are steadily collapsing. Again, this is due to a complex interaction of factors:
3) You also have the warming ocean and atmosphere around Greenland, and the faster-than-predicted glacial outflow there. Last time CO2 levels were near today’s, Greenland was mostly ice-free. In several hundred or a thousand years, we should expect those conditions to return.
4) The permafrost, like the ice shelves, is buffered from temperature changes by arctic sea ice. As the ice goes, ocean warming will have a larger effect inland, leading to faster permafrost melting.
So, all indicators are that Arctic warming is proceeding as predicted, only somewhat faster than the climate models suggested. The faster we add fossil CO2 to the atmosphere, the faster the warming will proceed.
16 October 2008 at 3:10 AM
bobzorunkle writes:
What are you talking about? Are you talking about a natural deglaciation? We know what causes that — changes in the distribution of sunlight over Earth’s surface. Google “Milankovic cycles.” That isn’t what’s happening now.
16 October 2008 at 3:15 AM
Chris Schoneveld writes:
What is the mechanism which causes “coming out of the LIA?” Where is the energy coming from? How does it work?
16 October 2008 at 3:20 AM
chris writes:
No. It isn’t reasonable to believe something that is demonstrably wrong. Did you look at the links I provided?
16 October 2008 at 3:28 AM
#80 Hank Roberts: “So did Connolley. So did others.”
You’re confusing the issue. It was when the ice extent trend was pointing steeply downwards in early Sep that I was the only one on North Pole Notes to argue it would turn around quickly (you’re implying to people that I was instead talking about pre-season projections.)
At least you’re concise, accusing me of “verbose argumentative confusing presentation”. I can also do concise: you’re wrong, and are gratuitous in your use of unhelpful, dismissive and hypocritical adjectives.
#83 Steve Bloom. “Unscientific guesswork about short-term trends is boring unless you’re willing to bet on it.” Your comment does not connect with your quote from my post. Attributing 0.1C of the surface record increase to urban heat effects (from micro to macro) in 50-60 years is scientifically justifiable without guesswork, and does not refer to a short-term trend. I’m sorry if it’s boring - only as boring perhaps as unscientific guesswork about the extent of aerosol-induced cooling post-1940s perhaps, which many are more than happy to indulge in. (Note: I’m not saying that UH necessarily had the effect suggested, or that aerosols haven’t had a significant effect, before those skimming my words jump into attack autopilot.)
#84 RichardC. Should really take this to North Pole Notes. Volume has the virtues of (1) still being very hard to measure despite what you say
http://scienceblogs.com/stoat/2008/10/sea_ice_thinner.php
and (2) being the most lagged indicator of all of NH warmth i.e. it should be the last indicator to turn around in any longer-term Arctic ice recovery.
Remember that on the map you link to, despite the distracting psychadelic colours, in fact ALL the ice on the RH side will start 2009 as multiyear ice according to the NSIDC’s definition:
http://nsidc.org/cgi-bin/words/word.pl?multiyear%20ice
And if there’s less 4/6+ year old ice? Why do you think the average sea ice thickness in the Arctic never got far above 3m in the twentieth century? (And the average age of all ice never got above single digits) Because most of the thickness increases come in the first couple of years, and most old ice is “old” because it is nearing the end of its natural cycle (where it thins to zero.)
16 October 2008 at 6:37 AM
Chris your comparison of temp and specific La Nina and El Nino conditions is interesting. I agree that some of the elegance is lost in the length of the post. Temperature is not the only measure to consider in examining climate sensitivity. Sea ice extent, Greenland Ice Sheet melt extent are additional measures that are exceeding model expectations.
16 October 2008 at 7:57 AM
Bobzorunkle says: “In the past, various theories were put forward on the causes of earthquakes: the Gods are angry; herd of elephants; meteors striking the earth; volcano activity; plate tectonics; elastic rebound theory; etc., etc.. At any given point in time, a theory was accepted by a consensus - until new information came to light.”
Oh, come on. This is absolute horse puckey. Find me a peer-reviewed paper that attributes earthquakes to angry Gods! At least do us the courtesy of taking the discussion seriously and sticking to SCIENCE. And while you are at it, maybe learn the difference between climate and weather.
Pray, where are those inconvenient facts that current theory doesn’t explain. It certainly has not trouble showing that if you have a La Nina, temperatures on average will fall. As to the melting of sea ice, the theory has predicted summer melt would increase on average over time. It has. Here’s a clue: It is called GLOBAL CLIMATE CHANGE for a reason–all three words are important.
16 October 2008 at 9:53 AM
Thanks Mauri, for help focusing on the interesting question in Chris’s post. Who’s working in that field, do you have pointers?
16 October 2008 at 10:25 AM
Always worth remembering the American Petroleum Institute’s Global Climate Science Communications Plan (1998):
“GCSCT members who contributed to the development of the plan are A. John Adams, John Adams Associates; Candace Crandall, Science and Environmental Policy Project; David Rothbard, Committee For A Constructive Tomorrow; Jeffrey Salmon, The Marshall Institute; Lee Garrigan, environmental issues Council; Lynn Bouchey and Myron Ebell, Frontiers of Freedom; Peter Cleary, Americans for Tax Reform; Randy Randol, Exxon Corp.; Robert Gehri, The Southern Company; Sharon Kneiss, Chevron Corp; Steve Milloy, The Advancement of Sound Science Coalition; and Joseph Walker, American Petroleum Institute.”
A few quotes…
Global Climate Science Communications Action Plan
Here, the goal is to interject doubt into the discussion. If the target was AIDS, one could point out that HIV might not really be what’s responsible - maybe it’s due to genetic factors. We know now that genetics plays a role in many diseases, and this wasn’t understood 200 years ago, so maybe HIV has nothing to do with AIDS?
This is not normal advertising or PR; this is an attempt at large-scale modification of the public perception. It’s worth noting that a well-educated and scientifically literate population is less likely to fall for the claims of tobacco science experts - unless they think they are listening to “independent objective experts.” Thus, a major aim of PR firms is to cultivate apparently independent experts who will cooperate with PR efforts. The PR firm in question that is the American Petroleum Institute’s lead is Edelman, who likely used their experience defeating “secondhand smoke” regulations as a selling point.
So, that’s the agenda of the oil and coal industry, their financial backers, their trade association, the API, and their PR firm Edelman. Edelman maintains a stable of dozens of bloggers to push their agenda on blogs, and they are the recipients of a $100 million contract from the American Petroleum Institute to “clean up the industry’s image.”
This type of blanket propaganda effort has been going on for a long time, but for some reason the U.S. press is very reluctant to write any stories about it. The memo in question list tactics such as:
Notice that the NSTA has shown up here on realclimate before in regards to their refusal to distribute free copies of “An Inconvenient Truth” to science teachers, and they’re also heavily funded by ExxonMobil.
In short, it’s a campaign of lies that targets children, among others, (sounds like tobacco, doesn’t it?) managed by Edelman and the API, all intended to sway public, media and Congressional opinion in order to prevent any laws from being passed that will reduce fossil fuel combustion.
16 October 2008 at 11:04 AM
Re bobzorunkle @82: “I am not a climate scientist so I don’t have a clue.”
Points for being honest, at least.
“just because the CO2 theory is based on valid science, it may not correctly explain the cause of the recent warming. A new theory may well come along which supplants CO2 as the most important cause in warming of the planet.”
Then again, it may not. After all, theories don’t just “come along”, they emerge from sustained study of the actual evidence. All of it.
In the meantime we know, with certainty, that increasing atmospheric CO2 will make it warmer. We also know, with certainty, that will still be the case if and when your as-yet undiscovered and unexplained “natural” factor is revealed and explained.
Why do deniers so fervently pin their hopes on as yet undiscovered and unexplained “natural” factors when reality is staring them in the face?
16 October 2008 at 2:48 PM
In #78 Chris wrote: … “But with every year that the global temperature fails to break new ground (say +0.50 on the Hadley measure) the more receptive I will be to arguments for lower-than-consensus climate sensitivities”. …
Chris, I don’t think anyone should be receptive to that, for several reasons. e.g. S.H. temperatures for Jan-Jun 2008 had marginal positive anomalies but large (.76 .85 59) positive anomalies for Jul-Sept (Sept was highest of record for S.H. according to NASA).
http://data.giss.nasa.gov/gistemp/tabledata/SH.Ts.txt
16 October 2008 at 3:20 PM
gavin, WRT to your inline comments in #2 ands #21. You indicate that volcanic forcing was included in the models used in Santer et al. Figure 3 in that paper lists the models used for the hindcast. in AR4 section 10 I believe there is a chart showing which models use which particular forcings for the 20CEN hindcast. According to that chart some of the models used by Santer ( example FGoals, but there are others) did not model historic volcanic forcing. Am I reading the Santer paper wrong or misreading the chart in AR4? So, simple question.
Did all of the models used by Santer et all include volcanic forcing or not.
[Response: No. I never said they all did. - gavin]
16 October 2008 at 4:19 PM
Barton Paul Levenson #87.
Are you suggesting that there was no such thing as a LIA (after all the hockey stick doesn’t reveal one) because we can’t come up as yet with a mechanism that could have caused it?
Maybe it was due to changes in CO2 radiative forcing (in part) since historical CO2 levels weren’t as stable as assumed by the IPCC, at least that’s what van Hoof et al. conclude from CO2 data derived from stomatal frequency analysis. Here is a link to the abstract of their paper:
http://www.pnas.org/content/105/41/15815.full
16 October 2008 at 4:50 PM
Gavin,
Sorry for the misunderstanding. You wrote:
[Response: The volcanic effects were taking into account in the models, but the precise timing of El Nino events is going to be different in each model - that in fact is a big factor in the variability of the 20 year trends. - gavin]
Perhaps you meant to say was “taken into account in some of the models,but not all” or something like that, but I apologize misreading your inline reply.
It is true, you never said “all of the models.” Given that volcanic forcing is important, recalling the role that representing volcanic forcing plays in validating GCM work, some might find it odd that models that don’t include this important forcing would be used in Santer, much less AR4. then again, maybe not. Perhaps a comparison of models using volcanic forcing versus those that don’t would be enlightening.
16 October 2008 at 5:14 PM
http://www.google.com/search?q=%2B“steven+mosher”+%2B”volcanic+forcing”
Why not summarize the answers you’ve had on similar questions and post them as an article? It’d save some retyping.
16 October 2008 at 6:16 PM
#95 Pat Neuman: “S.H. temperatures for Jan-Jun 2008 had marginal positive anomalies but large (.85 .59 .76) positive anomalies for Jul-Sept (Sept was highest of record for S.H. according to NASA).”
The land temperatures you refer to were heavily skewed by the Antarctic, where NASA GISS has very sketchy coverage, and appears to “fill in” vast areas.
For skew caused by Antarctic see:
http://tinyurl.com/4le752
and http://data.giss.nasa.gov/work/modelEt/time_series/work/tmp.4_obserTs250_1_2005_2009_1951_1980-0/map.pdf [needs rotating]
and for hint at limitations of “filling in” compare with
http://climate.uah.edu/sept2008.htm
(SH anomaly +0.10C)
Having said that, I am certainly interested as to why part of Antarctica was so warm in Sep (just as I am incidentally interested as to why much larger areas were so cold in Aug:
http://climate.uah.edu/august2008.htm )
Looking through the Antarctic station data
http://www.antarctica.ac.uk/climate/surfacetemps/
it does appear that several stations on the Antarctic Peninsula/islands to the north had a record-breaking mild September. This is interesting, don’t want to diminish from its inherent importance. However, all of the stations in the rest of Antarctica (i.e. the other ~98 per cent of its area or whatever the exact figure is) had fairly average temperatures, from what I can tell.
The same issues apply to July:
http://tinyurl.com/43kcgu (+0.85C)
http://climate.uah.edu/july2008.htm (0.00C)
Hadley’s Crutem3 SH land figures for Jul and Aug (Sep isn’t out yet) were +0.66C and +0.14C respectively, or +0.40C for the two months, compared with +0.72C for GISS. I suggest they are also skewed, but not so badly.
http://www.cru.uea.ac.uk/cru/data/temperature/crutem3sh.txt
Note that according to Crutem3, SH land temperatures in August were the coldest since 1992 and 1994 (post-Pinatubo cooling) and below the 1980s average of +0.15C. This would fit with anecdotal evidence from various countries in the SH, notably Australia (coldest August since 1944 in Sydney, for example).
UAH had Aug SH anomaly at -0.19C
http://climate.uah.edu/august2008.htm
16 October 2008 at 6:24 PM
Sorry I should have been more precise in my previous post and given UAH SH land temperature anomalies:
Jul: +0.26C
Aug: -0.56C
Sep: +0.24C
http://vortex.nsstc.uah.edu/data/msu/t2lt/uahncdc.lt
I don’t have the RSS figures to hand but they won’t be very different in any event.
16 October 2008 at 7:03 PM
Quite tangential, but maybe of interest to one of the climate scientists:
We have another ‘natural experiment’ going on, rather like the 3-day shutdown of air travel in the USA after 9/11, and like the Beijing Olympics clean-air experiment.
http://www.nakedcapitalism.com/2008/10/baltic-dry-index-falls-another-107-down.html
Total ocean shipping activity has dropped dramatically. That’s almost all fueled by high-sulfur fuel oil; shipping is known to make linear clouds along shipping tracks.
The change in ship travel ought to show up in satellite imaging, I’d think — and in anything else?
16 October 2008 at 7:39 PM
Re: the volcanic forcings. The reason I raised the issue before was that simply eyeballing