Our favorite contrarian, the potty peer Christopher Monckton has been indulging in a little aristocratic artifice again. Not one to be constrained by mere facts or observable reality, he has launched a sally against Andy Revkin for reporting the shocking news that past industry disinformation campaigns were not sincere explorations of the true uncertainties in climate science.
The letter he has written to the NY Times public editor, with its liberal sprinkling of his usual pomposity, has at its heart the following graph:

Among other issues, it is quite amusing that Monckton apparently thinks that;
- trends from January 2002 are relevant to a complaint about a story discussing a 1995 report,
- someone might be fooled by the cherry-picked January 2002 start date,
- no-one would notice that he has just made up the IPCC projection curves
The last is even more amusing because he was caught out making stuff up on a slightly different figure just a few weeks ago.
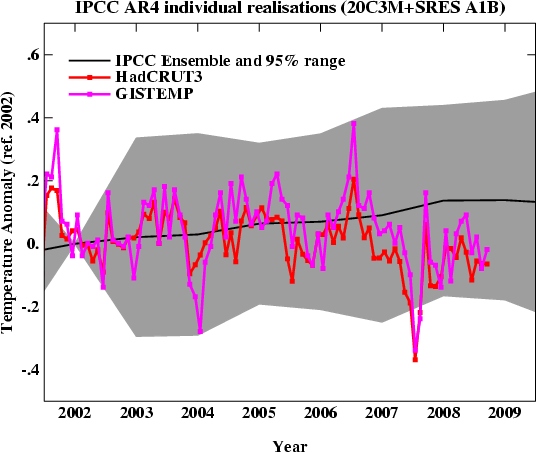
To see the extent of this chicanery, one needs only plot the actual IPCC projections against the observations. This can be done a number of ways, firstly, plotting the observational data and the models used by IPCC with a common baseline of 1980-1999 temperatures (as done in the 2007 report) (Note that the model output is for the annual mean, monthly variance would be larger):


These show clearly that 2002-2009 is way too short a period for the trends to be meaningful and that Monckton’s estimate of what the IPCC projects for the current period is woefully wrong. Not just wrong, fake.
Even if one assumes that the baseline should be the year 2002 making no allowance for internal variability (which makes no sense whatsoever), you would get the following graph:
– still nothing like Monckton showed. Instead, he appears to have derived his ‘projections’ by drawing a line from 2002 to a selection of real projections in 2100 and ignoring the fact that the actual projections accelerate as time goes on, and thus strongly over-estimating the projected changes that are expected now (see here).
Lest this be thought a mere aberration or a slip of his quill, it turns out he has previously faked the data on projections of CO2 as well. This graph is from a recent presentation of his, compared to the actual projections:
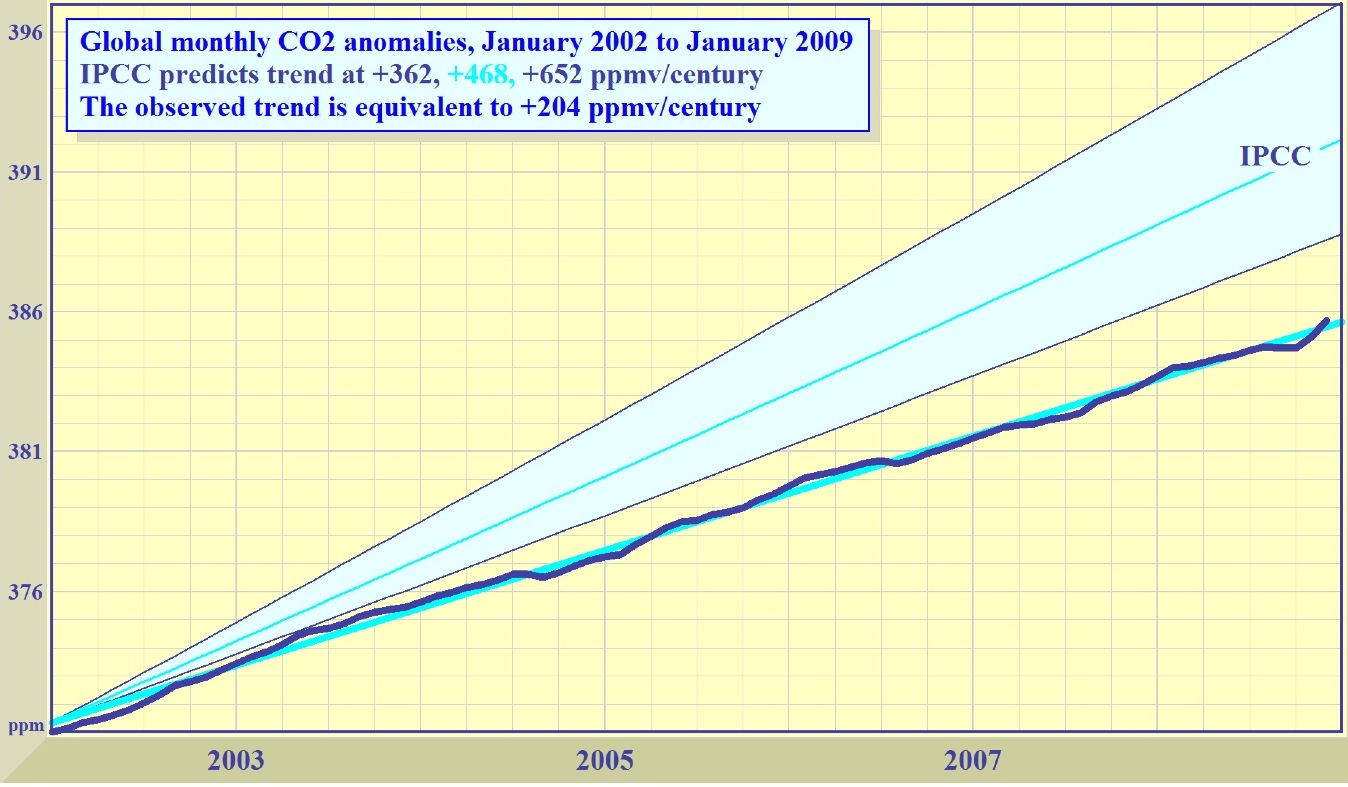
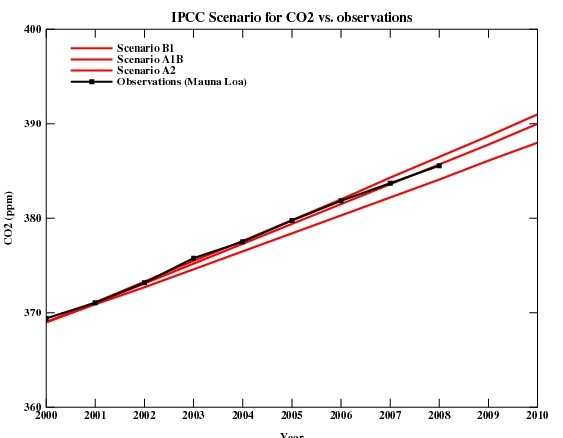
How can this be described except as fake?
Apart from this nonsense, is there anything to Monckton’s complaint about Revkin’s story? Sadly no. Once one cuts out the paranoid hints about dark conspiracies between “prejudiced campaigners”, Al Gore and the New York Times editors, the only point he appear to make is that this passage from the scientific advice somehow redeems the industry lobbyists who ignored it:
The scientific basis for the Greenhouse Effect and the potential for a human impact on climate is based on well-established scientific fact, and should not be denied. While, in theory, human activities have the potential to result in net cooling, a concern about 25 years ago, the current balance between greenhouse gas emissions and the emissions of particulates and particulate-formers is such that essentially all of today’s concern is about net warming. However, as will be discussed below, it is still not possible to accurately predict the magnitude (if any), timing or impact of climate change as a result of the increase in greenhouse gas concentrations. Also, because of the complex, possibly chaotic, nature of the climate system, it may never be possible to accurately predict future climate or to estimate the impact of increased greenhouse gas concentrations.
This is a curious claim, since the passage is pretty much mainstream. For instance, in the IPCC Second Assessment Report (1995) (p528):
Complex systems often allow deterministic predictability of some characteristics … yet do not permit skilful forecasts of other phenomena …
or even more clearly in IPCC TAR (2001):
In climate research and modeling, we should recognize that we are dealing with a coupled non-linear chaotic system, and therefore that the long-term prediction of future climate states is not possible. The most we can expect to achieve is the prediction of the probability distribution of the system’s future possible states….
Much more central to the point Revkin was making was the deletion of the sections dealing with how weak the standard contrarian arguments were – arguments that GCC publications continued to use for years afterward (and indeed arguments that Monckton is still using) (see this amendment to the original story).
Monckton’s ironic piece de resistance though is the fact that he entitled his letter “Deliberate Misrepresentation” – and this is possibly the only true statement in it.
http://scholar.google.com/scholar?q=climate+trend+length+detection+statistics+%2230+year%22
Chris writes:
No, Chris, I won’t concede a point that’s wrong. Sorry if that strikes you as unfair.
Re: 501
Thanks but I was hoping for a key standard reference on the subject in order to avoid spending hours wading through search engine results.
John, sounds like you want an introductory college statistics text? I’m too long out of school to recommend one. Or have you studied statistics but want something about this particular number?
I think you’re asking how one determines sample size (how many samples are needed to detect a trend with some level of confidence).
You might inquire in Bob Grumbine’s open questions thread. He provides supplementary files for his four or five Trends threads. Did you look at the example files he provides for people to do the exercises themselves? perhaps that would help. Or ask about his references.
Some of these are standard texts — look at the “cited by” numbers.
http://scholar.google.com/scholar?q=how+many+samples+are+needed+to+detect+a+trend+with+confidence
The fact that Monkton might engage in manipulation is one thing… but what if Department of Energy hires an outside firm to to do the same thing?
http://www.usatoday.com/tech/science/environment/2009-06-01-alternative-energy_N.htm
“U.S. institutes lead in environmental research expertise”
Really? I guess it depends on how you define “environmental”…
http://www.earthportal.org/news/?p=2442
How was all this ranked? For that, let’s look to the methodology employed in the study. Why? For the same reason you want to examine the methods used in historical temperature reconstructions and in climate models.
The lead study analyst, Kevin Boyack, is a employee of Scitech Strategies, noted for a “map of science” approach – but can we see the precise methodology? It doesn’t look like it:
Proprietary means that no, you can’t see how we did it. The same problem applies to the DOE-FutureGen performance model results – protected from public scrutiny by the blatant abuse of patent law under “public-private partnership” contracts.
In energy research, as in climate research, the data and methods should be made available for public inspection. If the DOE isn’t doing that, reporters should be asking why.
And, please, look at all the data trends over the rise of fossil CO2 in the atmosphere, don’t just cherrypick regions:
http://data.giss.nasa.gov/gistemp/
Bets are now on, by the way: who can predict an El Nino?
Summary: Pacific trending towards El Niño
The recent evolution of climate patterns across the equatorial Pacific is consistent with the early stages of a developing El Niño. Moreover, during the past few months computer forecasts have increasingly shown El Niño as a distinct possibility for 2009. The odds of an El Niño are now thought to be above 50%, which is more than double the normal risk of an event. However, it is still possible that the recent trends may stall without El Niño thresholds being reached.
http://www.bom.gov.au/climate/enso/
Re 504:
No I’m not looking for an introductory statistics book. I’d just like to see a key reference on this issue. From my perspective it’s not purely a problem in statistics. I think it is interesting. The Grumbine thing was convincing regarding 30 years until you consider that he was using 120 years worth of data to do conclude that 30 years is about the right period. It seems to me that something like 30 years has to be the answer if you use 120 years worth of data, my point being that if you average over a significant chunk of the total data available to you then you’ll start approaching a sample size independent answer simply because you’re starting to run out of sample. My guess is that if we followed Grumbine and had annual data going back say 1,000 years we’d conclude that 300 years was the right period, and if we had data for 10,000 years we’d conclude that 3,000 years was the right period. However, If we’re concerned with changes that occur on the order of about a century I’d be inclined to go with the 30 year figure, but not because 100 year’s worth of data demands it but because it is a significant fraction of the time scale of interest which is also 100 years. Somebody above wrote that it climate change was determined by the data and that 30 years is the value on which climate change can be determined. I agree that 30 years is the “right number” but not because it is intrinsic to climate but because it is intrinsic to humans. We can contemplate future society out a few times 30 years but not for ten times 30 years. I would imagine this sort of stuff has been discussed in the literature and I’d like to read it if anyone knows a reference.
Regarding sample size:
I don’t think sample size is the right metric for learning trends. Consider a particle moving with a constant small velocity v on which is superimposed a large random walk with diffusion coefficient D. What is the probability that the position of the particle is greater than L? For short times it is zero. For times long compared to L^2/D but short compared to D/v^2 the probability is about 1/2 because on these intermediate time scales the distribution of positions looks uniform. On these intermediate time scales the particle could be anywhere (provided L^2/D
Did you read the earlier threads? This may help, linking to a question that resembles yours that was answered inline at the time:
https://www.realclimate.org/index.php/archives/2008/01/uncertainty-noise-and-the-art-of-model-data-comparison#comment-78961
You may also find the discussion on this thread helpful (as well as much else at this site), if you follow the math; it’s a different data set but similar questions are raised about how long is needed:
http://tamino.wordpress.com/2008/08/01/spencers-folly-3/
“… The method can be used to estimate climate sensitivity, but it actually requires reasonably long time spans to give the correct result. It was used by Forster and Gregory (2006, J. Climate, 19, 39) to estimate climate sensitivity based on actual measurements from 1985 to 1996 …. They also caution that the time span under study casts doubt on the accuracy of their results, because it’s too short a time span for the method to be very precise. They further caution that some feedbacks (in the usual sense) can take decades or longer to appear, so their analysis is more like an estimate of “prompt” climate sensitivity than of the true, equilibrium climate sensitivity. Forster and Taylor (2006, Journal of Climate, 19, 6181) got around the too-brief-time-span problem by analyzing the output of climate models for hundreds of years, but of course that’s the result for a climate model, not observations for the actual planet earth.”
Gavin’s inline response at the link Hank posts above should help you. I have no problem with your statement. When looking at the climate signal for the next couple of hundred years, we can safely ignore the fact that slow changes driven by the milankovich cycle are significant at the 10s of thousands of years timescale. If we make it to the next ice age perhaps civilization will worry about it a few thousand years before it arrives … until then, it seems prudent to worry about what we’re doing to the system on the century timescale.
John, this article discusses some of the rationale and history:
Guttman, N.B. (1989). Statistical descriptors of climate. Bulletin of the American Meteorological Society 70:602-607.
Re 508-510 thanks for the links. Interesting reads.
I read another paper about learning trends from data but I haven’t absorbed it yet. I have a criterion of my own which I’m certain is in the literature although I didn’t see it. I claim though that if D = half the time rate of change of the variance in the temperature data (in degrees squared per decade) and V is the “trend” (in degrees per decade) that you need to collect data for a minimum time of about D/V^2 in order to get a reasonable estimate of V. It takes about this long before a trend will emerge from the noise. This is of course what the tamino link is about but he didn’t put it in quite these terms. Work kept me from reading the Forster and Gregory paper. anyway, thanks for the links.
John (511, 506): Your question is a good one. I’m running around for a bit yet, but when I settle back down I’ll pursue some illustrations of an answer to what I believe you’re asking. A drawback is that once we leave the last 120-150 years, we don’t have the same caliber of data to work with. In particular, we need something with annual resolution if we’re going to keep using the same approach I was. This exists, but either you must accept the global temperatures of the last several hundred years as spliced from proxies (and still only have several hundred years to work with), or you look only at local data sources (but can go back much farther, at least if someone actually sampled the ice cores or longer tree ring series to annual resolution). I’ll look for some sources of data that would be interesting.
In the mean time, I’ll suggest this question: Do we have reason to believe that the last 120 years, as viewed from 30ish year bases, are markedly different in their variances than other periods? Keeping in mind as we ask that the early part of the 120 years (or 150 — you get comparable answers from the HADCRUT series as the NOAA or NASA) is agreed by all to be mostly unaffected by human activity, and the more recent span still shows that we want the same 30ish years to be talking about climate.
Your comment about 30 years being a good figure strictly on human counts is one I’ve made myself. I’ve been a bit surprised to see that it holds up as a good number on climatological grounds as well. And does so whether I’ve looked at mean, variance, or trend. At least for global mean temperature. I’ll be looking at other variables sooner or later. (And have, but with such a short record I don’t trust the results much. Still, 20-30 years came up as the desirable period there, too.)
Warning: humor mode on.
Bad graphs never die, and they don’t even seem to fade away.
Courtesy Deltoid, we find Monckton being interviewed for Larouche’s Executive Intelligence Review, a publication not on par with Science or Nature, or even Energy and Environment. It might match UFO magazines, maybe.
Laroucher Murphy’s introductory comments offer a taste of what to expect, including:
“In the interview, one sees that, Monckton’s view of the “cabal,” as he calls the people behind the fascist global warming swindle, is limited. The interviewer’s view of this cabal is broader, which includes the financial oligarchy centered in the City of London and the self-confessed genocidalists Prince Philip and Prince Charles, along with their lap dog Al Gore.”
I hadn’t realized Monckton’s view was so limited.
If you want the full article, here it is. It features the selfsame graph that started this post.
Now, back to reality….