Along with David’s online class a number of new climate science Massive Online Open Courses (MOOCs) are now coming online.
 A new online course from MIT, “Global Warming Science”, introduces the basic science underpinning our knowledge of the climate system, how climate has changed in the past, and how it may change in the future. The course focuses on the fundamental energy balance in the climate system, between incoming solar radiation and outgoing infrared radiation, and how this balance is affected by greenhouse gases. They also discuss physical processes that shape the climate, such as atmospheric and oceanic convection and large-scale circulation, solar variability, orbital mechanics, and aerosols, as well as the evidence for past and present climate change. Climate models of varying degrees of complexity are available for students to run – including a model of a single column of the Earth’s atmosphere, which includes many of the important elements of simulating climate change. Together, this range of topics forms the scientific basis for our understanding of anthropogenic (human-influenced) climate change.
The introduction video gives a flavour of the course, which is presented by Kerry Emanuel, Dan Cziczo and David McGee:
The course is geared toward students with some mathematical and scientific background, but does not require any prior knowledge of climate or atmospheric science. Classes begin on February 19th and run for 12 weeks. Students may simply audit the course, or complete problems sets and a final exam to receive a certificate of completion. The course is free, and one can register for it here.
There are other climate science courses available too:
- David’s course Global Warming: The Science of Climate Change is starting again March 31.
- A course Turn Down the Heat: Why a 4ºC Warmer World Must be Avoided from the World Bank (presented by Kanta Kumari Rigaud and Pablo Benitez, and including input from Stefan). This started Jan 24.
- Richard Alley has a new 8-week course Energy, the Environment, and Our Future which started on Jan 6. (More background here).
- Update: Climate change: challenges and solutions from Tim Lenton, U. Exeter
- Update: Climate Change in Four Dimensions from Charles Kennel, Naomi Oreskes, Veerabhadran Ramanathan, Richard Somerville and David G. Victor, UCSD.
Good studying!
Also excellent MOOC by Exeter University – Climate Change: Challenges and Solutions on Future Learn. 8 week course currently running (at week 3).
[Response: Link? I’ll add it in. – gavin]
It may also help to mention the online course recently offered by the Scripps Institution of Oceanography (SIO), although it is already well into the quarter. Nevertheless there is also a corresponding seminar series at SIO which some may find useful.
Another Coursera course which started in January is “Climate Change in Four Dimensions” offered by UCSD: https://www.coursera.org/course/4dimensions. Lecturers are Charles Kennel, Naomi Oreskes, Veerabhadran Ramanathan, Richard Somerville and David G. Victor. This 10-week course covers many different aspects apart from the science and goes into policy, mitigation, adaptation and misinformation to name just a few.
How about David Archer? Videos are here, now, as lectures and as short topics:
http://forecast.uchicago.edu/lectures.html
More:
http://forecast.uchicago.edu/index.html
http://forecast.uchicago.edu/classes.html
http://forecast.uchicago.edu/coursera_syllabus.pdf
https://class.coursera.org/globalwarming-001/help
I suggest that the graphic shown is not a good representation of the problem, since it shows that there is zero up-going radiation in the CO2 band. The obvious observation is that the game is over and further CO2 will not matter. However, the ‘up-going radiation’ is not zero, only up-going radiation from sea level has gone to zero.
Those familiar with the problem should be careful about presentation, unless of course there is not a concern for those trying to come to an initial understanding.
Gavin , as the title line is long enough to accommodate Massive Online Open Course why not spell it out instead of leaving readers guessing ?
[Response: Ok. – gavin]
Very sorry, I didn’t see “Archer” so I jumped. You, of course, are on a first name basis. Anyway whoever wants to can see a well organized set of David Archer’s lectures at the first link at #4:
http://forecast.uchicago.edu/lectures.html#sthash.9YTyW75M.dpuf
Let me to add:
http://forecast.uchicago.edu/models.html
I’ve often seen that graphic but I haven’t realized how misleading it is (as Jim pointed out).
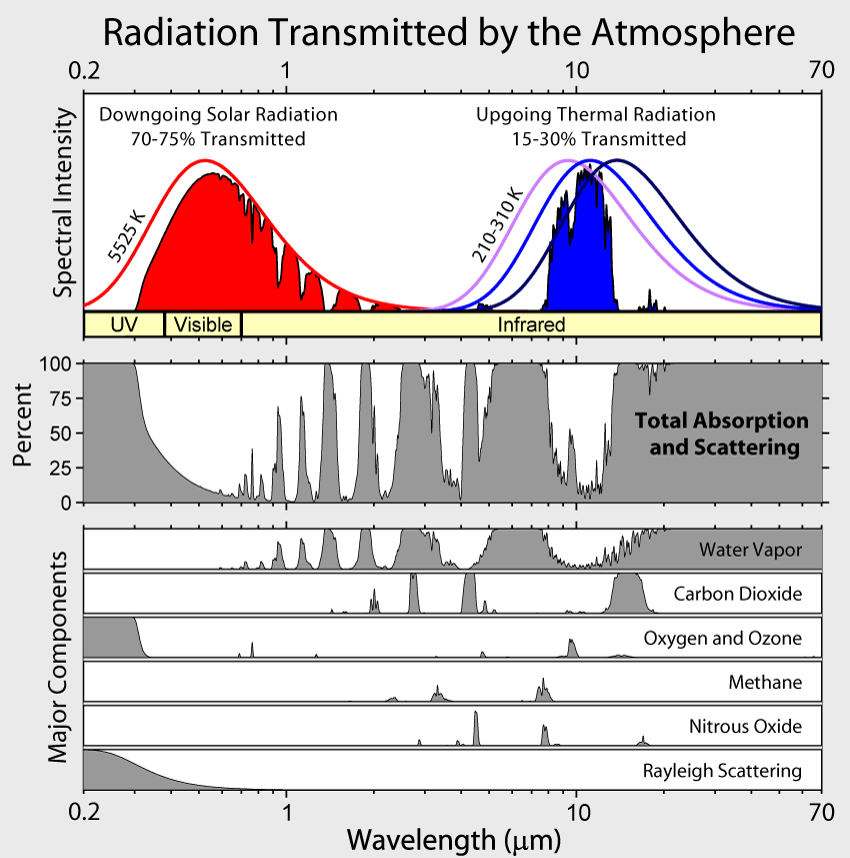
Better to call it “out-going radiation”. The smooth blue lines is the “up-going radiation” from the Earths surface, and the jagged blue filled line is the radiation that makes it out the atmosphere.
I think we should emphasize that the problem is not HOW MUCH of the up-going radiation leaves Earth’s atmosphere (and isn’t going to change much with increasing CO2), but WHERE is that up-going radiation getting absorbed. The higher the amount of CO2, the lower in the atmosphere it gets absorbed. So if atmospheric CO2 used to absorb 50% of the radiation in the first X miles of atmosphere, with doubled CO2 the same layer (X miles thick) will absorb 75% of the radiation passing through it.
Dennis, I guess that’s a different chart, and it’s a good problem to think about how to design it. Do you think it’s especially relevant to deceptions about why doubling CO2 doesn’t or won’t matter much?
Anyway, this chart is ambitious enough. It is a state-of-the-art fundamental data visualization dating from about 2007. For details and background, please consult this location and hit all the links:
http://www.globalwarmingart.com/wiki/File:Atmospheric_Transmission_png
http://www.globalwarmingart.co /wiki/File:Atmosphere_Transmission_Blackbody_Only_png
http://www.globalwarmingart.com/wiki/Special:NewFiles
#5 Jim Bullis: I’m not sure what you’re looking at. Please note the description here:
http://www.globalwarmingart.com/wiki/File:Atmospheric_Transmission_png
“Collectively these processes capture and redistribute 25-30% of the energy in direct sunlight passing through the atmosphere. By contrast, the greenhouse gases capture 70-85% of the energy in upgoing thermal radiation emitted from the Earth surface. This disparity is a major factor in creating the greenhouse effect, whereby thermal energy is trapped near the Earth’s surface warming the planet.”
#9 If that second link doesn’t work, this version of the graphic is on the New Files page (third link). It’s also on the bottom of the page (“Other versions”) at the first link. Expand it for 4 external links.
“The basic structure of matter involves charged particles bound together in many different ways. When electromagnetic radiation is incident on matter, it causes the charged particles to oscillate and gain energy. The ultimate fate of this energy depends on the situation. It could be immediately re-radiated and appear as scattered, reflected, or transmitted radiation. It may also get dissipated into other microscopic motions within the matter, coming to thermal equilibrium and manifesting itself as thermal energy in the material. With a few exceptions…absorbed electromagnetic radiation simply deposits its energy by heating the material. This happens…for infrared [etc]…
“Infrared radiation in the spectral distribution of a black body is usually considered a form of heat, since it has an equivalent temperature, and is associated with an entropy change per unit of thermal energy. However, the word “heat” is a highly technical term in physics and thermodynamics, and is often confused with thermal energy. Any type of electromagnetic energy can be transformed into thermal energy in interaction with matter. Thus, any electromagnetic radiation can “heat” (in the sense of increase the thermal energy termperature of) a material, when it is absorbed.
“The inverse or time-reversed process of absorption is responsible for thermal radiation. Much of the thermal energy in matter consists of random motion of charged particles, and this energy can be radiated away from the matter. The resulting radiation may subsequently be absorbed by another piece of matter, with the deposited energy heating the material. Thermal radiation is an important mechanism of heat transfer.”
Gavin: What I’m getting at the first link, “David’s online class” is Stefan’s 20 Dec 2012 post. It’s fine with me because I like those two videos with Stefan a lot. I like to see people who stand up and think. [My media function is iffy, so I didn’t know what was there at first.]
[Response: Fixed. thanks. -gavin]
The University of Exeter’s future learn course run by Prof. Tim Lenton can be found here:
Climate change: challenges and solutions
https://www.futurelearn.com/courses/climate-change-challenges-and-solutions
#10 Patrick and Dennis
I start with the ‘Total Absorption and Scattering’ with a Percent scale. That graph is forced to 100% by the CO2 component below, particularly the broadest band. 100% absorption and scattering would seem to leave no more damage left to do. And consistently, the blue trace seems to show that there is zero upgoing radiation over this spectral band. So reading this logically, there is no more harm to be done no matter how much more CO2 goes into the atmosphere.
As was pointed out here some years ago, this is not a complete representation of the problem. If we are only considering attenuation over the path from earth surface to space, the column of atmosphere does attenuate the radiated energy 100%. But that attenuation results in heating the pathway through the atmosphere, and that pathway includes a substance that is thus increased in temperature, and this substance becomes a basis of secondary radiation. As CO2 increases past the point that seemed to be saturation, the secondary process repeats more and more, and earth temperature driving the flow has to be higher to achieve equilibrium.
Notwithstanding my limited ability to explain this, I think this is the heart of the matter as far as global warming is concerned. No, I do not write the equations describing this. I wish I had that depth on the subject.
But it does appear that the chart misleads to a conclusion that present levels of CO2 have reached a saturated condition as far as attenuation is concerned.
# Aaron
Looks great. Thank you!
Thank you very much for sharing these links! I’ve joined the “4 Degree” course underway and signed up for the MIT one starting in March too. I wouldn’t have heard of them without this post. Thank you, thank you!
Something to recommend to your denialist “friends.”
> it does appear that the chart misleads
Then add context so it doesn’t mislead. Looking at just one image (out of all the images needed to put together the big picture) won’t help.
It’s not the chart that “misleads” — it’s looking at less than enough of the big picture.
Just wondering if there are any MOOC’s from the denier perspective?
Glenn Gail,
Quite possibly, but they wouldn’t be offered by a science department.
#17 Hank Roberts
If you present information in the format of a filter response curve, which large numbers of people understand, and you leave it at that, that information does a disservice.
Rarely is it important in electronic filter analysis to consider the heat absorbed by the filter. It would not be difficult to point out that the absorbed heat left after simple transmission is important to the heat retention analysis.
#8 Dennis
I don’t think the blue hump is outgoing radiation. If that were the case, the zero level of outgoing radiation in the CO2 main band would tell us that CO2 at the present time has completely blocked outgoing radiation. That is not the case.
I think the chart is a simple representation of a measurement of attenuation over the full path of atmosphere, from earth surface to space, on an instantaneous basis. This is comparable to the way electronic filter response is measured.
#5 & #8 Jim Bullis & Dennis: I think the answers and presentation you want are in “A Saturated Gassy Argument,” guest post by Spencer Weart in collaboration with Ray Pierrehumbert, 26 June 2007, Part I:
https://www.realclimate.org/index.php/archives/2007/06/a-saturated-gassy-argument/
–and Part II: What Angstrom Didn’t Know:
https://www.realclimate.org/index.php/archives/2007/06/a-saturated-gassy-argument-part-ii/comment-page-1/?wpmp_switcher=mobile
Luck has it (7th comment, Part I) that Robert A. Rohde says, 26 Jun 2007 at 10:32 AM:
“Of potential interest to people here, I recently completed making a figure showing atmospheric absorption bands for the principle gases. The primary goal of the figure was to compare downgoing solar and upgoing thermal radiation, so it doesn’t do much to clarify the saturation arguments per se, but does show the relative importance of water vapor and other gases and help understand where the saturation arguments are coming from.
“Though not really a complete argument, for unsophisticated audiences, I find that saying that more CO2 allows heat to be held “closer” to the Earth’s surface is often an effective response to the saturation line of thought.”
He links his page for the “Radiation Transmitted by the Atmosphere” chart:
http://www.globalwarmingart.com/wiki/Image:Atmospheric%20Transmission.png
This chart-page links the “Absorption Band” Wikipedia page:
http://en.wikipedia.org/wiki/Absorption_band
–which includes the chart and a caption saying what the chart intends to present: “Absorption bands in the Earth’s atmosphere created by greenhouse gases and the resulting effects on transmitted radiation.”
The complexity of the absorption of CO2 itself takes other charts. (See Part II: What Angstrom Didn’t Know). The CO2 absorption band widens slightly as CO2 doubles, etc. Also the atmospheric column is discussed.
Raypierre is excellent on this, and he gives you the history. The entire post is great.
Here he is in a 6-minute video, “How CO2 Warms the Climate”:
http://thiniceclimate.org/blog/details/1907/how-co2-warms-the-climate-ray-pierrehumbert
http://thiniceclimate.org/whats-it-with-co2
nice post keep it up
I think this is a great idea for MIT to introduce this online course to their curriculum. It looks like an interesting class for students studying climatology or other related fields. I hope it’s a big success and they get a high enrollment.
I just want to say as a student of two climate change MOOCs, how grateful I am to the people who are putting these together and making them available on such platforms. Thank you!
Re: graphic by Robert A. Rohde in this post (“Radiation Transmitted by the Atmosphere”) and his comment about it, RC 26 Jun 2007 (#23), compare this chart:
http://en.wikipedia.org/wiki/File:Solar_Spectrum.png
http://en.wikipedia.org/wiki/Greenhouse_effect
“If an ideal thermally conductive blackbody was the same distance from the Sun as the Earth is, it would have a temperature of about 5.3 °C. However, since the Earth reflects about 30% of the incoming sunlight, this idealized planet’s effective temperature (the temperature of a blackbody that would emit the same amount of radiation) would be about −18 °C. The surface temperature of this hypothetical planet is 33 °C below Earth’s actual surface temperature of approximately 14 °C. The mechanism that produces this difference between the actual surface temperature and the effective temperature is due to the atmosphere and is known as the greenhouse effect.”
(I like that chart too, but I don’t know if it’s been made.)
“Earth’s natural greenhouse effect makes life as we know it possible. However, human activities, primarily the burning of fossil fuels and clearing of forests, have intensified the natural greenhouse effect, causing global warming. …
“Strengthening of the greenhouse effect through human activities is known as the enhanced (or anthropogenic) greenhouse effect. …”
“The ‘greenhouse effect’ of the atmosphere is named by analogy to greenhouses which get warmer in sunlight, but the mechanism by which the atmosphere retains heat is different.”
Fantastic, I’ve really got into MOOCs recently, especially on Coursera. I look forward to giving this one a shot.