There is little evidence for a connection between solar activity (as inferred from trends in galactic cosmic rays) and recent global warming. Since the paper by Friis-Christensen and Lassen (1991), there has been an enhanced controversy about the role of solar activity for earth’s climate. Svensmark (1998) later proposed that changes in the inter-planetary magnetic fields (IMF) resulting from variations on the sun can affect the climate through galactic cosmic rays (GCR) by modulating earth’s cloud cover. Svensmark and others have also argued that recent global warming has been a result of solar activity and reduced cloud cover. Damon and Laut have criticized their hypothesis and argue that the work by both Friis-Christensen and Lassen and Svensmark contain serious flaws. For one thing, it is clear that the GCR does not contain any clear and significant long-term trend (e.g. Fig. 1, but also in papers by Svensmark).
Svensmark’s failure to comment on the lack of a clear and significant long-term downward GCR trend, and how changes in GCR can explain a global warming without containing such a trend, is one major weakness of his argument that GCR is responsible for recent global warming. This issue is discussed in detail in Benestad (2002). Moreover, the lack of trend in GCR is also consistent with little long-term change in other solar proxies, such as sunspot number and the solar cycle length, since the 1960s, when the most recent warming started.
The fact that there is little recent trend in the GCR and solar activity does not mean that solar activity is unimportant for earth’s climate. There are a large number of recent peer-reviewed scientific publications demonstrating how solar activity can affect our climate (Benestad, 2002), such as how changes in the UV radiation following the solar activity affect the stratospheric ozone concentrations (1999) and how earth’s temperatures respond to changes in the total solar irradiance (Meehl, 2003). Furthermore, the lack of trend in GCR does not falsify the mechanism proposed by Svensmark, i.e. that GCR act as a trigger for cloud condensation nuclei and are related to the amount of low clouds. As for this latter issue, the jury is still out.
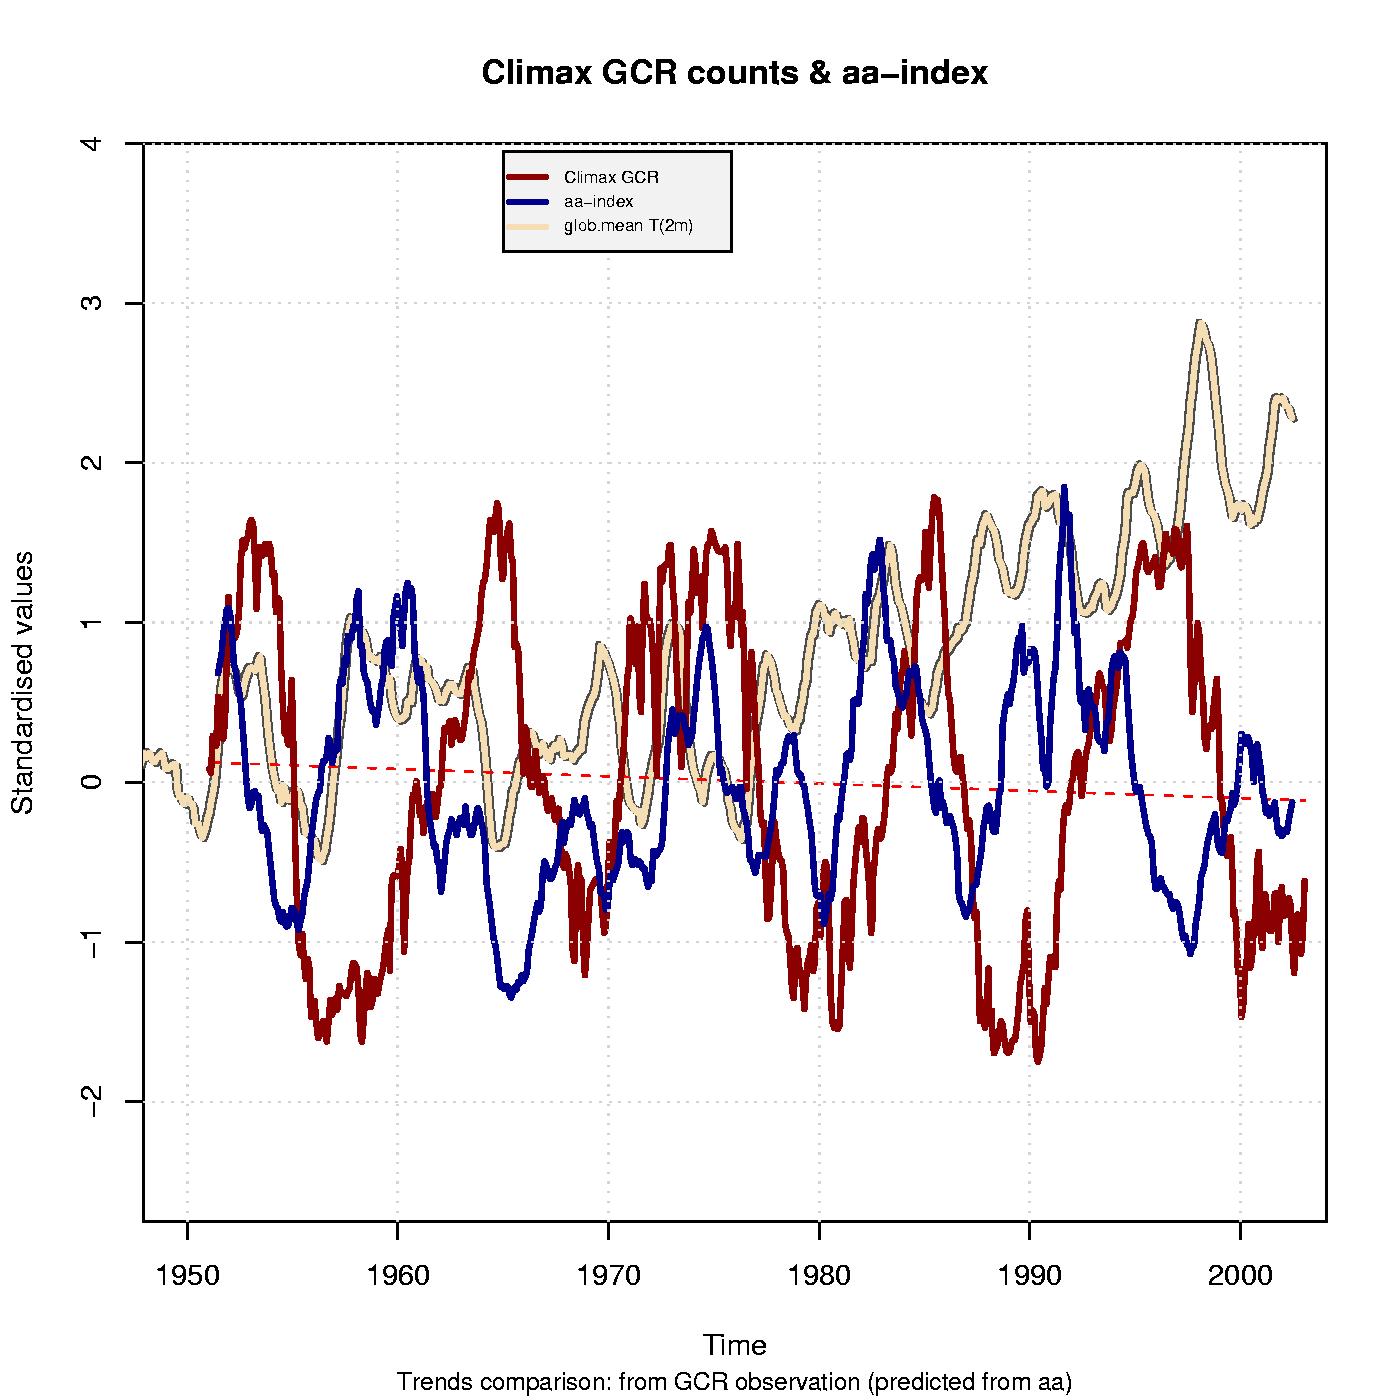
FIGURE 1. GCR counts from Climax (red) and the aa-index (blue). The straight lines show the best linear-fit against time estimated through linear regression. The GCR measurements are shown in solid black line, from which a trend of -180 +/- 253 counts/decade is estimated, and this is associated with a p-value (the probability of this being different to the null-hypothesis: zero trend) of 0.477 (not statistically significant at the 5% level). The aa-index is represented by the blue line, and the corresponding trend of 1.5 +/- 0.4/decade is associated with a p-value of 0.0002 (highly statistically significant). A regression analysis points to a clear link between GCR and the aa-index, and the analysis of variance yields R2 = 0.1466 and the p-value= 0. The yellow line shows the global mean temperature from CRU for comparison. [Data source: http://ulysses.uchicago.edu/NeutronMonitor/neutron_mon.html” , “http://www.cru.uea.ac.uk/cru/data/temperature/” and “ftp://ftp.ngdc.noaa.gov/STP/SOLAR_DATA’].
References:
Benestad, R.E. (2002) Solar Activity and Earth’s Climate, Praxis-Springer, Berlin and Heidelberg, 287pp, ISBN: 3-540-43302-3
Damon, P.E. and P. Laut (2004), Pattern of Strange Errors Plagues Solar Activity and Terrestrial Climate Data, Eos, vol 85, num 39, p. 370
Friis-Christensen, E. and K. Lassen (1991), Length of the solar cycle: an indicator of solar activity closely associated with climate, Science 254: 698-700
Meehl, G.A., W.M. Washington, T.M.L. wigley, J.M. Arblaster, A. Dai (2003): Solar and Greenhouse Gas Forcing and Climate Response in the Twentieth Century, J. Climate, 6: 426-444
Shindell, D., D. Rind, N. Balachandran, J. Lean and P. Lonergan (1999): Solar Cycle Variability, Ozone and Climate, Science, 284: 305-308
Svensmark, H. (1998), Influence of Cosmic Rays on Earth’s Climate, Physical Review Letters, vol 81, num 22, 5027-5030
This is an excellent summary of the state of research in this area — or at least it appears so to this interested layman.
The tone and level of detail are appropriate, and the links very useful.
You may want to modify the story heading and subhead, both of which have “cosmic galactic rays” instead of “galactic cosmic rays.”
Response: Thanks. Done. – gavin
GCR may or may not be involved in cloud cover/climate, but fact is that there still is a high correlation between cloud cover (and thus temperature) and solar activity. Probably by changes in jet stream position, due to changes in UV absorption in the stratosphere.
See: http://folk.uio.no/jegill/papers/2002GL015646.pdf
Further, the sun cycle induces relative large changes in cloud cover in the US, see: http://www.gsfc.nasa.gov/topstory/20010712cloudcover.html
And for Boston in particular: http://www.erh.noaa.gov/box/effects.htm
The US and Boston figures are for mid-latitudes, tropical trends are opposite…
Are you sure that the live links in the “References” section are working… I only get 404 errors!
Response: Thanks for the heads up. We found, and fixed, one broken link. -mike
Further, the sun cycle induces relative large changes in cloud cover in the US, see:
I think he means “correlates with” cause and effect whilst likely are v. difficult to establish.
I should add (after looking at the references he gives)that of course the US covers about 3.5% of the Earth’s surface and that Boston is slightly less than that.
I speak of area not political influence or cultural history.
The three references look at three different levels: global, regional and local. On all three levels there is a significant correlation between the sun cycle and cloud cover, less by GCR than by irradiation. For cause and effect: You never know, but I don’t think that cloud cover regulates the sun cycle… Globally, the variation of cloud cover during a sun cycle is around 2%, which can have a substantial influence on global temperatures.
Page 3 of http://folk.uio.no/jegill/papers/2002GL015646.pdf gives a possible explanation for the influence. Further, the solar signal can be seen in the sea surface temperature of the oceans, the amplitude of the solar signal can be as much as 0.3 K for some solar cycles.
For the tropics even higher: from http://www.aero.jussieu.fr/~sparc/SPARC2000_new/OralSess2/Hood/Node2.html :
“During the past several years as the solar UV flux has increased toward the next solar maximum, the mean tropical temperature has also increased significantly by more than 0.5 K. An increase of similar magnitude occurred between 1986 and the 1990 solar maximum. These temperature increases can not be attributed easily to volcanic influences and are most probably solar in origin.”
0.5 K for the tropics in only four years…
In addition to my comment in #6, there is a recent investigation of different chemicals content in Antarctic ice cores, that makes a connection between solar variability and climate, in this case for wind speed around Antarctica. See: http://www.spaceref.com/news/viewpr.html?pid=15758
That solar output has increased in the second halve of last century is confirmed by satellites: http://www.space.com/scienceastronomy/sun_output_030320.html . Although the direct heat increase is not enough to cause much climate change, the indirect influence of solar activity on cloud cover, wind and rain patterns may be large enough to have an important impact.
Further, Svendsmake still defends his theory about the GCR-temperature connection, see:
http://www.estec.esa.nl/wmwww/wma/spweather/Alpbach2002/Friis-Christensen.pdf
Response to point 7: Your comment is interesting and I don’t think that we can resolve the issue here. The data in question here have all been synthesised from several satellite missions of which all show large differences in the actual level of solar output. At least one long-ish records (starting from the late 1970s) of the solar output (total solar irradiance, TSI) may indicate higher level of TSI in the last solar minimum in 1996 compared to that in 1986. Others TSI reconstructions do not indicate any such ‘trends’ (one may argue whether the difference between two such points consititutes a trend). It is interesting to note that there is a significant correlation between the TSI and the (Wolf) sunspot number. One critical point is then: if there is a trend in the TSI, why isn’t there one in the sunspot number? Furthermore, why isn’t there a trend in the GCR, which also follows the solar activity? And if there is a disagreement between the trends in TSI and the sunspotnumber, is it then justifiable to use the sunspot number or isotope records (that follow GCR) to reconstruct the TSI for paelo-climatic studies? The implications of such disagreement are quite profound, and I believe we may be looking at a very interesting topic for future research.
I must admit that I don’t understand how Svensmark can explain how GCR can explain the recent global warming if there evidently is no trend in the GCR (Even in his own papers, the GCR records have been plotted, and they do not exhibit trend!). I think we should leave it up to Svenmark to explain this.
In response to #8, indeed it seems to be difficult to have a clear picture of how the sun’s acticity best is described. Although all indications like sunspot (group) number, sun cycle length, TSI, AA index, GCR, 10Be, 14C all have a good correlations with each other on long term, short term differences make it rather difficult to decide what is the best indication for the sun-earth climate connection.
Fact is that if there is a connection between solar activity (whatever by what mechanism) and cloud cover, then the small change in TSI of ~0.1% (1.3 W/m2 at the top of the atmosphere, halve of that absorbed at the surface) within a sun cycle (~0.25% or 4 W/m2 TOA on long term since the Maunder minimum) is increased with 2.8 W/m2 (2% of the ~140 W/m2 reflected by clouds) or ~7 W/m2 since the Maunder Minimum. That is some factor 4-5 over the original insolation alone, which is incorporated in current climate models…
Response: Two points. First the radiative forcing of clouds is not just in the short wave, and depending on where they are, that can either be positive or negative. Secondly, if the potential cloud response is related to changes in circulation caused by the TSI or an ozone related change, then it isn’t an extra forcing at all – it is part of the feedback, and should already be incorporated in models. Only if the cloud change is directly forced by some cosmic ray induced process would this be an extra forcing, however, the physical evidence so far of an actual mechanism for this is underwhelming. – gavin.
Gavin,
Thanks for the response. As far as I know, but please correct me if I am wrong, current models include solar only/mainly as insolation alone. And consequently, cloud responses of the models are included in the same way for GHG warming as for solar warming.
But solar has its highest direct influence in the tropics vs. GHGs more toward higher latitudes. And the highest variation of solar is in the stratosphere vs. GHGs in the lower troposphere.
According to http://folk.uio.no/jegill/papers/2002GL015646.pdf
“A physical mechanism connecting solar irradiance and low clouds might contain the following components: (1) Over the solar cycle the flux of ultraviolet (UV) radiation varies by several %, and even more so in the short wavelength component of the UV. This affects the propagation of planetary waves from the troposphere to the stratosphere, which in turn affects weather patterns in the troposphere [Haigh, 1996], including the strength and location of the summertime subtropical highs. Since the subtropical oceans are favoured regions for low clouds (Figure 2), especially in summer, such changes in weather patterns may conceivably affect low cloud cover in the manner seen in Figure 1.”
Thus this is a direct negative feedback of (cooling) low clouds on solar changes in the stratosphere, not possible for CO2 (but may be partly applicable for other GHGs like methane, if they reach the stratosphere).
The second possibility, as feedback to higher sea surface temperatures, seems also more sensitive for solar in the tropics than for GHGs in the higher latitudes…
[Response: The point about the solar effect (through variation in the UV emission) on the stratosphere is an aspect of the solar-terrestrial link that I personally find most interesting. It is perhaps in the stratosphere (upper atmosphere) that we see the strongest signatures of the solar cycle. There have been published some papers by Shindell, Haigh and others that are worthwhile reading. When putting this in context with the recent global warming, then there seems to be some sticky points, namely that one would expect that an intensification in the UV emission (due to a more active sun) would result in a warmer stratosphere – not? There are empirical evidence for the exact opposite – a cooling stratosphere (Why does the stratosphere cool when the troposphere warms?). I think it’s also fair to say that the ozone-related processes are strongly contaminated by other factors, such as man-made chemicals (CFCs and the ‘ozone hole’). -rasmus]
Please explain what the aa index is!
[Response: Sorry! The aa-index is a magnetic activity index, and the reference to this is Mayaud, P.-N. (1972): The aa Indices: A 100-year series characterizing the magnetic activity. Journal of Geophysical Research, vol 77(34) 6870-6874. It is derived from from magnetic measurements near each of the poles (Greenwich and Melbourne observatories but superseded by observations from Abinger-Hartland and Toolangi). See also paper by Lockwood et al. and the site by J.H. Allen. rasmus-]
Rasmus,
Takk for din reaksjon. I had the same thoughts about the change in temperature of the stratosphere. But despite the stratospheric cooling, the fingerprint of solar influences still is similar as in the past, until now. Maybe it is not the height of the stratospheric temperature which is important, but the temperature differences between the equator and other regions. For the general cooling of the stratosphere by increased GHGs in the troposphere, that may be less important. For the ozone depletion by CFC’s, that is relative highest near the poles. That should increase poleward flows in the lower stratosphere/higher troposphere. See: e.g. http://www.nature.com/cgi-taf/DynaPage.taf?file=/nature/journal/v382/n6592/abs/382616a0.html . But http://www.amath.washington.edu/research/articles/Tung/journals/interannual.pdf doesn’t support any change in planetary waves in recent decades (at least not in early winter)…
How that relates to solar activity, with highest changed in the tropics remains to be seen…