We are forever being bombarded with apparently incredible correlations of various solar indices and climate. A number of them came up in the excoriable TGGWS mockumentary last month where they were mysteriously ‘improved’ in a number of underhand ways. But even without those improvements (which variously involved changing the axes, drawing in non-existent data, taking out data that would contradict the point etc.), the as-published correlations were superficially quite impressive. Why then are we not impressed?
To give you an idea, I’m going to go through the motions of constructing a new theory of political change using techniques that have been pioneered by a small subset of solar-climate researchers (references will of course be given). And to make it even more relevant, I’m going to take as my starting point research that Richard Lindzen has highlighted on his office door for many years:
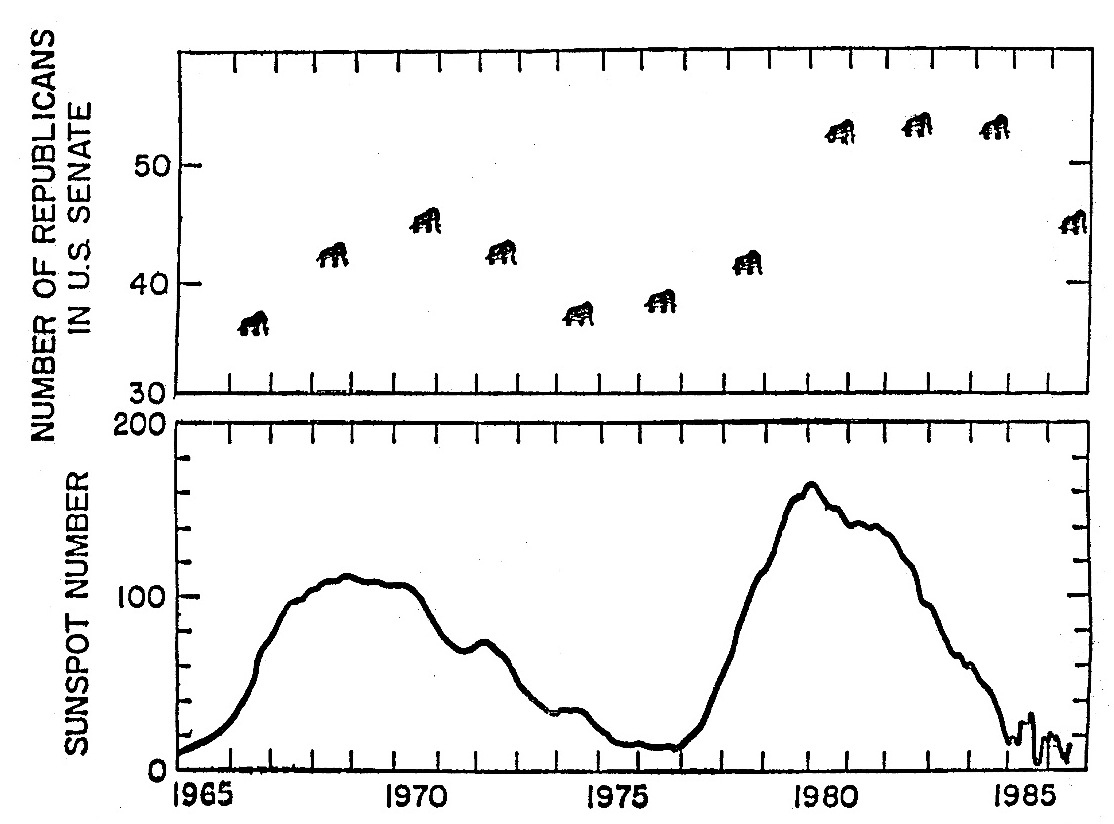
That’s right. Forget the economy or the war(s), the fortunes of the Republican party in the US Senate are instead tied closely to the sunspot cycle.
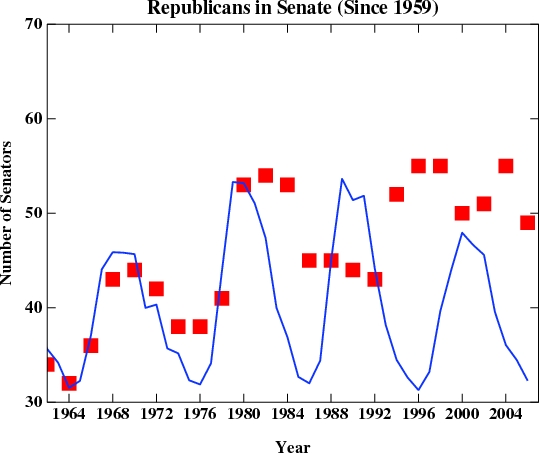 “Oh yes”, the sceptics might say “but that’s just a couple of cycles and doesn’t use up-to-date numbers. What happens after 1986?”
Well, that is a little problematic, however, the good early correlation is obviously still important (r=0.52! 1960-1986) and so we should be able to refer to it over and over again without noting that it breaks down subsequently (cf. Svensmark, 2007 referring to Marsh and Svensmark (2000)). But more importantly, it just demonstrates that the theory needs a little adjustment.
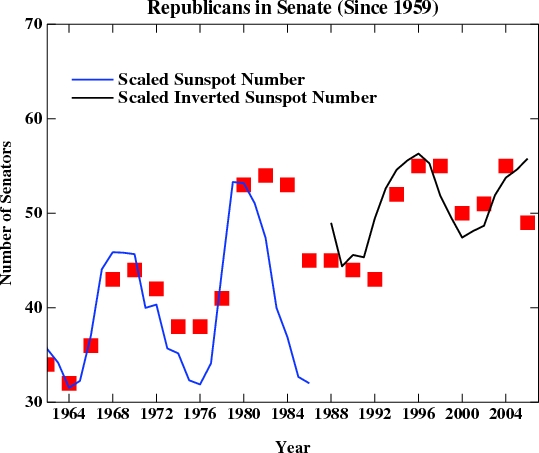
Let’s look at the second half of the record. Well, there’s another strong correlation for that period as well (r=-0.63, 1988-2006). Only this time the correlation is inverted, but that shouldn’t be surprising to anyone – solar-senator effects are complicated!
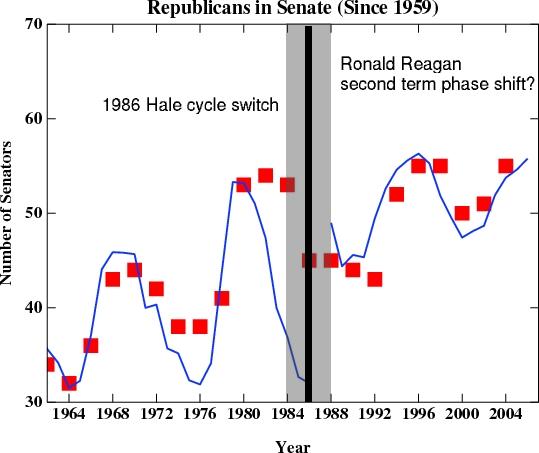
 If we now put it all together, we can see that there is a reasonable match over the whole period…. well, except that break in the period 1984 and 1988 and, unfortunately, last year’s elections didn’t fit the pattern either. But 1984-1988 was Ronald Reagan’s second term and clearly no theory of Republican senators can ignore that. We therefore propose that the ‘Ronald Reagan second term phase shift’ combined with the change of sign of the Hale solar magnetic cycle in 1986, obviously changed the dynamics. This kind of phase shift is frequently seen in solar studies (cf. Landscheidt and many others), where it is rarely taken as a sign that two time series with decadal spectral power are in fact completely independent. Finally, it is permissible to leave off the more recent data points (cf. TGGWS) for “graphical convenience”. So after just a little work, we have managed to rescue the original theory to match a much longer amount of data:
Some readers may scoff and suggest that in the absence of any mechanism, these powerful correlations are numerological artifacts arrived at using post hoc fallacious reasoning that have no predictive capability. That might appear to be a valid argument. However the ultimate test will of course be experimental. On the basis of these intriguing results, we propose exposing Republican senators to varying levels of cosmic rays in a basement and monitoring their electability. Any refusal by the funding agencies or ethical review panels to support this would simply be confirmation that the political science establishment are scared of what this research would imply for their so-called “consensus”.
Convincing, eh?
The data for sunspots and senators can, I’m sure, be manipulated even more effectively than I’ve done here. I’ve made no use of various lags or filters (which can be altered as you go along cf. Friis-Christensen and Lassen (1991)), or of partial detrending (cf. Marsh and Svensmark (2003)), or of splicing of unconnected data sets (cf. Svensmark and Friis-Christensen 1997, Nir Shaviv). More ideas could be taken from “New evidence for the Theory of the Stork” (Höfer et al, 2004)”. A special RealClimate commendation for anyone who can do better!
Ingilizce’den çeviren Figen Mekik
Güneşle ilgili çeşitli indislerle iklim değişikliği arasinda görülen ve görünürde inanilmaz olan korelasyonlarla sık sık saldırıya uğruyoruz. Hatta bu korelasyonların nasıl gizemli ve el altından yollarla daha da harika hale getirildiği, “Büyük Küresel Isınma Aldatması” adlı filimle dalga geçen bir yayında geçen ay ele alındı. Ama bu islah yöntemleri (mesela, eksenleri değiş tokuş etmek, var olmayan veri noktalarını grafiklere eklemek, istenilen eğilime uymayan veri noktalarını çıkarmak gibi) kullanılmadan dahi “yayınlanan bilgiler” yüzeysel olarak etkileyici hani. Peki biz neden etkilenmedik o zaman?
Size bu konuda fikir vermek amacıyla, güneş/iklim bilimcilerinden küçük bir azınlığın öncülüğünü yaptığı metodları kullanarak (ve gerekli yerlerde atıflar da olacak tabii) yeni bir siyasi yaklaşımın üretilmesini amaçlayan bir egzersiz yapacağım.. Ve konumuza daha da uygun olsun diye, Richard Lindzen’in ofis kapısını pek çok yıl süsleyen bir grafik ile başlayacağım:
Evet, doğru okudunuz. Ekonomi veya savaşları unutun, Cumhuriyetçi partinin kaderini güneş lekelerindeki evreler belirliyor.
“Tabii ama” diyebilir inanmayanlar “bu grafik sadece bir iki evrede uyum gösteriyor. 1986’dan sonra uyum bozuluyor.”
Evet, bu doğru tabii. Ama grafiğin sol kısmındaki iyi korelasyon hala kayda değer (r = 0.52! 1960-1986); dolayısıyla, sonra nasıl bozulduğunu göz ardı ederek buna sık sık atıf yapabiliriz (mesela Svenmark, 2007’de Marsh and Svenmark 2000’den bahsettikleri gibi). Ama daha önemlisi, bu sadece kuramımızın biraz ayarlanmaya gerek duyduğunu gösteriyor.
Grafiğimizin ikinci yarısına bakalım. Eh bu dönem içinde güçlü bir korelasyon var aslında (r = 0.63, 1988-2006). Ancak bu sefer korelasyonumuz ters. Ama bu kimseyi şaşırtmamalı. Güneş – senatör ilişkileri karışık malum.
Şimdi hepsini bir araya getirirsek, bütün süreç boyunca güzel bir uyum olduğunu görebiliriz…. 1984 ile 1988 arasındaki boşluk hariç tabii, ama maalesef, geçen yılki seçimler de bu trende uymamıştı zaten. 1984-1988 arası Ronald Reagan’ın ikinci dönemiydi. Tabii ki hiç bir Cumhuriyetçi senatör bunu göz ardı edemez. O zaman şu savımızı ileri sürüyoruz: “Ronald Reagan’ın ikinci dönem faz kayması” ile 1986’daki Hale güneş manyetik devresinin işaret değiştirmesi buradaki dinamiği bariz bir şekilde değiştirdi. Bu tip faz kaymaları güneş çalışmalarında sık sık görülür (mesela Landschmidt ve pek çok başkaları), ve çok nadir olarak bu olaylar iki, bağımsız onyıllık spektral güç olarak algılanır. Son olarak, daha yakın zamana ait veri noktalarını grafiğimize koymamıza da müsaade var (mesela Büyük Küresel Isınma Aldatması gibi) ki grafiğimiz sık dursun. Yani biraz çalısmayla, temelde savunmak istediğimiz kuramı, daha uzun süreli verilerle destekleyerek kurtarabildik.
Bazı okuyucularımız diyebilirler ki herhangi bir mekanizma öne sürülmeden gösterilen bu güçlü korelasyonlar bir matematik oyunundan başka bir şey değil; ve hatta diyebilirler ki yanlış ve güdümlü bir mantıkla elde edilen veri eğilimlerinin hiç bir değeri yok. Bu mantıklı bir iddia gibi görünebilir. Ancak tabii ki deneyler yapmadan nihai sonuçlara ulaşmak mümkün değil. Bu çok ilginç sonuçlarımızı temel alarak, Cumhuriyetçi senatörleri çeşitli kuvvette kozmik ışınımlara maruz bıraktıktan sonra seçilebilirliklerini ölçmeyi öne sürüyoruz. Bunu yapmamıza engel olmak isteyecek fon veren kuruluşların veya etik kurullarının tutumu, sadece siyasi “fikir birlik”lerini bozulacağından korktuklarını gösterir.
Inandırıcı, değil mi?
Güneş lekeleri ve senatörlerle ilgili veriler muhakkak ki benim yaptığımdan daha güzel kurcalanabilir. Ben, çeşitli gecikme, filtre (Friis-Christensen and Lassen, 1991), bazı eğilimleri giderme (mesela Marsh and Svensmark, 2003) veya birbiriyle alakasız veri tabanlarını ayırma (mesela Svensmark ve Friis-Christensen 1997, Nir Shaviv) metodlarından hiç birini kullanmadım. “Leyleğin neler getirdiğine dair yeni veriler” (Hofer ve diğerleri, 2004) adlı eserden başka fikirler de edinebilirsiniz. Benden daha başarılı veri kurcalama yöntemleri gösterebilecek okurlarımıza özel tebriklerimiz olacak.
Hmmm, … OK … explicit link in #349 above that this forum mysteriously screws up – looks like a deficiency in the even more mysterious “securebar.secure-tunnel” wotsit thing:
Screwed up link:
https://www.realclimate.org/index.php/archives/2007/02/save-the-world-earn-25-million/#comment-28597
In context appearance of link:
” …
P.S: Are the “resident” gurus who contribute here, just naturally rude, or just really really busy? I asked what I thought were some reasonable questions ages ago in another RealClimate forum, and after just one other not very helpful and really not too sensible reply that seemed to completely ignore enthalpies of formation, etc. that forum was shut down for further posts – and thereby any answers to the questions posed there that I could easily find. Any chance anyone here can address the questions there?
I’m busy too, so can’t be bothered re-formatting the post, so here’s the [explicit] link to it:
https://www.realclimate.org/index.php/archives/2007/02/save-the-world-earn-25-million/#comment-28597 “
Mr. Revell asked in the other thread a lot of questions. You can find most answers to FAQs with the search box, top of the page.
> who has entered, R. Branson’s Virgin Earth Challenge
Try his website or Google
> Anybody know where I can get a [reference mentioned] – I mean without having to pay?
Ask your local public library Reference Desk; if not available, they will be able to borrow a copy via interlibrary loan.
>How do you get an article/paper published here?
None are. See Contributors’ links on right side for their publications.
Most of us posting here are just interested readers.
So, my comments do not ‘pass the test’. In any case I suggest you read Three Men in a Boat by Jerome K Jerome. That’ll cheer you up. The future’s not so bad.
PHE (#353) wrote:
The future?
I am still hoping that it hasn’t been written yet – or at least not the last few chapters of it. But if I need some cheering up or just wish to enjoy myself for a short time, Babylon 5 generally does the trick for me. At this point I think I will spend some time with G’Kar, Londo and Vir. Or maybe I will watch the first movie.
Hank, the time scale for the first two is on their axis (doesn’t read well-agreed), and is between 1000 to ~2000 AD. This link is working
http://pg.photos.yahoo.com/ph/dimispoulos/detail?.dir=7156re2&.dnm=6de4scd.jpg
Re. #38:
You give the impression here that there are several competing “standard models” that all propose to explain the single phenomenon of supernovae, but that isn’t how supernova science works. There are many different types of supernovae, and some have very different physical causes than others. SN2006gy is evidence not for an “alternative model,” but for a new type of supernova that has been proposed before, but never observed (until, perhaps, now).
Just wanted to set the record straight!