Recently, I received multiple requests to discuss a paper, due to appear in Journal of Geophysical Research (JGR-atmosphere), that has been presented in the media just before the Bali conference and the Nobel Peace prize ceremony here in Oslo, Norway. The paper concludes that the warming measured over land is most likely exaggerated due to non-climatic effects, and it presents a regression analysis suggesting that the real (climatic) global mean temperature trend should be ~50% lower over land.
So, are the surface temperature trends inflated? This new paper by McKitrick & Michaels (henceforth ‘M&M2007‘) is a followup of an earlier paper they wrote in 2004 in Climate Research (MM2004a), which I discussed in my first RC post (Are Temperature Trends Affected by Economic Activity?) and in a commentary in Climate Research (Benestad, 2004).
So what’s new? Let’s backtrack a little and recount some of the previous arguments.
One of my main concerns then was that their analysis had not taken into consideration the dependency between the data points, as the temperature exhibits non-negligible spatial correlations. Furthermore, data from the same country were compared with the same national value in terms of economic indices. It was a bit like doing a poll by asking 10 people the same question 100 times and then claiming that it’s a survey with a sample size of 1000.
In 2004, M&M2004b said they were unaware of any paper in the refereed applied climatology literature that had performed a test where half the data was excluded when doing the model calibration and the rest was left for model validation. I guess that they were not really up-to-date then, because that has been a standard approach for a long time.
But this time they have split the data sample and used a part for validation, which I suggested in my comment in Climate Research. But they have not done it properly this time, and they still do not eliminate the effect of dependency. They split the data by randomly picking points which were either used for training the data or validating the model, thus data from adjacent sites which are related will end up in the different batches for training or validation.
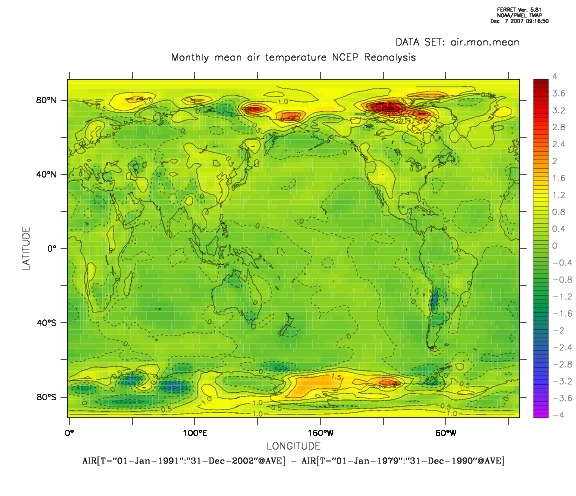
The map above shows a simple estimate of the temperature change over the 1979-2002 period (here taken as the differences in the mean over two sub-periods and the National Centers for Environmental Prediction (NCEP) re-analysis have been used instead of the CRU data), and it’s easy to see that the warming varies smoothly from location to location. In other words, the trend estimates have significant spatial correlation.
The fact that they used sea-level pressure (SLP) data from (1974) because they could not find more recent data, suggest that they still are not up-to-date. Updated data, such as the National Center for Environmental Prediction SLP, have long been available from NOAA Climate Diagnostics Center. Furthermore, a wealth of up-to-date climate data are available from the KNMI (Dutch Meteorological Institute) ClimateExplorer.
Their regression analysis appears to suffer from over-fitting, since they have thrown in a lot of variables (both ‘meteorological’ and ‘economical’) for various vague reasons.
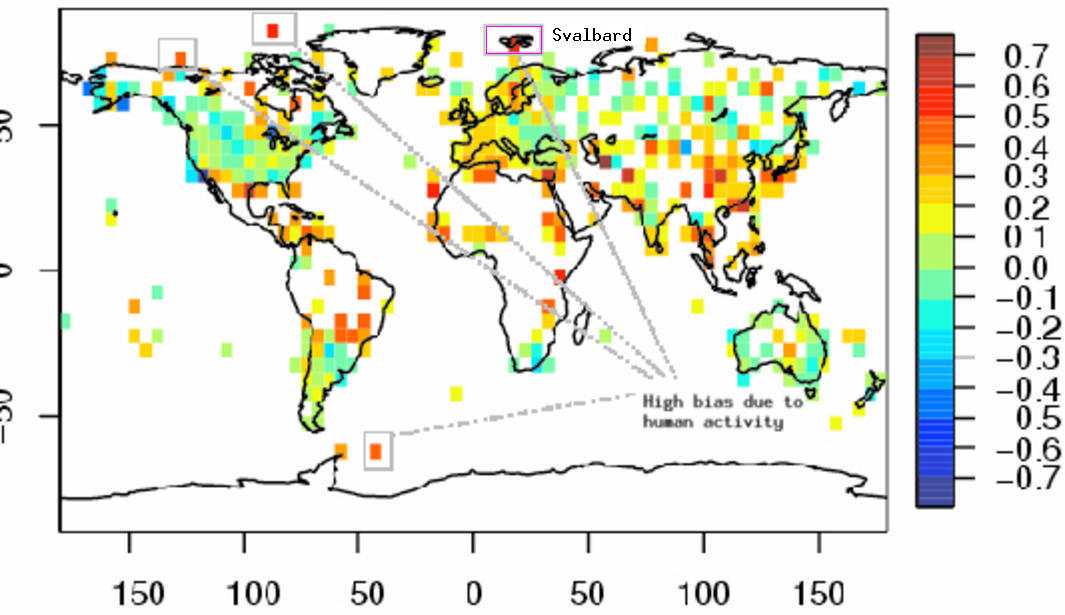
Not surprisingly, their analysis produces some strange results as a result of this shortcoming. They find that the greatest differences between measured and adjusted trends at Svalbard and other places in the Arctic and Antarctic (See marked sites in Figure below). This is not convincing. Thus, the results themselves provide examples of spurious values obtained by their analysis. Even if they were identified as ‘outliers’ (Svalbard was apparently not one), the fact that their analysis produced highest corrections for economic activity at these places suggest that their analysis is not very reliable.
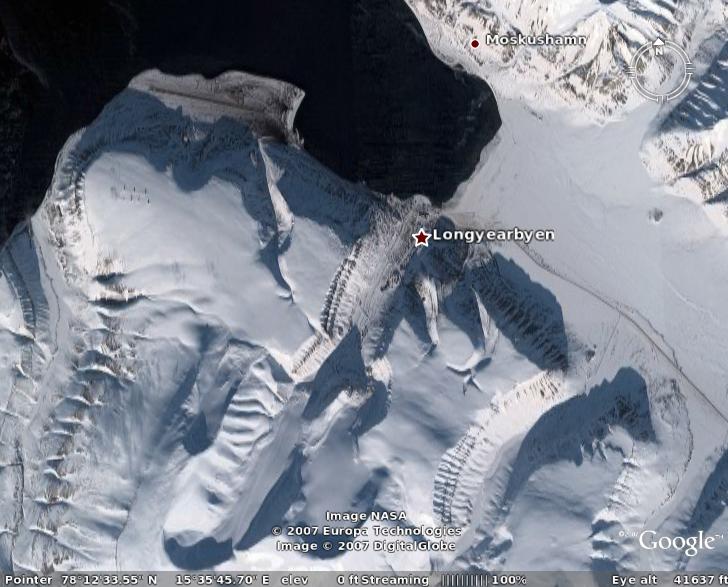
The graphic below shows a Google Earth image of Svalbard, which is one of the sites marked in the map above with a large trend correction due to economic activities.
I have not examined the economic data, but it appears that M&M2007 maybe cannot win – either (i) the spatial distribution of the economic indices are equally smooth and M&M2007’s attempt to account for dependencies within each country fails to resolve the problem of dependency between the countries, or (ii) the economic indices vary abruptly from country to country and thus have very different spatial scales and structures to those seen in the warming trends. Either option suggest that their analysis may lead to spurious results, over-fit, or suffer from inter-dependencies.
I also think that M&M2007 is biased and gives an incorrect picture, as they do not discuss the fact that also the world oceans are warming up, and whether any economic activity can take the blame for that. I think it is difficult to argue that factors such as the urban heat island effect plays an important role here.
They do not mention my criticisms raised in Benestad (2004) either, which discussed a number serious concerns about their previous study; They merely state, as if it were a matter of fact, that urbanisation and economic activity has been shown to affect local and regional temperature measurements – citing their old criticised paper.
Their analysis relies on University of Alabama-Huntsville (UAH) satellite data (Microwave Sounding Unit, MSU) with a weaker global trend than others, and neglect to examine or even mention other products such as the Remote Sensing System (RSS) data. The difference between these data sets are discussed in previous RC posts (here). They reckoned that any of their results would not be contingent on the choice of MSU product, but did not test this hypothesis.
It should also be kept in mind that their analysis involved too short time series (24 years) for a proper local trend estimation, as local circulation variations (e.g. the North Atlantic Oscillation), the annual cycle, and inter-annual variations, most likely will make the analysis more difficult. Climatic time series from single locations tend to be very noisy, but a clear signal emerges when taking the global mean (by taking the mean, random noise tends to cancel to some degree).
I find it a bit ironic when people use satellite data measurements to argue that GHG is unimportant. They rely on the fact that these measurements are derived using the very same type of physical laws as those predicting an enhanced greenhouse effect due to increased GHG levels (neglecting feedback processes).
I think it’s good that M&M2007 put a focus on the problem with data paucity and quality. There may very well be some non-climatic effects contaminating the measurements, but I am not convinced by their analysis.
So in summary, I think the results of M&M2007 analysis and conclusions are invalid because
– They do not properly account for dependencies.
– They over-fit the regression.
– Their results look unreasonable.
– They “cherry pick” the MSU data that gives the lowest trend
Over-fitting: Re. Rasmus, Ross McKitrick @34, Jean @39,
Although I have reservations and criticisms of the model generally, I think the concerns about over-fitting are over-done. Over-fitting usually results in models which follow data noise well but have large errors on parameter estimates and poor predictive precision. It will not however have much influence on the global test of the null hypotheis, which is stated in the abstract as:
“…the null hypothesis that the spatial pattern of temperature trends in a widely-used gridded climate data set is independent of socioeconomic determinants of surface processes and data inhomogeneities.”
This hypothesis is rejected with a p=7.1*10^-14.
My bigger concerns are with the model itself. Two of which Rasmus has stated:
1) Failure to appropriately incorporate spatial correlation of temperature measurements. This will result in exaggerated p-values.
2) Poor model fit for land areas at extreme latitudes. This is evidence of outright model failure – the model does not fit the data as it is inappropriate.
And an additional issue:
3 Omitted variable bias.
http://en.wikipedia.org/wiki/Omitted_variable_bias
This is a bias that appears in parameter estimates – such as the effect of economic activity on local temperature measurement in Ross’s model – that is due to the omission of a variable that is better able to explain the relationship between location and temperature. Such a variable might be hemispheric effects, or oceanic effects that extend beyond coastlines.
Essentially omitted variable bias is a type of poor model specification that results in biased estimates of model parameters even when the model fits the data.
Re. Gavin @11 and my earlier comment about omitted variable bias.
Gavin’s concerns about tropospheric ozone and black carbon emissions having local forcing components is another example of omitted variable bias. A fitted model that excludes these will attribute these forcing effects to other variables in the model which have large values at the same locations, such as GDP.
Anyone care to hazard an estimate of the percentage of human induced CO2 of the 100 ppmv that finds its way into the +.7 observed trend in the mean global anomaly?
[Response: That’s not a well-posed question. See here for a discussion. – gavin]
Charles Muller wrote
> what is Pathfinder Satellite? (the link leads to
> another discussion without a precise reference …
the discussion includes this reference:
http://earthobservatory.nasa.gov/Newsroom/NasaNews/2004/2004042116878.html
and at the bottom of that page
> For more information and images … visit:
http://www.gsfc.nasa.gov/topstory/2004/0315skintemp.html
Charles Muller (#43) wrote:
The link was to my earlier comment that included a relevant quote and the link to my source:
April 21, 2004
Earth Observatory: NASA News Archive
Satellites Act as Thermometers in Space, Show Earth has a Fever
http://earthobservatory.nasa.gov/Newsroom/NasaNews/2004/2004042116878.html
I simply didn’t want to duplicate the quote.
Charles Muller (#43) wrote:
Pathfinder was using skin temperature — which is actually closer to the surface than land-based.
They state:
Anyway, it wouldn’t surprise me if lower trop and ground-based were actually closer to one-another. In fact, I seem to remember they are almost the same — at least for the continental US — but I will have to check. However, I do remember there is somewhat greater variability with lower trop — the hot years tend to be higher.
Charles Muller (#43) wrote:
Certainly it is detectable. But it is also in very large part accounted and corrected for.
In 26, I had stated:
… and I gave additional sources, as well as pointed out that we knew about Barrow in 1983. Somehow I suspect the UHI at Barrow has been corrected for. In any case, there are a fair number of corrections made depending upon location, altitude, etc. There is the law of large numbers which cancels out much of the local variation. Then there is also the Park Cool Island effect. All of this is covered in a fair amount of detail in the paper by Peterson. I believe it has become a classic.
In any case, pointing out literature which shows and details an Urban Heat Island effect isn’t sufficient for criticizing the estimated trends in temperature. One needs to show that the features of UHI have not been accounted for, that they are not cancelled out by various corrections made to the data in combination with the law of large numbers, etc.. But oddly enough, climatologists at NASA GISS seem to keep up with the literature and know what needs to be accounted for, typically. I suppose this might be because it is their job.
Re # 37 Hank Roberts: “Can we assume the journal’s peer reviewers approved the online preprint version? I am not sure why they differ.”
I don’t know about J of Geophysical Research, but here is Science magazine’s policy on online rapid publication (Science Express):
“Each week, Science selects several papers for rapid online publication in advance of the scheduled print publication date. These papers are published essentially as supplied by the authors, with minimal copyediting by Science; a fully copyedited version appears later In print.”
http://www.sciencemag.org/about/authors/prep/gen_info.dtl#express
Bruce Tabor (#44) wrote:
I would think that if you wanted to check for the accuracy of global temperature trends calculated by means of ground-based observations using satellites, you would calculate the the global average trend using satellite measurements, e.g., Pathfinder, then compare. The same would hold for latitudinal averages.
Bringing in additional factors such as economic activity, etc. simply overcomplicates the math and introduces more opportunities for losing or distorting a signal that can be obtained in a fairly straightforward fashion. But I suppose this is what is meant by “over-fitting.”
Re 34 McKitrick
“the oceans are not an issue here”
Being less polite than Chris, oceans provide a simple bull(you know what) test of the hypothesis. It fails.
It seems obvious to me also that MSU data, in so far as it is affected by surface temperature has to average over very large areas.
Would it be not easier to disprove the effects of UHI’s by simply using Antarctica, Arctic data as well as every remote location on Earth? There is no argument in these stations about economics, unless they have been massively paved for no reason. As a pure form of temperature trends there are none so potent. Being in a very remote location, I already know that there is a strong warming, Most people need not be knowledgeable about the real finer climate details which get marred in mud on purpose, the more compelling arguments are simple and straightforward.
Like November 2007 NASA GISS Latitude analysis, North of 60 North was the strongest warming
http://data.giss.nasa.gov/cgi-bin/gistemp/do_nmap.py?year_last=2007&month_last=11&sat=4&sst=0&type=anoms&mean_gen=11&year1=2007&year2=2007&base1=1951&base2=1980&radius=1200&pol=reg
How many big cities contributed to that result? BTW With Nov 07 in , 2007 is the warmest year in history for the Northern Hemisphere, a lot of this warming was well away from mega cities.
In the past few weeks, RC has offered criticism of Scafetta, Loehle and McKitrick. As the comments poured in, I found my eyes rolling at the cheerleading of the RC groupies. The most valuble responses came from the authors themselves, defending their work and responding the the criticism.
So my thought is this, when doing such a post, wouldn’t it be most valuble to invite the author to respond, and close the comments to all others at least for a little while. I would love to see a little back and forth between author and critic. Then the comments could be opened to the RC admiration society for some typical back slapping and piling on.
Re 50
Perhaps you can make useful contributions in showing where the RC team went wrong, instead of the typical “RC groupy” attacks. The 3 works were bad science, and in my opinion show a breakdown of peer review. To say the least, they were not defensible; to say the worst, I think people out there are concerned only with forwarding certain notions and will do what it takes to get the madvanced (like up the solar contribution, up the UHI contamination, up the MWP) I would almost like to see an article on the peer review process and what is going on now.
RealClimate is doing a great job here. Other blogs are dedicated exclusively to bashing other peoples work and generally by people who do not sit on the mainstream of that work. Scientific-sounding but content-free material going around the internet is probably not a good thing, and I thank RC for going over the material.
Lucky (#50) wrote:
As someone who you would probably regard as one of the groupies, while I may not like the way you put things all that much, you have brought up an interesting idea. A discussion between the authors and the contributors could form the backbone of later discussion, giving it more structure and making it less likely to veer off into unrelated topics once the “groupies” and “anti-groupies” come in.
On-topic there is a better chance for a process of discovery. Offtopic things can easily turn into bullsessions. It would provide a better opportunity to learn — and I think the caliber of discussion that would be possible may be something that the contributors would enjoy.
But obviously this will be up to the contributors and the authors. Perhaps letting the authors know that their papers will be discussed either way will mean they will be more likely to attend.
re rasmus response to #18
1. Got any nice pictures of the thermometer clear of the tarmac?
2. re
“Other measurements from nearby sites, such as Ny Ålesund, Sveagruva, Hopen & Bjørnøya, show similar warming as Longyear byen.”
– Is this measurement data available online?
3.re
“There is no economic activity near these sites, except for at Sveagruva.”
– Got any nice pictures?
[Response: The measurements are being done very carefully. High-quality stuff. -rasmus]
# 50 Lucky
What if the author in question doesn’t respond?
“Cheerleading?” “Groupies?” “Admiration society?” “Backslapping?” “Piling on?” I think Real Climate is being confused with another site with “climate” in the title.
You assume a couple of things that have not been proven to be accurate.
1. Those commenting aren’t competent to do so. There are several physicists and at least one professional statistician here who are clearly competent to comment, and whose comments aren’t simply “cheerleading”.
2. You assume the authors of these denialist pieces are honest, and therefore are open to honest discourse. [edit]
There was a great thread over in Tamino’s blog … [edit]
[Response: No more on this please. -gavin]
cce (#54) wrote:
I agree it was put in a rather derogatory fashion, and likewise it isn’t very descriptive of what goes on here. But the author may have had a good idea nevertheless — despite himself. Different objectives require different methods and different approaches. I believe being more systematic and more methodical — perhaps even going section by section — might serve ours. One slight modification might be in order, though: limited, non-leading questions from ordinary participants. Just a thought.
Anyway, it certainly isn’t my decision.
Re 51
I didn’t say they went wrong, I just think it would be best for the authors to be the first ones to address the criticism.
Re 52
Backbone and structure would be great. BTW groupie isn’t necessarily a bad thing, way back when I was playing Rugby, I loved the groupies.
Re 53
If they don’t respond, open it up.
Re 55
I didn’t assume anything. Yes, my eyes often roll when reading CA. They have groupies and cheerleaders as well. You resent the groupie characterization, but you freely to throw out denialist and liar. We are all entitled to our own opinion.
I know the RC scientists can handle a one on one, I am sure the authors in question can handle it, and I think that a brief closed discusion would be very enlightening. Then open comment.
I have found a very informative site with hundreds of articles on every phase of climate change in — sciencedaily.com, a great adjunct to real climate and reports stretching back for many years. Your contributers ought to check this one out.
More Svalbard:
#18, from Rasmus:
…umm, far right
#22:
No, it’s way out of shot, to the right.
The Svalbard Luft record is plotted here as monthly anomalies, alongside another older, but rather distant, record. Read the y-axis scale…
As it is the correlation between the surface and the lower troposphere (TLT) records are ~90%, but even though the areas compared (5o x 5o) are quite large, I’ll bet that a more sophisticated analysis, for example, using some sort of weighted averaging for neighboring boxes would be better.
One’s first thought on the surface ground correlation would be that it should be high, because of a near radiative equilibrium between the ground and the lower troposphere (they are exchanging energy rapidly by radiation), which leads to the further thought that this equilibrium would be perturbed by clouds, and that unless the effects of cloud cover is controlled for the whole thing is spinach.
GlenFergus (#57) wrote:
I guess you are right. I had hit one, and silly me, I thought that was the only one. But in an extreme climate you would undoubtedly have more than a few. And the airport would be a great place for recording temperatures, far removed from the rest of town.
Thanks!
Having now perused the article and digested its contents and methodology, I had the following very general thoughts:
1)The very complexity of the model seems to make it almost inevitable that spurious correlations will develop in the data. Science is replete with admonitions to avoid unnecessarily complicated models-from Occam’s “I will not multiply causes…” to von Neumann’s “Give me 4 parameters and I will fit an elephant; five and I will make him wiggle his trunk.” It is crucial to ensure that the added complexity actually adds information and doesn’t just become an exercise in “curve-fitting”. Climate models do a very good job of constraining their forcings and parameters independently of trends they are trying to model. I don’t see much “theory” guiding this model and the types of correlations it is seeking.
2)An example of the type of spurious correlation that concerns me is this: We know that the industrialized countries are disproportionately in the north of the Northern Hemisphere. This is precisely where we expect to see the most economic activity and where climate models also predict the most warming (due to geographic features–e.g. greater land mass, polar amplification…). Could it be that the article merely rediscovers this well known fact?
3)It is a mistake to lump all “economic activity” together. Deforestation and Reforestation are both economic activities, but presumably have opposite effects. Economic growth fueled by manufacturing would presumably have a different signature than economic growth fueled by e-commerce…
4)To suggest that warming is half of current estimates is actually quite surprising. As pointed out above, this would put it below estimates for the Oceans–physically unreasonable. Also, we know we are starting to see signs of significant feedbacks–saturation of the Ocean’s ability to take up CO2, outgassing from melting permafrost, and these are occurring in areas that are far from economic development.
5)As emphasized repeatedly, GHG forcing is pretty well constrained. If we’ve seen only half the predicted warming, where’s the rest of it. Is physics wrong? Is it being masked by some other factor? If so, will it kick in with a vengeance at some future date? Since I don’t think physics is wrong, I would point out that even if M&M2007 were correct, the implications might be much more alarming than reassuring.
Finally a response to “Lucky”: Like it or not, Lucky, this is how science gets done. You throw your ideas to the wolves of the community. Some of them wind up as “wolf muscle”. Some wind up as wolf crap. The measure is found in the subsequent influence they have. M&M2007 is unlikely to be cited in very much future work, primarily because it is not that useful. There are flaws in the methodology and validation that call the results into question. More importantly, though, it makes the claim that data are contaminated but does little to indicate the nature or origin of those contaminations or what to do about them. Had their goal been to shed light on the issue they purport to treat, I suspect a less ambitious project might have had more influence. Instead, I think their goal is to say the problem doesn’t exist. However, as pointed out above, even ef their contention were right (and this is doubtful), its implications could be grim rather than reassuring.
Re # 37 Hank: “Can we assume the journal’s peer reviewers approved the online preprint version? I am not sure why they differ.”
I tried responding to this yesterday, but the post got lost in the ether (AGW denialists and skeptics take note: Even RC groupies sometimes don’t get their comments posted):
I don’t know about the Journal of Geophysical Research, but here is an excerpt from Science magazine’s policy on rapid online publication (Science Express):
“Each week, Science selects several papers for rapid online publication in advance of the scheduled print publication date. These papers are published essentially as supplied by the authors, with minimal copyediting by Science; a fully copyedited version appears later In print. …”
If the JGR policy is similar, this could explain the discrepancy you noted.
Ray, you read the full article, can you answer the question I asked way back at #37?
> It is not true that our discussion of the effect
> of urbanization and land-use change rested only
> on our 2004 paper. In the on-line preprint …
Can we assume the journal’s peer reviewers approved the online preprint version?
In reply to #37, Yes, that is the approved version.
#50: I suspect the readers would appreciate such an exchange as well. It is essentially what happens when a comment is submitted to a journal, which remains the most appropriate way to address technical challenges.
For those who are convinced that the paper and its results are just wrong, wrong, wrong, you have to put your arguments into the form of a testable hypothesis. My paper takes the hypothesis that local temperature trends are independent of local economic activity and shows that it fails a test. Various speculations have been offered above to the effect that surface data are not contaminated but these test scores could nonetheless be obtained under restricted conditions. Maybe you’re right, but you’re going to need an encompassing statistical model to show it.
Ray (#63) – we control for latitude, not to mention the tropospheric trend at each latitude. Unnecessary complexity of a model does not usually lead to spurious gains in significance, it more typically leads to collinearity and loss of significance. That’s not a problem here, and we do test for spurious correlations. On your 3rd point, we don’t lump all economic activity together, we include a variety of indicators to pick up both cross-sectional and rate-of-change effects. You seem to be objecting that the model is both overspecified and underspecified.
Bruce (#44) – If the problem is omitted variable bias it should be easy to prove. Raising the mere possibility of it doesn’t make for much of a counterargument, since any regression model could suffer from it, and you can’t prove its absence. The IPCC suggested (Chapter 3 page 244) that the correlations are due to naturally-caused coincidence:
So you could add controls for AO, NAO, PDO etc to my statistical model and — if the IPCC is right — the socioeconomic effects will vanish. Or maybe Eli is right (#61) and it’s all due to cloud cover.
But then again, maybe not. And considering what rides on this data set not being contaminated, I hope the practitioners in the RC audience will agree that the issue deserves some serious attention rather than just casual dismissal.
[Response: The seriousness of our attention goes in inverse proportion to how the authors spin their results. In this forum, you are all about the investigation and understanding, yet in the National Post op-ed you instead claim that the surface temperature rise is “an exaggeration” (no ifs, no buts, no caveats about the existence of other possibilities) and that the IPCC “concedes … that … its main data set is contaminated”. This is completely untrue. I would suggest that your hyping of this result is a big disincentive to other researchers taking your hypothesis seriously. – gavin]
Hank, I’m afraid we won’t know until they actually publish. The “date received” and “date published” might provide a quick indication, as a long lag may indicate that the article went through significant revision. However, I’d be surprised if there were major substantive differences. The suggestion that the new references support the contention of the 2004 paper struck me as a little bit stretched.
#65 in addition to Gavin’s comments. What about the far North? Are +10 C monthly anomalies an exaggeration or an error? And the over all not so small Polar temperature trends a mistake? The push to claim GT temperature trends as a UHi mistake completely falls apart with data from remote stations.
Why not look at remote stations data alone? The case will be closed if it was so.
I don’t (amateur reader here) see how this approach avoids just equating fuel use and economic activity.
This chart for example — if you didn’t have the label, what would you think it described?
http://web.whittier.edu/academic/math/jmiller/United%20States%20National%20Debt_files/usdebt1.gif
I myself wouldn’t be at all surprised if there is a correlation between local economic activity and local temperature trends. My question is, “How would you determine the direction of causation?” Does economic activity affect apparent trends in temperature, or do actual trends in temperature affect economic activity?
We are dealing with climates that are barely habitable in the latitudes under consideration. Furthermore, if all we were concerned with was a static economic activity, this would not result in a higher apparent trend in temperature. To have a higher apparent trend in temperature as the result of some Urban Heat Island effect, one has to have economic growth. But since we are dealing with arctic regions, any small increase in temperature will make possible considerably more economic growth, e.g., growing broccoli and strawberries in Greenland.
Consider the following…
Theory: in subarctic regions, the rate of increase in economic activity will show a strong positive correlation with the rate of increase in temperatures as higher temperatures decrease costs and make available more resources, e.g. days in the growth season. Null hypothesis: no such correlation exists. Test: check for correlation. Result: a strong correlation exists.
Question for Ross McKitrick: how does one distinguish between the theory that actual higher temperatures result in increased economic activity vs. increased economic activity resulting in spuriously high temperature readings?
I hadn’t read McKitricks Op-Ed before I made my comment #41 and see now that it contains some loaded, or non-objective,words and phrases, such as the word manipulations in the first paragraph, referring to the temperature graph at the end of the op-ed. Later on he refers to the “biases of their lead authors” of the IPCC. Hardly an objective or good faith criticism.
I know that both sides refer to the word contamination when referring to unadjusted data, which I think is too strong and gives a wrong impression. Contaminated connotes impurity or infectation. When economists make statements like ‘the price of gas in 1995, adjusted for inflation to 2007 $’ no one infers that the 1995 data is infected. When correcting fathometer soundings,many years ago, for the purpose of making coastal charts, by taking nansen bottle casts to compensate for temperature and salinity adjustments for the speed of sound in water, we didn’t consider the raw data as infected. Astronomers correct for lens and atmospheric effects all the time.
Almost all raw data require known corrections and adjustments. Adjustments for UHI are no exception.
#65 Ross/Gavin
Partisanship is a truism in the discipline of climate science. There seems no getting away from it even from the most authoritative voices. Gavin is correct that Ross’s National Post op ed clearly represents strong views which of course makes for interesting reading, whether it is right, wrong, exaggerated or incomplete. Let the reader beware. Gavin, you are guilty of the same partisanship editorializing. Your defense of Al Gore’s movie is case and point.
There are facets in the M&M2007 paper that are worthy of further analysis and research regardless of partisan views. What has not been mentioned yet but warrants a passing acknowledgment, is the fact that Ross has made his data available for others to scrutinize and reproduce. If his analysis is wrong, what better way to prove it?
Since data quality is pretty important to science — especially experimental science, why not just scrap all these thermometers in cities and even suburbs for that matter and evenly disperse them across the Earth’s uninhabited land mass. Measurements could be sent by solar powered satellite uplink bursts so that they never need to be visited or their observations corrupted by any kind of vehicle traffic.
I suppose the answer to “why not” is $$$. Still when your main data source has to be “adjusted” for UHI effect, me thinks any final result can be obtained depending on who is doing the adjusting…
Perhaps urban/suburban ground based temperature measurement should just be thrown out until better data is available.
The ANALYSIS – which is what it is – is more likely wrong, and almost, but not quite, completely wrong, and the arguments made in this post ESTABLISH that. It’s not “his data,” either. It’s data that’s out in the public domain, and other, better studies have been done. This approach is not fraud, nor is it pseudoscience, but it’s a very low bar. Particularly pernicious is that this paper is not very different from the authors’ first, unsupported paper.
If Gavin’s defense of most of the presentation in AIT is partisan, then given that it squares with the picture of a sampling of scientists around the world, it must be a big party he’s in, and its agenda must be actual science, vs. the politicized and economic interests model of reality presented in Ian McLeod’s post.
Moreover, this represents Orwell’s “duckspeak,” unfortunately – the reflexive posting of “the data is available” where it doesn’t apply and the reflexive demand that people must replicate the analysis in order to criticize it, even though the paper itself shows signs of serious flaws.
Ian McLeod, It is not partisanship to insist on good science. M&M2007 really does little to elucidate the problem it purports to consider. It does not shed light on the nature of the contamination and the very complexity of the model makes it nearly inevitable that it would find some correlation–spurious or not. As to Gore, he is a layman who actually got most of the science right. That is to be commended. He is also alone among politicians on the global stage in his unrelenting efforts to get people to pay attention to this threat. I find the howls over Gore’s Oscar and Nobel from the political right amusing, as all a rightwing politican would have had to do to deprive him of it would be share the stage with him in calling attention to threat. And despite the fact that many on the right have acknowledged the threat, none had the courage or foresight to do so.
Ross, #63, thanks for your response. I was wondering if you could respond to my other point–the fact that if your estimates of surface warming are correct and we are starting to see positive feedbacks already, this would be cause for serious concern rather than complacency.
Also, your discussion of trying to include multiple indices for economic growth sort of illustrates my point. How do you know you are using the right indices? Without a real theoretical framework to guide you as to the types of contamination you are looking for, adding multiple indices may unnecessarily complicate the model while still not capturing important differences in regional growth patterns.
Finally, there is the question of what you expect to be done with your research. Even if we were to take at face value your conclusions, they give little indication how to reliably estimate and correct for the biases you say you see. Moreover, I don’t think it is advisable to adopt the “Don’t Worry, Be Happy” approach you seem to have taken in you Post editorial, given the unmistakable indications of significant change we are seeing independent of any global temperature estimate. The real concern here is when do we reach the point where natural ghg feedbacks overtake our own contribution, since at that point mitigation becomes pointless. It is not alarmist to be alarmed by significant perturbations to a physical system with known but ill characterized positive feedbacks.
Re David Goebel @ 71: “Perhaps urban/suburban ground based temperature measurement should just be thrown out until better data is available.”
As if that would make the warming in the Arctic and the acceleration of sea ice and glacial melting in Greenland go away (discussed in raypierre’s most most recent report from the AGU meeting).
Gavin has repeatedly addressed this very proposal in past topic comments, btw. The existing urban stations are kept precisely because they have a long, unbroken temperature record and any deviations due to UHI can be corrected for. Newly created stations would have exactly zero temperature record, which, I suppose, is pretty much what those who advocate this course desire. No record, no increase, at least not for some time off into the future.
Gavin, you seem to be making a lot about Ross’s language in an OP ed. An Op ed is like a movie. Nobody expects it to live up to the standards of peer review.
An Op ed is like the posts that Hansen makes on his personal site. [edit – quote’s wrong please check your source]
Do you want your science judged by those remarks? Obviously not. Anymore than Hansen wants his science judged by his personal remarks, and any more than Ross deserves to have his science judged by his Op-ed.
[Response: Which planet are you living on? Hansen gets judged on his personal remarks all the time. McKitrick’s brand of ‘science by op-ed’ undermines every supposedly scientific statement he makes. You don’t get a pass on making stuff up just because it’s not a journal article. – gavin]
How is saying “The science in Al Gore’s movie is largely consistent with the consensus view of climate scientists” an example of “partisanship editorializing”?
Statements like this make my head spin.
David Goebel (#71) wrote:
You write, “Since data quality is pretty important to science — especially experimental science, why not just scrap all these thermometers in cities and even suburbs for that matter and evenly disperse them across the Earth’s uninhabited land mass.”
As Jim Eager pointed out in 73, without the urban and subrural, one wouldn’t have any real trends to speak of — beyond what is provided by means of satellite measurements. Thus even if one were to create an entirely new network, the trends produced by such a network would be lacking in statistical significance for some time. However, it is also worth pointing out that a great many corrections are made which reduce and according to more prominent analyses, efectively eliminate the Urban Heat Island effect.
There are also reasons for thinking that it is not particularly significant, e.g., Park Cool Islands. But more significantly, we do have means for determining the trend in temperatures which are largely independent of ground-based networks. In the lower troposphere, we have UAH and RSS trends, both of which are based off of Microwave Sounder data. Likewise we have Pathfinder — but this measures skin-temperatures, making it closer to the surface than so-called ground-based measurements, and while I know that the Pathfinder trend for 1980-2002 was 0.43 C/decade, I do not know how this should be compared to ground-based measurements.
Independently of the models, it would be natural to assume that the trend in the lower troposphere would be roughly the same as surface measurements. However, models would project a lower troposphere trend which is 1.3 times higher that that of the surface. Given ground-based measurements with a trend of 0.187 C/decade for January 1982 to December 2004 and model projections that the trend in lower troposphere temperatures should be 1.3 times the trend in surface measurements, one would expect a tend in the lower troposphere of 0.2431 C/decade. This compares quite favorably with the RSS trend of 0.239 C/decade, differing by 1.7%, which I would assume is well within the range of expected statistical error.
However, it does not compare quite so well with UAH with its trend of 0.163 C/decade for the same period — assuming that models are correct. In fact, it suggests that ground-based measurements are inflated by roughly 49%, or else that models are wrong and that surface measurements are roughly 15% above lower troposphere measurements, or that somehow both the models and surface temperatures are wrong.
It is worth noting that UAH has had a troubled history. For example, in 2005, it was discovered that John Christy’s algorithm used for processing the Microwave Sounder data was incorrectly adjusting for the difference between night and day. Nevertheless, in some way that still is unclear to me, Ross’ study employs UAH. But I do not know whether their analysis includes the correction for the difference between night and day.
David Goebel (#71) wrote:
Multiple organizations act as a double-check, for example, there are the people at NASA GISS and those at Hadley MET, as well as a great deal of literature devoted to the analysis of data. If there are discrepencies, one looks for the source of these discrepancies.
In contrast I have noticed that Patrick Michaels, Ross McKitrick, John Christy and Stephen McIntyre all belong to the Exxon-funded George C. Marshall Institute, so you might find it preferable to leave out motives and instead begin with the assumption that work is being done in good faith.
Ross,
One point that concerns me is whether — when considering trends in economic development — you are considering them at the local or national levels.
It would seem that any cause of a spurious trend in the readings of a given ground-based station would be the result of local economic development, not national. Particularly if the cause of the spurious trend were the Urban Heat Island effect. So when considering economic development, it would seem appropriate to compare economic development at the local level rather than the national level.
Furthermore, it would seem that an increasing Urban Heat Island effect would be required to produce a spurious trend in temperatures rather than a one-time distortion. This too would be a function of local economic development, not economic development at the national level.
Then I saw the socioeconomic variables which you claim are correlated with trends in apparent local temperature:
Furthermore, you state:
These would appear to be at the national level. As such I find it difficult to see how this would tend to explain trends in temperature by way of an Urban Heat Island effect — which is necessarily limited in nature.
Likewise, given the fact that the former Soviet Union has an economy largely in disarray, whereas Europe, Canada and the United States are doing comparatively well over the period from 1979 to 1999 with the former Soviet Union experiencing weaker warming would produce a substantial amount of the correlation which you see. And as such, if one were able to explain why the trend in temperature over Siberia is weaker than the trend throughout much of the rest of the subarctic, this would be in essence an alternative explanation of the very same “correlations” uncovered by your analysis.
Furthermore, given the wide variety of economic measures and a limited number of countries in the upper northern latitudes, it would seem fairly easy to select a combination of economic measures for which there would exist spurious correlations. Particularly if no causal explanation of the relationship between these economic measures and the trend in temperatures is given or required.
So at this point I have to ask:
Do you have any sort of causal explanation of the correlation relationship between the economic measures you’ve selected and the trends in temperature?
#70, equivalency is the lowest form of argumentation. McKitrick’s paper arrives at some pretty heady conclusions that if valid would more or less upend the state of the mainstream science, (something I gather would not upset him). Despite this, and despite the truism that the making of groundbreaking discoveries is more often an indication of mistake than virtuosity, he doesn’t see fit to investigate the former possibility through the normal channels. Quite the contrary, he promptly shouts his results from a mountaintop to the public at large (and the PR machine eager for these types of results), as the man says, without ifs, buts, or caveats about the existence of other possibilities.
Meanwhile, Gavin- who has, at least informally, consulted Al Gore as to the state of the science if I have my facts right- defends AIC’s treatment of the then mainstream science. Just fyi, even disregarding the difference in context and character of these instances, and even allowing that each equivalently reveals an opinion about the veracity of the mainstream science, they are hardly equivalent. ‘Partisanship’ and ‘bias’ are not a binary tests of validity. To illustrate a biased journalist, which is to say any and all journalists, can write an article that reflects a genuine effort to cover the story and wherever that takes him or her, (plenty such instances exist), or a work of hackery bent on distortion, (and, certainly, everything in between). It goes without saying, any two such articles are not equivalent despite the existence of an opinion that shapes the story to a greater or lesser extent in both cases. Anyone attempting to short circuit a judgment about the relative validity of work produced by ‘partisan’ or ‘biased’ authors by inane citation of the corresponding existence of a point of view is doing everyone involved a disservice, not to mention playing their part in the stunting of human discourse.
Speaking of which, I find it interesting that in the comments here McKitrick has not seen fit to explain why we might expect to see UHI effects in the satellite record, what accounts for, given his titanic findings, large high latitude temperature anomalies, or the disconnect that his manuscript implies in the terrestrial and oceanic temperature records, to name a few. Of course, were interested in those questions, they probably would’ve occurred to him before he published his paper, not least before that paper became the foundation of a message meant to influence public opinion.
Steven Mosher, A scientist must be especially circumspect in his statements to a lay audience about scientific matters. Looking at the Post editorial, it is hard to reach any other conclusion but that the results are being vastly oversold–and to a gullible audience. This is improper to say the least. James Hansen’s occasional allegedly intemperate remarks concern politics and policy, not science. I presume you would not deny him a right to his political opinions just because he is a scientist.
Thank you to those who provided very thoughtful insights to my concerns about UHI, albeit laymen’s concerns. The level in the discourse here is far superior to what’s in the media or what our “leaders” say.
Today in Bali, UN sec gen said, “”We are at a crossroad, one path leads to a comprehensive climate change agreement, the other to oblivion.” Oblivion?!? Honestly, does he not understand the meaning of the word? If the Sun was to super nova, OK, that’s oblivion. 10C over two centuries could/would lead to mass animal/plant extinctions which spells very very bad news for human civilization and a severe downsizing, but it’s not oblivion.
Also today, the announcer (not a guest) on BBC World Service commented that all the smoke coming out of our car exhausts was leading to global warming. Sigh. “Smoke” has a specific meaning involving particulate matter and has nothing to do with GHG. In fact the irony is that the smoke component belched out is likely exerting a negative forcing effect (global dimming), and therefore impeding global warming.
Which brings me to my final concern. Who on this site would bet money that we’ve discovered all the significant (> 10%) climate forcing phenomena? Global dimming was not understood until recently. How about the possibility that a very significant (> 50%) climate forcing phenomena is still unknown? Hmmm
I applaud Hansen for having the balls to make a model based prediction (that can be sustained or falsified within his lifetime) that if CO2 levels are not reduced in the next ten years, we will be beyond the tipping point leading to run away warming.
[Response: Science embodies the best and most convincing knowledge that man has up to date, I guess. We can only discuss issues that we know, and what we know tends to be confirmed through scientific methods and tests based on empirical evidence. -rasmus]
79. David, the word oblivion is correct. For example, use the Google satellite map to look at Dungeness. It is just one example of the types of infrastructure at risk in the coming decades through Hansen-type scenarios. There are others which I have discussed with Secretaries of State here in the UK, and the urgency of the matter is appreciated at least at that level. Having spent about 15 years working on the oblivion-avoidance strategies, I do hope that today’s leaders have the courage, in whatever endeavour they are associated and wherever in the world they have influence, to transition to the highest-impact mitigation efforts that are required.
Majorajam in #78:
Did I miss something, or did you mean the converse?
David Goebel asked: “Who on this site would bet money that we’ve discovered all the significant (> 10%) climate forcing phenomena?”
My decision to wager would depend on the bet and the odds. I believe it is reasonable that the most significant forcings are at least identified, albeit not necessarily 100% determined. However, I believe you are asking the wrong question. A more interesting question is would I expect estimates of GHG forcing to change significantly (>2x, say) regardless of future discoveries. There, I think you would attract a lot of smart money. We do not have to understand everything about a system to make significant statements about it. We may know some things very well even as others remain uncertain. If you look at the models you will find that the conclusion of GHG driven warming for the current epoch is extremely robust.
How about “all the significant (over a decade to a century) climate forcing phenomena”? Leaving out changes in position in the plane of the galaxy, asteroid impacts, basalt outbursts, and all the biological feedbacks, say.
In relation to the 2004 paper, Tim Lambert quotes a four-step analysis by a Robert Grumbine regarding the earlier attempt at correlating per capita income and observed temperature changes. Steps 1 and 2 are well worth looking at, but I would just like to focus on steps (3) and (4):
This paper would seem to be more of the same, although in some ways the paper seems rather opaque about it.
We have more of the adjusting of apparent temperatures by income and standard of living increases, the “raster” figure 4 which shows how many tenths of a degree per decade they would remove from the apparent trends to arrive at their adjusted trends instead of before and after pictures. Apparently with the United States having had a cooler warming trend than Western Europe due to the North Atlantic Oscillation having been been locked in a positive phase, it is less in need of adjusting than Western Europe — which I suppose is why dividing the Gross Domestic Product by land area becomes so important.
Not sure exactly how one justifies cooling the trend of the Tibetan Plateau by so much since we are speaking of people who are fairly isolated from the outside — but I will take his word for it. Besides, he may simply be regarding it as part of the Republic of China. The political boundaries matter quite a bit in these sorts of calculations, no doubt.
Then there is the question of the UAH-data. UAH is generally avoided given its history of problems. One of the biggest problems was taken care of in the move from version 5.1 to 5.2 which corrected for night and day. But we wouldn’t know that UAH was even being used if it were for two things:
1. In the paper under the references, we have the link to John Christy’s website:
2. Ross admitted as much with one sentence buried in the middle of 34:
In 2004, it turned out that McKitrick, Michaels and all were making use of a version 5.0 of UAH which did not include the corrections for night and day (see: timlambert) even though the first version to include those corrections had been superceded by a later version. This time around there is virtually no mention of UAH at all — let alone what version it is or the specifics of how it is used — which leaves us quite in dark.
Yes, we can examine the code and whatnot, but the balloon has already gone up, the flyers have gone out, and chances are the discussion will be pretty much over here and elsewhere by the time these sorts of details comes to light.
The total world primary energy production in 2003 was 4.4 × 10^20 Joules, which was sufficient to melt 1.3 × 10^3 Gigatons of ice, where 1 Gt = 10^9 metric tons. This figure is about twice the estimated amount of ice actually melted.