Guest Commentary by Mauri Pelto
The net loss in volume and hence sea level contribution of the Greenland Ice Sheet (GIS) has doubled in recent years from 90 to 220 cubic kilometers/year has been noted recently (Rignot and Kanagaratnam, 2007). The main cause of this increase is the acceleration of several large outlet glaciers. There has also been an alarming increase in the number of photographs of meltwater draining into a moulin somewhere on the GIS, often near Swiss Camp (35 km inland from the calving front). The story goes—warmer temperatures, more surface melting, more meltwater draining through moulins to glacier base, lubricating glacier bed, reducing friction, increasing velocity, and finally raising sea level. Examining this issue two years RealClimate suggested this was likely the correct story. A number of recent results suggest that we need to take another look at this story.
The Acceleration:
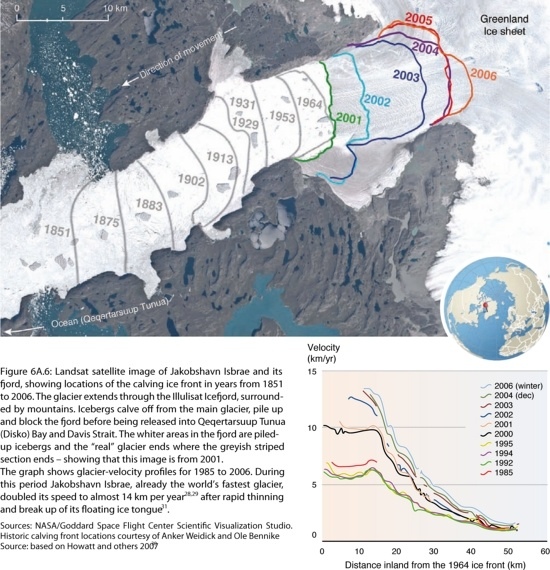
Jakobshavn Glacier, West Greenland, retreated 30 km from 1850-1964, followed by a stationary front for 35 years. Jakobshavn has the highest mass flux of any glacier draining an estimated 6% of the GIS. The glacier terminus region also had a consistent velocity of 19 meters/day (maximum of 26 m in glacier center), from season to season and year to year, the glacier seemed to be in balance, as I noted in a 1989paper. This is the fastest glacier in the world, no steroids needed. After 1997 it began to accelerate and thin rapidly, reaching an average velocity of 34 m/day in the terminus region. The glacier thinned at a rate of up to 15 m/year and retreated 5 km in six years. Jakobshavn has since slowed to near its pre-1997 speed, the terminus retreat is still occurring, but likewise is.
Helheim Glacier, East Greenland had a stable terminus from the 1970’s-2000. In 2001-2005 the glacier retreated 7 km and accelerated from 20 m/day to 33 m/day, while thinning up to 130 meters in the terminus region. Kangerdlugssuaq Glacier, East Greenland had a stable terminus history from 1960-2002. The glacier velocity was 13 m/day in the 1990’s. In 2004-2005 it accelerated to 36 m/day and thinned by up to 100 m in the lower reach of the glacier. Helheim and Kangerdlugssuaq combined drain 8 % of GIS. Hence, they are more than canaries in the coal mine. In 2006, the velocity of Helheim and Kangerdlugssuaq decreased to near the 2000 level, the terminus of Helheim advanced a bit (Howat et al., 2007).
The first mechanism for explaining the change in velocity is the “Zwally effect”, which relies on meltwater reaching the glacier base and reducing the friction through a higher basal water pressure. A moulin is the conduit for the additional meltwater to reach the glacier base. This idea, proposed by Jay Zwally, was observed to be the cause of a brief seasonal acceleration of up to 20 % on the Jakobshavns Glacier in 1998 and 1999 at Swiss Camp (Zwally et al., 2002). The acceleration lasted two-three months and was less than 10% in 1996 and 1997 for example. They offered a conclusion that the “coupling between surface melting and ice-sheet flow provides a mechanism for rapid, large-scale, dynamic responses of ice sheets to climate warming”. The acceleration of the three glaciers had not occurred at the time of this study and they were not concluding or implying that the meltwater increase was the cause of the aforementioned acceleration. However, many others have made this assertion and are investigating (Stearns and Hamilton, 2007). Examination of recent rapid supra-glacial lake drainage documented short term velocity changes due to such events, but they had little significance to the annual flow of the large glaciers outlet glaciers (Das et.al, 2008).
The second mechanism is a “Jakobshavn effect”, coined by Terry Hughes, (1986), where a force small imbalance of forces caused by some perturbation can cause a substantial non-linear response. In this case an imbalance of forces at the calving front propagates up-glacier. Thinning causes the glacier to be more buoyant, even becoming afloat at the calving front, and is responsive to tidal changes. The reduced friction due to greater buoyancy allows for an increase in velocity. This is akin to letting off the emergency brake a bit. The reduced resistive force at the calving front is then propagated up glacier via longitudinal extension in what R. Thomas calls a backforce reduction (Thomas, 2003 and 2004). For ice streaming sections of large outlet glaciers (in Antarctica as well) there is always water at the base of the glacier that helps lubricate the flow. This water is, however, generally from basal processes, not surface melting.
If the Zwally effect is the key than since meltwater is a seasonal input, velocity would have a seasonal signal. If the Jakobshavn effect is the key the velocity will propagate up-glacier, the terminus velocity will be impacted by tides, and there will be no seasonal cycle.
On Jakobshavn the acceleration began at the calving front and spread up-glacier 20 km in 1997 and up to 55 km inland by 2003 (Joughin et al., 2004). On Helheim the thinning and velocity propagated up-glacier from the calving front. Each of the glaciers fronts did respond to tidal variations indicating they had become afloat, detached from their bed (Hamilton et al, 2006). This had been the case at Jakobshavn for the last 50 years, but not for Helheim or Kangerdlussuaq. In each case the major outlet glaciers accelerated by at least 50%, much larger than the impact noted due to summer meltwater increase. On Jakobshavn the acceleration was not restricted to the summer, persisting through the winter when surface meltwater is absent.
As a result of the above Luckman et al. ( 2006) concluded:
“The most plausible sequence of events is that the thinning eventually reached a threshold, ungrounded the glacier tongues and subsequently allowed acceleration, retreat and further thinning. It is reasonable to believe that the 1998 Jakobshavn speed-up, also following a long period of stability, was triggered by the same processes of thinning but occurred earlier and after a shorter period of thinning because the tongue was already afloat.”
Examination of the acceleration of other glaciers such as the Petermann Glacier indicate a much smaller acceleration than that observed on three glaciers we have focused, and indeed it is in the summer and of a magnitude that the Zwally effect could explain (Rignot, 2005). Other large outlet glaciers such as the Rinks and Daugaard-Jensen have been stable since 1960 (Stearns et al, 2005). Many other lesser outlet glaciers have accelerated substantially.
That each of the three glaciers has a reduced velocity in 2006 and 2007 despite some exceptional melt conditions in 2007 further suggests that meltwater is not the dominant driver of the acceleration of the main outlet glaciers. Temporarily, there appears to be a force imbalance at the glacier fronts. This will reduce the annual contribution to rising sea level from glacier dynamic changes. The bad news is that the degree of acceleration that can occur via the Jakobshavn effect is greater in these cases than that from the Zwally effect. The Zwally effect is nonetheless real and also implies a direct sea level impact of greater melt.
The Jakobshavn is of particular importance as it has a bed below sea level for at least 80 km inland from the terminus. In this reach there are no significant pinning points, or abrupt changes in slope or width (Clarke and Echelmeyer, 1996) that would help stabilize the glacier during retreat. It is the only outlet glacier of GIS to lack these, and can then (via backforce reductions) tap into the heart of GIS. We know that surface melting is a slow process for raising sea level. but as Greenland’s major outlet glaciers have recently shown, rapid acceleration can quickly deliver large volume of ice to the ocean. The pace of change is not glacial.
Clarke, T.S. & Echelmeyer, K. 1996: Seismic-reflection evidence for a deep subglacial trough beneath Jakobshavns Isbræ, West Greenland. Journal of Glaciology 42(141), 219–232.
Hughes, T. (1986), The Jakobshavn effect. Geophysical Research Letters, 13, 46-48.
Pelto, M.S., Hughes, T.J. & Brecher, H.H. 1989: Equilibrium state of
Jakobshavns Isbræ, West Greenland. Annals of Glaciology 12, 127–131.,
Thomas, R. H. Abdalati W, Frederick E, Krabill WB, Manizade S, Steffen K, (2003) Investigation of surface melting and dynamic thinning on Jakobshavn Isbrae, Greenland. Journal of Glaciology 49, 231-239.
Thomas RH (2004), Force-perturbation analysis of recent thinning and acceleration of Jakobshavn Isbrae, Greenland, Journal of Glaciology 50 (168): 57-66.
Why this need to guess about sub-ice water pressures? Technology to measure pore water pressures at kilometre depths is highly developed – oil & gas drilling, mining, even civil geotechnics. Grout in some fibre-optic piezos and measure it.
An example link for my earlier post concerning large-scale oceanic mills is
http://www.marine.csiro.au/remotesensing/oceancurrents/SE/20070223.html
Thank you, Tim.
-BPL
Looking at Google Maps in conjunction with the map in this post, it appears that the Jacobshavn ice front is now inland of the mountains that ring the GIS. Wild.
replying to GlenFergus #51: Drilled access to the bed and direct measurements of subglacier water pressure have been made many times over the years (for a recent example see Harper et al, Geophysical Research Letters, Vol 34, L12503, 2007). Logistically and technically, however, making these measurements on fast-moving, highly crevassed glaciers is infeasible. (It has been done a few times; for an example see Meier et al, Journal of Geophysical Research, 99(B8), 15,219-15,229, 1994).
Doing such measurements at a place like Jakobshavn would be a tough task to say the least. Having an Oil & Gas industry budget might help, but even then I would have my doubts about success…
I have a map of Greenland’s basal topography. Interesting, the centre is below sea level – almost certainly depressed due to the weight of ice. The east coast/south coast have relatively high mountains which act as a curtain/retaining wall – hence glacial flow via narrow channels. By contrast parts of the west cost seem to have no curtain wall of mountains. A possible scenario is that this area, not “narrow valleys” would see substantial ice loss. Anyway, just a scenario – has anybody else seen the basal maps – worth looking at.
54..Nick Barnes, dont forget that google earth or maps are definately not up to date and can be 3-5years old so further retreat will have happened since then. On the subject of calving glaciers and the subsequent added freshwater being released into the sea, already there is clear evidence and measurable decrease in the salinity of the deep waters of the north atlantic current just east of canada. That coupled to a 0.7degC increase in the deep water current in just 1 year. This implies that a slowdown of the current is imminent as occured 20k yrs ago. Only this time the global level of CO2 is considerably higher than it was 20ky ago most likely resulting in a greatly prolonged ice-age, much longer than in the past. Does any contributer to RC know what effect an ice-age in the northern hemi will have on the southern hemisphere ? As the NA current moves futher south and/or stops. I also read that the jet stream winds at around 30-40k ft have changed direction and they are now much nearer the poles than previously- this could well cause much bigger and more destructive tornadoes and hurricanes as they wont get their heads chopped off by the high velocity jet streams and can grow to any size the want..within natural limits of course.
So given a worst case scenario — 6C increase by 2100 or 2150 — how long would it take for all ice to melt in Greenland? 200 years, 300 years, longer? Under a worst case.
To Tenney, someone did actually respond to your very valid question about “what the affect on GIS might be of a warm Arctic sea due to albedo effects once the sea ice is gone in the summer?.”
(#25 Pat N. said:
Although increasing latent heat has been raised before *,
the rapid opening of the Arctic Sea and latent heat effects on Greenland ice warrants immediate attention.
* comment #135 at:
https://www.realclimate.org/index.php/archives/2006/03/greenland-ice-and-other-glaciers/
What Pat points to, I believe, is this statement from the article (2006):
“Looking forward, the current (small) imbalance (whether positive or negative) of the Greenland ice sheet is not terribly important. What matters is if the melting were to increase significantly.”
The Arctic Ice Sheet gone in the summer absolutely means an increase in GIS melting. I doubt that even Singer would dispute that (without a large accompanying check).
Pat is one of the United States’ few heroes. He was fired from the National Weather Service for telling a bit too much of the truth.
As to ‘water vapor from the cracks in the Arctic’……uh,…..well….no….uh… .Haven’t been there in a while…….alright, actually never been.
What are you talking about, anyway?
#43 Mark, I equally can write such dribble, although
I would make it less opaque and easier to understand. I can take any location on Earth, show a surprising cooling effect, and point out that Moulins are for Don Quixote and Sancho Panza….. I could write this way,
but I wont. Because there is more to life than just being paid to be a Don Quixote… There are actually real events, far more interesting… The surface temperature record is vulnerable to attack, with cut and run pot shots, any record is vulnerable to ridicule, as long as no one else is there to respond to the criticism. But what WSJ Quixote’s consistently forget to write about is the disappearance of the perennial ancient Glaciers found all over the world, and especially multi year ice of the Arctic Ocean, true metrics against their arrogant assault on reality……
Tad Pfeffer (40) — Thank you for the information.
Global sea level rise is currently at 2.4-3.8 mm/yr (since 1993, IPCC 2007). Assuming that rate stays steady (highly unlikely), you’d get a lower bound of 24-38 cm of sea level rise by 2100.
Now, the 2007 IPCC estimate:
It seems their lower bounds are kind of implausible… and we already know that the AOGCMs missed some important features of the Arctic climate system, the sea ice response at least (IPCC 2007):
The take home point for reporters is that the IPCC has underestimated these trends and their projections are also “very likely” to be underestimates.
Another issue has to do with the rate that the rest of the cryosphere, the mountain glaciers and icecaps, will melt at. The causes of sea level rise are the expansion of ocean water caused by warmer ocean temperatures, melting of the Greenland Ice Sheet and the Antarctic Ice Sheet, and the glaciers.
If we look at Science 16 March 2007, Recent Sea-Level Contributions of the Antarctic and Greenland Ice Sheets, Shepherd & Wingham, we find that:
For the fraction due to thermal expansion of ocean water, see Thermosteric sea level rise, 1955–2003, J. I. Antonov, S. Levitus, and T. P. Boyer, GRL 2005
If so, then the total sea level rise, 3.0 mm/yr, equals 0.40 mm/yr + 0.35 mm/yr + X
Where X is the amount of water entering the oceans from melting glaciers and small icecaps. This number is probably of greater immediate practical importance to human populations. Is it safe to say that the current contribution is then ~2.3 mm/yr?
To quote Tad Pfeffer, #9:
For a nice photo of this, see: River of melting water springing from Nigardsbreen, Norway
Thus, by the time contributions from Greenland and Antarctic sea ice melt become dominant, will all the world’s mountain glaciers and icecaps be almost gone? If so, then there will be a huge water crisis, because many highly populated regions rely entirely on glacial melt for some period of the year for their water supplies. Where will they go? To the coasts, which will eventually be inundated, whether in 100 years or 200 years?
RE: #60
And they won’t Wayne, that’s the problem. They moderate responses too. Only friendly facts allowed. That’s the definition of propaganda.
The International Earth Rotation and Reference Systems Service (IERS) suggest an ongoing transfer of mass to the pole(s) since 1998. Does this present a problem for AGW?
http://icecap.us/images/uploads/The_Ice_Caps_are_Growing.pdf
[Response: That’s funny. It’s rare that such a specific conclusion is drawn from the flimsiest of evidence despite direct observations contradicting it (google GRACE). Unfortunately, the adding of leap seconds is not as objective as you might think – (see here), and the complete lack of alternate hypotheses underlines the agenda of the writer. Any water shifts – whether they are towards higher precipitation in higher latitudes, or sea level changes due to circulation or thermal expansion (which is not uniform) etc would seem to me to be candidates for the explanation (even if one were needed). Additionally, it’s not obvious that solar or planetary tidal effects couldn’t be playing a role. And of course, the amount of mass concerned would need to be quantified. Meanwhile there is plenty of evidence indicating that the length of day responds to climate changes (especially ENSO) etc….. – gavin]
Mark & Wayne (#43 & 60), I figured it out — no warming trend bec they were sticking their thermometers in the ice, so it has been remaining fairly steady, around 32F.
My bigger problem with the article was:
I could tell my CF lightbulb joke again….Nah.
I’m a bit confused by the post. I understand the “Zwally effect” would be enhanced by warming. But it also seems the “Jakobshavn effect” is at least partly enhanced by warming — warming that thins the glacier and makes it more bouyant. And perhaps by way of increased ocean pertubations at the calving front?? Is there an increase in that type of perturbation due to global warming? Then sea rise would also increase that perturbation and bouyancy (but sea rise is very slow).
Also I read somewhere that reduction of the ice load on Greenland may be causing small local earthquakes. If so, would this also be considered “perturbations” that could enhance the “Jakobshavn effect”?
Aside from this I just read about the storehouse of methane possibly opening from Siberian methane hydrates (see: http://www.spiegel.de/international/world/0,1518,547976,00.html ). This could cause a lot more warming, and if it does, would it be expected that the Zwally effect would overtake the Jakobshavn effect?
Finally, my meager understanding is that a lot of energy goes into melting ice (is this akin to kinetic energy?), rather than heating the surroundings (another reason why in some places in Greenland there might not be warming), but once the ice is melted the energy then goes into the atmosphere and ocean more quickly. That might be wrong, but as long as there is one small ice cube in a glass, the water stays cool, and as soon as that melts away, the water quickly warms to room temp.
To d. beck, comment #59
When the sea ice cracks open, the temperature of the water below it is so much higher than the air above it, that water vapor is created. At least, that is what seemed to happen in the beginning of April when the cracks really began to open up, and it seems to be very much an ongoing process, judging by the IR satellite photos that get updated every couple of hours — see: http://www.weatheroffice.gc.ca/data/satellite/hrpt_dfo_ir_100.jpg
Also, see the link a guy from Holland posted on my blog showing the current ice situation compared to last year,
from the National Snow and Ice Data Center, Boulder, Colorado:
http://nsidc.org/data/seaice_index/images/daily_images/S_timeseries.png
Let’s face it, you expose above freezing temp water to dry air that is at 10 degrees Fahrenheit — what is gonna happen?
There are so many cracks now that it is difficult to see what is going on, but it was very clear a few weeks ago.
Also, if you happen to get a chance to look at a good google map that shows the topography around the coast of Greenland, you will get a good shock — the place looks like it is just made for ice to slide out of it.
Re: comment #59
To: d. beck,
sorry, that was the wrong link — this one is to the Arctic:
http://nsidc.org/data/seaice_index/images/daily_images/N_timeseries.png
Gavin, how many computer models actually incorporate the predicted increase of CO2/CO and CH4 and fine particulate smog from china and india and the other developing countries over the next 50 yrs. even if the US went cold turkey tomorrow re: emmissions, that would be cold comfort if china and india continued along their merry way.
I wonder if it is necessary to invoke the Zwally effect every time one sees a sudden advance of a glacier. Recrystallization of ice due to local strain accumulation or presence of water can shift the primary deformation mechanism from dislocation creep to some other mechanism, such as diffusional creep or superplastic creep. David Goldsby, now at Brown University, has done some wonderful research where he identified a grain boundary sliding (GBS) mechanism in ice, accompanied by dislocation motion.
Re # 66 Lynn V: “…my meager understanding is that a lot of energy goes into melting ice (is this akin to kinetic energy?)…”
It is called latent heat:
http://en.wikipedia.org/wiki/Latent_heat
One of the reasons for authoring this post, was a misconception among a number of some glacier scientists even that the Zwally effect was driving the outlet glacier acceleration of the 2001-2005 period. That this is not the case is key to document. It should however, be clear that though we can eliminate that as the key dynamic for acceleration the specific glacier dyanmic underpinnings have not been identified. It is evident that an imbalance at the calving front is one of the key ingredients, but not the only one. Sustaining the observed acceleration for an extended period is difficult, having an outlet glacier better instrumented at the onset of the next acceleration will be a key to fully understanding the process. The widening of the fjord of the Jakobshavn Isbrae above the 2006 terminus can lead to additional calving and further thinning. To what extent I will not hazard an estimate at this moment. It will be worthy of its own post. It will be interesting to examine Pfeffer at all in that light. Total volume flux is a critical parameter to observe over a long time period. In the 1990 paper referenced for this post we did calculate volume flux. It will be nice to compare to Pfeffer’s new work. This post was focussed specifically on Greenland outlet glaciers, not even Greenland as a whole. Meltwater inputs can and will be more important in others regions of the ice sheet. My main focus in on alpine glaciers not ice sheets normally, and I agree with Pfeffer that for now they remain critical.
Re #59 True: “What matters is if the melting were to increase significantly”.
Also true: I was removed from federal civil service by NWS (July, 2005). The removal was later reversed
and a retirement certificate by NWS for “30 years of Loyal Service rendered to the government of the United States” was awarded (Feb. 2006).
—
and, “Evaporation is greatest during the winter because of the greater difference
between air and water temperatures” Cynthia Sellinger, deputy director of NOAA’s Great Lakes Laboratory.
http://www.shns.com/shns/g_index2.cfm?action=detail&pk=BADICE-02-05-08
and that cold air and open surface waters in the Upper Midwest
results in water vapor released from lakes and rivers (photos available).
http://www.shns.com/shns/g_index2.cfm?action=detail&pk=BADICE-02-05-08
I’m afraid I am just not understanding the point here. It is not surprising that thinning would be important in setting at what place an outlet would float, nor that thinning might be increasing at an altitude where snow does not persist year-round. But, it is fairly clear that glaciers do not cease to move once their termination is above sea-level. And it is that aspect of their motion that seems to hold the key for future sea level rise. Is there a process that transports ice to an altitude where it must melt rapidly or will it tend to stick at an altitude where it must melt slowly? Whether that lower rapid-melt altitude is sea level or not does not seem to be the key issue: something made Jakobshavn thin so that it floats. Once it floats, who cares? It’s gone already. That Jakobshavn thinned is important because it indicates that at whatever rate it is being fed, it is melting faster than it is piling up. If it happens to be fed at a faster rate from higer altitudes with insignificant thinning owing to melt, but rapid mass transfer owing to melt lubrication then this seems to me to be the more important effect.
Maybe I’ve missed something? Tad Pfeffer (#9) seems to insist that only marine grounded outlets are important, but then points to all the other non-Greenland or Antarctic ice as being more important at present. Many of these reach the sea through rivers, not glaciers.
Have I gone blind?
What I am not seeing here is a discussion of the recent reports of supraglacial lakes’ hydrofracture of kilometer thick ice resulting in the advection of heat to basement ice. This means the basement ice suddenly warms, and warmer ice is weaker. Weaker ice under the stress of supporting kilometer(s) of ice is subject progressive collapse energetically driven by the potential energy of the supported ice structure.
The result is a slurry of ice and water, moving at a high speed. The high speed is generated by the release of kinetic energy as the face of the (warmed and now weak) basement ice progressively fails under the weight of the ice above. I call this the “Missoula effect.”
The Missoula Effect could move a lot of ice, water, (and rock) through a narrow outlet rather rapidly. If the material still has any significant speed when it gets the shore, it can cause a tsunami.
OK, we have not seen this example of physics in a while. On the other hand, we have not had big chunks of ice suddenly warming in a while either. Now, we are back to a situation where big chunks of ice are suddenly warming.
Chris, the large Greenland outlet glaciers are not thinning significantly via melting, it is by moving faster and calving more rapidly. It is much faster to lose mass via calving than melting. Note the breakup of Larsen B or the disintegration of the terminus reach of the Jakobshavn from 2001-2006. What matters for calving rate is only if the front of the glacier is afloat. The key for future sea level rise rate of the large ice sheets is not in place melting, but calving.
Chris Dudley:
Most of the potential for catastrophic sea-level rise in this century lies in the GIS and WAIS, which are both mostly grounded below sea-level. The centre of the WAIS is grounded kilometres below sea-level.
What Aaron Lewis was mentioning is this:
http://www.whoi.edu/page.do?pid=7545&tid=282&cid=40786&ct=162
News Release : Lakes of Meltwater Can Crack Greenland’s Ice and Contribute to Faster Ice Sheet Flow
Researchers Make First Observations of Surface Meltwater Cutting through the Ice Sheet to Lubricate the Bottom
Mauri Pelto says:
The key for future sea level rise rate of the large ice sheets is not in place melting, but calving.
First, for the glacial and small icecap melt, the 50-70 cm of sea level rise is all mostly inplace melting, not calving, right? So, while you qualify with “large ice sheets”, if the issue is how fast sea level will rise then inplace melting is playing the key role right now.
Second, isn’t there a tendency for glaciologists to neglect the effects of changes in the global planetary circulation (i.e. oceanic and atmospheric heat transport to poleward regions)? This is an area that glaciologists traditionally don’t study – but it seems possible that a warming ocean and atmosphere could indeed lead to high rates of in-place melting.
Another thing is that glaciologists seem to be relying fairly heavily on past records of change – but according to the ice core CO2 measurements, the increase in CO2 is now 30X greater, rate-wise, than anything seen in the record. Thus, we might see things happening on a very fast timeframe relative to what has happened in the past.
P.S. I’ve been trying to figure out what the relative contributions to sea level rise are between large ice sheets, mountain glaciers, and thermal expansion, and I get 0.35 mm/yr, 2.3 mm/year and 0.40 mm/year, based on the papers linked to. Tad Pfeffer says it is 24% glaciers and 14% for ice sheets, leaving 62% for thermal expansion – the numbers I came up with were more like 75% glaciers, 13% thermal expansion, and 12% ice sheets… any comments that might clear this up?
My understanding has always been that ice masses, whether ice sheets, ice caps or linear valley glaciers, are divided into zones of accumulation – where ice formation from compressed annual snowfall is greater than melting and evaporation – and ablation zones – where melting and evaporation exceed snowfall and ice formation. Between the two zones is the equilibrium line which in detail varies in location season to season and year to year, but in the longer term either moves higher up the valley glacier or further towards the centre of the ice sheet/cap. Because there is a pressure gradient between the accumulation and ablation zones, the ice moves from te first to the second – from effectively the centre to the edge of the sheet. Movement almost always occurs – even if the ice mass is totally frozen to the bedrock, the upper layers are able to slide by plastic deformation et al over the lower layers; however the movement will be more rapid if the lowest layers melt due to the pressure of the overlying ice, to geothermal heat leakage, and to meltwater from the surface reaching the ice base.
What I am not aware of from the scientific literature is whether there is any evidence of the shrinkage of the accumulation zones on the Greenland or even Antarctica ice masses – whether the equilibrium line is contracting towards the centre of the ice sheets. Ascertaining this would involve a calculation of the mass gain and loss of ice over large areas. Can this be done? Has it been done? – by remote sensing perhaps, or detailed long term measurements at random locations scattered across the ice sheets. It is a matter of speculation whether air masses, warmer now in consequence of global warming processes, carry moister air into the centres of ice masses (warmer air has a greater potential capacity for water vapour than cold). This might result in an actual increase in ice formation in the accumulation zones; at the same time, the warmer air might cause more rapid melting and evaporation and iceberg calving at the margins of the ice sheets. The result would be a steeper lateral pressure gradient within the ice between the accumulation and ablation zones, which in turn would bring about greater ice velocities as recorded at so many valley glaciers and ice sheets/caps around the globe.
A loss of 200 km3 per year from the total 2,650,000 km3 to 3,000,000 km3 of total ice in Greenland is only 0.007% per year.
At that rate, it will take 13,000 years for all the ice to melt.
Increasing sea levels by 0.6 mm per year, it will take 1,600 years to raise sea level by 1 metre.
Basic math indicates that everyone is making this issue out to be way more serious than it is.
[Response: Hmmm…. and so you expect the ice loss rate to stay constant even as temperature rises? And you aren’t concerned about the Eemian sea level rise (4 to 6 meters) with only a few more degrees warmth around Greenland? – gavin]
Re #80 John Lang – that it will take 1,600 years to raise sea level by 1 metre and 13,000 years for all the ice to melt – basic maths calculation. True – if you assume the ice just stays where it is – which it doesn’t. It slides out from the centre of the ice sheets towards the warmer margins – and it will probably slide out faster the warmer the climate gets – see #79. In other words, glacial melting may be an accelerating process. And this acceleration is likely to be accentuated by the replacement of white snowy/ice surfaces by darker bare rock – and also the rise in sea level prises up or floats the snouts of glaciers and the ice sheets initially anchored to the sea bed, exposing more of the ice bottom surface to melting effects and increasing the downslope velocity of the ice from the interior of the land mass. More and more feedback effects of this nature may be responsible for ever more rapid melting, quite probably at rates far greater than the 200 cubic metres a year quoted in #80.
Re #60 — change in w (omega or rotation of earth). From moment of inertia: dw/w = – dr/r assuming conservation of rotational energy and mass. One possible explanation of dw being negative (slow down) is that dr is positive, namely increase in r due to expansion of ocean (not redistribution of mass) due to increase global T (as already measured). There are probably many other, perhaps more valid, hypotheses.
jgradie
Oopps! My comment should have referenced #64 not #60
At that rate, it will take 13,000 years for all the ice to melt.
The Hansen (et al) paper last summer completely discounted a period of thousands of years for a calamitous sea level rise. Of the 3 broad spans – decade, hundreds, and thousands – they found hundreds to be most likely and couldn’t rule out a period of decades once broad scale melting was under way. The two of you might be arguing two related things. Your statement was for “all” Greenland ice melt, and the Hansen paper just examined the scale of time for sea levels to rise calamitously. As for the difference, if Florida winds up looking like a wasp stinger, I won’t begrudge Greenland it’s remaining ice.
Good question Mike. In the case of Antartica there is not a substantial traditional ablation zone. Mass loss is dominantly via calving and sublimation. Ice shelves in particular are not compatible with ablation zones. On the Greenland Ice Sheet the extent of the area experiencing ablation is determined each year using passive satellite microwave data which distinguishes wet snow from dry snow. http://cires.colorado.edu/science/groups/steffen/greenland/melt2005/. It is evident that in the short record available the mean extent has expanded. You are correct that if accumulation increases and ablation increases, the higher balance gradient would necessitate that the glaciers accelerate. It is not evident that the balance gradient has steepened significantly. Even if it does, a large ice sheet outlet glaciers response time is not rapid for such a change to propogate downglacier in the time interval for which we have data. A steeper balance gradient cannot be responsible for the recent observed accelerations. An acceleration from a steeper balance gradient would not be at its maximum at the terminus either. It would be at its maximum near the equilibrium line, where no notable accelerations have been observed.
Mauri and Nick,
Thanks for your responses. I can understand that a uniformally accelerating glacier would thin regardless of melting. I had been thinking that in the case of 25 meters of sea level rise over a few centuries (3 oC of warming), perhaps most of the melting in Greenland would occur on land at low altitude rather than in the sea. But, perhaps the transition would not occur in this century as Nick suggests.
I guess what I am still not understanding is: if the surface melting and resulting lubrication is the origin of the acceleration at the outlet, is not the thinning there better thought of as a result of the increased pressure rather than the “plug” being somehow diminished? What is going on upstream seems more important.
Gavin, You continue to say that current sea level rise is 3 to 4 mm per year. However NASA says since 1992 average is just at 3.05 mm and over the past year there is really no rise or possibly a fall http://www.aviso.oceanobs.com/en/news/ocean-indicators/mean-sea-level/index.html Other types of measurements have run about 1mm to 2mm per year. You are also surely aware that NASA’s Argos system found no rise in sea temperature in the past five years http://www.npr.org/templates/story/story.php?storyId=88520025 and the U.N. admits there has been no atmospheric increase in temperature since 1998 http://www.ibdeditorials.com/IBDArticles.aspx?id=292204249288396
Dear Pat (#73) and d. beck (#59),
I think that the point that I am trying to make is this:
That very thin new Arctic sea ice has pretty much been going all to smitherines over the last 3 weeks, and tons of water vapor has been created, which has to go somewhere, and the part of it that ends up hanging over Greenland can hasten the melting, and it can even cause rain. (I think I read somewhere last year that it actually rained on Greenland at altitudes previously thought unlikely.)
Of course, this cracking up of the sea ice goes on each summer, but now it is occurring earlier in the year and faster over a much greater extent.
OK, and this is weird: I just looked at the sea ice extent graph, and the updated graph from today shows completely different data compared to yesterday’s graph. That’s a really big change. Fortunately, I saved a copy of yesterday’s graph on my HD, which I will copy both to my blog — I think we all deserve an explanation from the National Snow and Ice Data Center.
http://climatechangepsychology.blogspot.com/2008/04/national-snow-and-ice-data-center-graph.html
87:
The ocean temperature that matters for sea level rise would be the (coefficient of expansion weighted) average sea temperature. Only a tiny fraction of this water is close enough to the surface to be measurable by sea surface temperature observations. If indeed sea surface temperatures have in fact stabilized (this is likely a temporary effect) the conduction/advection of heat into the deep oceans would still continue for many hundreds of years. It may be possible to indirectly measure ocean basin average temperatures by sound travel times. In principal gravity measurements would do the trick, but I suspect the noise due to ordinary geological processes might overwhelm the warming signal.
Re #88
“OK, and this is weird: I just looked at the sea ice extent graph, and the updated graph from today shows completely different data compared to yesterday’s graph. That’s a really big change. Fortunately, I saved a copy of yesterday’s graph on my HD, which I will copy both to my blog — I think we all deserve an explanation from the National Snow and Ice Data Center.”
I noticed the sudden downturn on the graph yesterday and also that it coincided with images that were missing signal in a couple of regions. I anticipated that the graph would shortly be adjusted and as you have shown they were.
Aaron Lewis (#75)
Storm tracks will be moving progressively north over the course of the century, more rainfall at higher latitudes — not to mention the polar amplification and extended “growing” (“melting”) season. Rain and ice makes slush. Of course what I am wondering about is on the other side of the earth, where ocean currents are circulating more heat content to greater depths, where rivers run under glaciers, the base of which are below sea level — particularly along the West Antarctic Peninsula.
Additionally, the deeper the heat content goes, the more likely it would seem that it will destabilize methane cathrate deposits sooner rather than later. Not that I have heard anything about such deposits there, but higher oxygen content in the water implies more organic material, which means more material from which to generate methane. And we have found plenty of such deposits in the Arctic region.
Thanks Gavin, I thought you were on vacation or something.
Tenney@88:
Yes, I noticed the NSIDC graph change too. I assume that the earlier graph, which was extreme, was a data processing error. The current graph is still plenty alarming.
These things happen at the cutting edge. We had similarly alarming sea ice area graphs from Cryosphere Today for a short while earlier in the year, before they found and fixed a bug.
Aaron 75, your description takes my concerns a useful step further, as you have identified a collapse mechanism for deep warming ice. As you say if there is water flowing beneath ice then the roof of ice over that flow is warming, and that heat will move upwards progressively weakening and softening the ice mass – even though the ice near the surface looks ok.
Your Missoula Effect sounds like a classic non-linear response. I think the risk posed by these effects utterly overwhelms concerns over calving vs melting.
The recent discoveries of great rivers flowing beneath EAIS and WAIS – including vertical surface movement of plus/minus 3 metres in a matter of a few weeks on ice sheet surfaces which were coupled with changes in basement water flows demonstrates that the security of grounded ice is a myth. Where water flows there energy flows.
The grounded ice can still be full of voids above sea level that allow melt water to circulate bringing its energy contribution, and below sea level where melt water runs out as basement flows under upstream pressure and sea water flows in and out under tidal differential heads. Any crack in the ice joining with the ocean will be influenced by tidal effects, and these cracks will not self-heal. They will widen laterally as the sides and base melts away, and as the ceiling takes heat out of the water vapour. Below sea level water circulation within the grounded ice mass can also be driven by salinity and temperature gradients.
It is not hard to envisage an ice sheet like a hair-brush sitting with its bristles in the water, and the back of the brush being the above high tide solid ‘lid’ on a very unstable structure.
Re #88, even without the strange downward line on the olf chart the nww chart seems bad enough and that downward turn could perhaps be significant becaue the ice cannot reform until next winter once gone I presume?
Chris the point you miss, is that it is not the surface melting that has driven the acceleration. End of story. It is not what is happening upglacier that has been the key. If either was the case then flow would be higher in the summer and acceleration would not have begun at the calving front. Get rid of your false assumption that the meltwater is driving the acceleration. Aaron and Nigel: If you look at the 1962 maps of Greenland or any satellite image from the 1970-1990’s period, the glacier lakes are present. They can deliver some heat, but it is not a new phenomenon. Their extent and volume you would think would be increasing, but this has not been documented. Thus, we do not have a mechanism for additional significant basal warming. The water at 0 C also cannot warm the basal ice which is at the pressure melting point much.
There’s a lot written about heat from friction at the glacier/rock interface; don’t assume a glacier is cold at the bottom, it may be warmer.
Some tidbits: http://www.agu.org/meetings/fm06/fm06-sessions/fm06_C53A.html
“Warm based glaciers are at the pressure melting point at their bed. Heat from the Earth and from basal friction provides energy to melt ice at the bed, …”
http://www.homepage.montana.edu/~geol445/hyperglac/morphology1/
And I’ve been getting in William’s hair* about this over at Stoat http://scienceblogs.com/stoat/2008/04/dont_believe_a_word_of_it_guv.php#comments
————-
*If I have seen further than others, it’s by getting in their hair
I have a question about this part of the post:
“The second mechanism is a ‘Jakobshavn effect,’ coined by Terry Hughes (1986), where a small imbalance of forces caused by some perturbation can cause a substantial non-linear response. In this case an imbalance of forces at the calving front propagates up-glacier.”
But, we know that Dr. Robert Corell witnessed a “substantial non-linear response” to something when 5 km of the Ilulissat glacier roared past in only 90 minutes.
And, while presently it appears that events at the front of the glaciers are the significant areas, won’t it actually be the effects of things such as glacier lake collapses upstream that become ever more frequent and thus more significant, as time goes on?
Re: #95
Pete, the remnants of the older sea ice have all already broken up and appear ready to weaken substantially.
What I would like to know is if long-term, time-series data are available concerning the temperatures of the Northern Ocean, at various depths (surely the U.S. Navy has something on this), and/or if there are in place instruments to measure these temperatures this year and in the future.
Re: #96
Sorry Dr. Pelto, I missed your remark about the glacier lakes. But the number and size of the moulins are increasing somewhat exponentially, are they not?