The North Atlantic between Newfoundland and Ireland is practically the only region of the world that has defied global warming and even cooled. Last winter there even was the coldest on record – while globally it was the hottest on record. Our recent study (Rahmstorf et al. 2015) attributes this to a weakening of the Gulf Stream System, which is apparently unique in the last thousand years.
The whole world is warming. The whole world? No! A region in the subpolar Atlantic has cooled over the past century – unique in the world for an area with reasonable data coverage (Fig. 1). So what’s so special about this region between Newfoundland and Ireland?
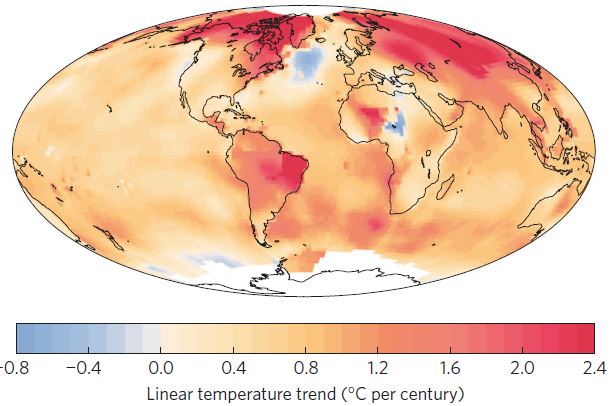
Fig. 1 Linear temperature trend from 1900 to 2013. The cooling in the subpolar North Atlantic is remarkable and well documented by numerous measurements – unlike the cold spot in central Africa, which on closer inspection apparently is an artifact of incomplete and inhomogeneous weather station data.
It happens to be just that area for which climate models predict a cooling when the Gulf Stream System weakens (experts speak of the Atlantic meridional overturning circulation or AMOC, as part of the global thermohaline circulation). That this might happen as a result of global warming is discussed in the scientific community since the 1980s – since Wally Broecker’s classical Nature article “Unpleasant surprises in the greenhouse?” Meanwhile evidence is mounting that the long-feared circulation decline is already well underway.
The Atlantic circulation (AMOC) as part of the global overturning circulation of the oceans in an animation from NASA.
Difficult to measure
Climate models have long predicted such a slowdown – both the current 5th and the previous 4th IPCC report call a slowdown in this century “very likely”, which means at least 90% probability. When emissions continue unabated (RCP8.5 scenario), the IPCC expects 12% to 54% decline by 2100 (see also the current probabilistic projections of Schleussner et al. 2014). But the actual past evolution of the flow is difficult to reconstruct owing to the scarcity of direct measurements. Therefore, in our study we use data on sea surface temperatures in order to infer the strength of the flow: we use the temperature difference between the region most strongly influenced by the AMOC and the rest of the northern hemisphere.
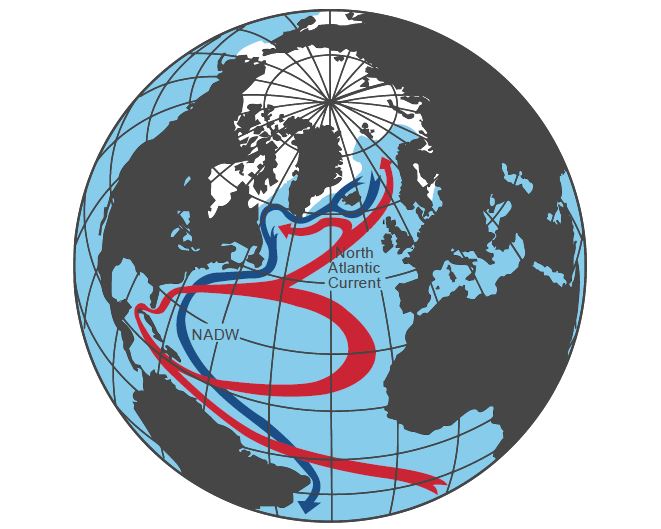
Fig. 2 Schematic of the Atlantic circulation. Surface currents in red, deep currents in blue, sea-ice cover in winter in white. (Source: Rahmstorf, Nature 1997)
Now we are not the first to have inferred from temperature data that the flow must have weakened. Evidence for this was already presented by Dima and Lohmann 2010 or Drijfhout et al. 2012, among others (for further references see the introduction of our paper).
What is new is that we have used proxy reconstructions of large-scale surface temperature (Mann et al, 2009) previously published by one of us (study co-author and RealClimate co-founder Mike Mann) that extend back to 900 AD (see “What we can learn from studying the last millennium (or so)”) to estimate the circulation (AMOC) intensity over the entire last 1100 years (Fig. 3). This shows that despite the substantial uncertainties in the proxy reconstruction, the weakness of the flow after 1975 is unique in more than a thousand years, with at least 99 per cent probability. This strongly suggests that the weak overturning is not due to natural variability but rather a result of global warming.
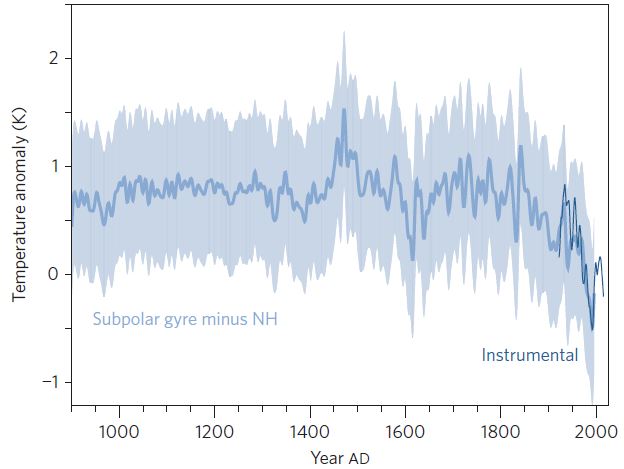
Fig. 3 Time series of the temperature difference between the subpolar North Atlantic and the entire northern hemisphere, which can be interpreted as an indicator of the strength of the Atlantic circulation.
Also in 2014 we again find a remarkable cold bubble over the northern Atlantic – as a look at the NASA website shows. 2014 was globally the warmest year on record, 1 °C warmer than the average for 1880-1920. But the subpolar Atlantic was 1-2 °C colder than that baseline. And even more recently, NOAA last week released the stunning temperature analysis for the past winter shown in Fig. 4. That winter was globally the warmest since records began in 1880. But in the subpolar North Atlantic, it was the coldest on record! That suggests the decline of the circulation has progressed even further now than we documented in the paper.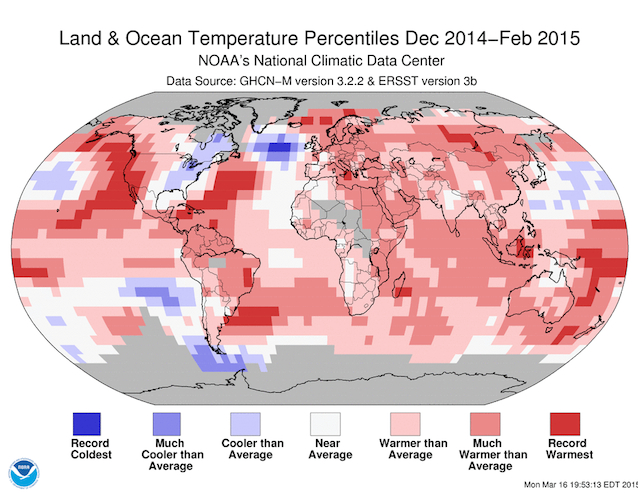
Fig. 4 Temperature anomaly map for the past december-january-february, from NOAA.
The role of Greenland
Another new aspect is the importance of the increasing mass loss of the Greenland ice sheet, which causes extra freshwater to enter the North Atlantic that dilutes the sea water. We have joined forces with the Greenland expert Jason Box who has reconstructed the mass balance of the Greenland ice sheet since 1840 (Fig. 6 of our paper, see also his blog). The ice loss amounts to a freshwater volume which should have made an important contribution to the observed decrease in salinity in the northern Atlantic – probably including the “great salinity anomaly” of the 1970s, famous amongst oceanographers.
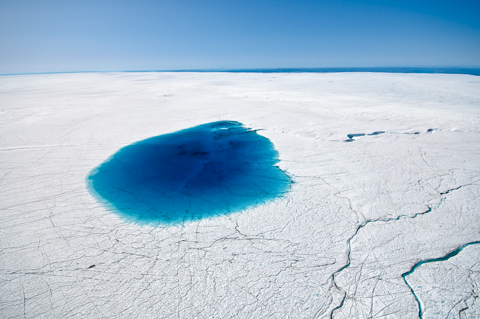
Meltwater on the Greenland ice sheet. Photo: Ian Joughin.
What are the impacts of a slowdown?
The consequences of a large reduction in ocean overturning would look nothing like the Hollywood film The Day After Tomorrow. But they would not be harmless either – e.g. for sea level (Levermann et al. 2005) particularly along the US east coast (Yin et al. 2009), marine ecosystems, fisheries and possibly even storminess in Europe (Woollings et al. 2012). We have studied these consequences some years ago in an interdisciplinary project with colleagues from Bremerhaven, Hamburg and Norway – the results are summarized in Kuhlbrodt et al. 2009.
If our analysis is correct, then this indicates that climate models underestimate the weakening of the Atlantic circulation in response to global warming – probably because the flow in these models is too stable (see Hofmann and Rahmstorf 2009). Although these models predict a significant weakening for the future, they do not suggest this as early as the observations show it (see Fig. 2 of our paper). That the real flow may be more unstable than previously thought would be bad news for the future.
If the circulation weakens too much it can even completely break down – the AMOC has a well-known “tipping point” (Lenton et al., 2008). The latest IPCC report (just like the previous one) estimates a probability of up to 10% that this could happen as early as this century. However, this assessment is based on models that may underestimate the risk, as mentioned above. Expert surveys indicate that many researchers assess the risk higher than the (generally conservative) IPCC, as is the case for sea level. In a detailed survey (Kriegler et al 2009), the 16 experts interviewed saw already at moderate global warming (2-4 °C) a probability of a ‘tipping’ (major reorganisation) of the flow between 5 and 40 percent. With strong global warming (4-8 °C) this probability was even estimated as between 20 and 65 percent.
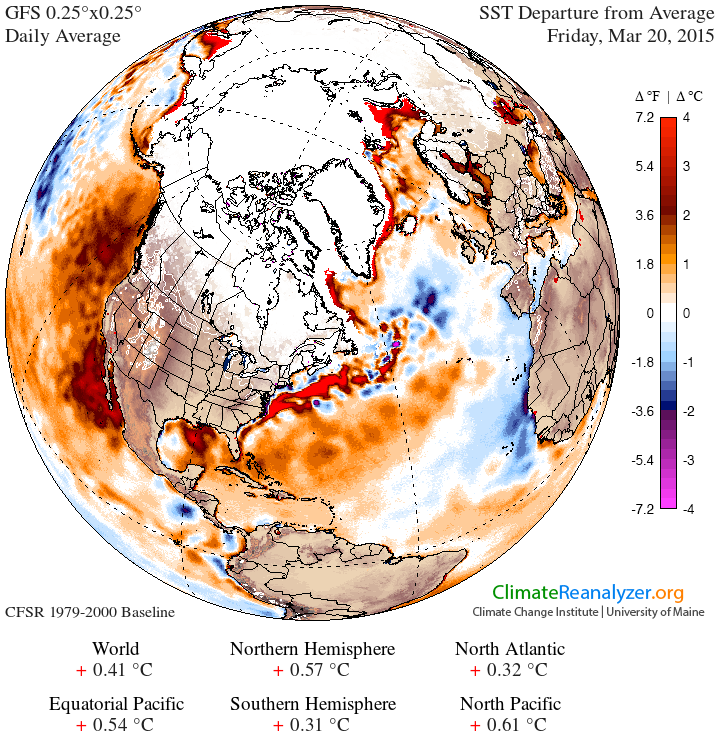
Fig. 5 Sea surface temperature anomaly on 20 March 2015. Note that this is relative to a baseline 1979-2000, which is already a cold period in the subpolar Atlantic. Source: Climate Reanalyzer.
Links
Thermohaline Ocean Circulation (Encyclopedia of Quaternary Sciences)
The Washington Post on our paper
And The Independent
Vox includes comments by some colleagues: Tom Delworth and Gerald Meehl
Peter Sinclair has posted a short video on our paper with interview clips with Mike Mann, Jason Box and myself
Climate Central weighs in with more comments from other scientists on our paper
And here a brand new paper on the impacts of an AMOC shutdown (hat tip to our reader Yvan Dutil)
By coincidence, this came out the same day as our paper: Ten years of ocean monitoring uncovers secrets of changing UK winters
References
Rahmstorf, S., Box, J., Feulner, G., Mann, M., Robinson, A., Rutherford, S., Schaffernicht, E. (2015): Exceptional twentieth-Century slowdown in Atlantic Ocean overturning circulation. Nature Climate Change (online)
W.S. Broecker, “Unpleasant surprises in the greenhouse?”, Nature, vol. 328, pp. 123-126, 1987. http://dx.doi.org/10.1038/328123a0
C. Schleussner, A. Levermann, and M. Meinshausen, “Probabilistic projections of the Atlantic overturning”, Climatic Change, vol. 127, pp. 579-586, 2014. http://dx.doi.org/10.1007/s10584-014-1265-2
M. Dima, and G. Lohmann, “Evidence for Two Distinct Modes of Large-Scale Ocean Circulation Changes over the Last Century”, Journal of Climate, vol. 23, pp. 5-16, 2010. http://dx.doi.org/10.1175/2009jcli2867.1
S. Drijfhout, G.J. van Oldenborgh, and A. Cimatoribus, “Is a Decline of AMOC Causing the Warming Hole above the North Atlantic in Observed and Modeled Warming Patterns?”, Journal of Climate, vol. 25, pp. 8373-8379, 2012. http://dx.doi.org/10.1175/jcli-d-12-00490.1
M.E. Mann, Z. Zhang, S. Rutherford, R.S. Bradley, M.K. Hughes, D. Shindell, C. Ammann, G. Faluvegi, F. Ni, Global Signatures and Dynamical Origins of the Little Ice Age and Medieval Climate Anomaly, Science, 326, 1256-1260, 2009. http://dx.doi.org/10.1126/science.1177303
A. Levermann, A. Griesel, M. Hofmann, M. Montoya, and S. Rahmstorf, “Dynamic sea level changes following changes in the thermohaline circulation”, Clim Dyn, vol. 24, pp. 347-354, 2005. http://dx.doi.org/10.1007/s00382-004-0505-y
J. Yin, M.E. Schlesinger, and R.J. Stouffer, “Model projections of rapid sea-level rise on the northeast coast of the United States”, Nature Geosci, vol. 2, pp. 262-266, 2009. http://dx.doi.org/10.1038/ngeo462
T. Woollings, J.M. Gregory, J.G. Pinto, M. Reyers, and D.J. Brayshaw, “Response of the North Atlantic storm track to climate change shaped by ocean–atmosphere coupling”, Nature Geosci, vol. 5, pp. 313-317, 2012. http://dx.doi.org/10.1038/NGEO1438
T. Kuhlbrodt, S. Rahmstorf, K. Zickfeld, F.B. Vikebø, S. Sundby, M. Hofmann, P.M. Link, A. Bondeau, W. Cramer, and C. Jaeger, “An Integrated Assessment of changes in the thermohaline circulation”, Climatic Change, vol. 96, pp. 489-537, 2009. http://dx.doi.org/10.1007/s10584-009-9561-y
M. Hofmann, and S. Rahmstorf, “On the stability of the Atlantic meridional overturning circulation”, Proceedings of the National Academy of Sciences, vol. 106, pp. 20584-20589, 2009. http://dx.doi.org/10.1073/pnas.0909146106
T.M. Lenton, H. Held, E. Kriegler, J.W. Hall, W. Lucht, S. Rahmstorf, and H.J. Schellnhuber, “Tipping elements in the Earth’s climate system”, Proceedings of the National Academy of Sciences, vol. 105, pp. 1786-1793, 2008. http://dx.doi.org/10.1073/pnas.0705414105
E. Kriegler, J.W. Hall, H. Held, R. Dawson, and H.J. Schellnhuber, “Imprecise probability assessment of tipping points in the climate system”, Proceedings of the National Academy of Sciences, vol. 106, pp. 5041-5046, 2009. http://dx.doi.org/10.1073/pnas.0809117106
#100 Hank Roberts: That’s brilliant: “victim bullies.” How are neologisms like studies? It’s the useful ones that count. But that’s another matter, hard to foresee.
This neologism is close to the one that I am desperately seeking. I am desperately seeking one that describes what a group of denialists does when they call themselves, for example (there are others), the Gallileo movement– as if the ideas of this movement will be vindicated by history.
The previous post is good too, and author’s comment: “Why, thank you very much… Eli has always believed that it is important to state the obvious early and often, as a) it tends to get lost in many complex discussions and b) half the class is surfing YouTube at any time.”
http://rabett.blogspot.com/2006/10/all-climate-is-global.html
Jim @ Baird. You are aware that holding atmospheric concentration fixed, is far more stringent then
holding the emission rate fixed? I did the exercise a couple of years back. Flat concentration requires circa a 50% cutback with first couple of years, and ninety percent cutbacks not too long afterwords. Holding emissions constant is just a slightly slower slowboat to oblivion.
My last comment is not about #100, but about the notion of “victim bullies” in the Rabett Run blog post linked by Hank Roberts:
29 Mar 2015 at 10:30 AM
http://rabett.blogspot.com/2006/10/does-this-remind-you-of-anyone-you.html
– See more at: https://www.realclimate.org/index.php/archives/2015/03/whats-going-on-in-the-north-atlantic/comment-page-2/#comment-627742
Thomas, I do know the difference. As a Canadian I am fully aware that my government makes all kinds of nutty claims about reducing the intensity of emissions from oil sands production as if it was a good thing for the planet.
What I am trying to suggest is moving heat into the deep, replicating the natural analogy, could turn the boat around.
More on the relevance of Rossby et al. (2014): M. Mann argued in his FB post (see also several comments in this blog) why the “stable Gulf Stream” argument in Rossby’s paper (based on the Oleander measurements) does not contradict Rahmstorf et al.’s results of weakening AMOC. This relation between the GS and AMOC has been the exact subject of a new paper: Ezer (2015), Detecting changes in the transport of the Gulf Stream and the Atlantic overturning circulation… (http://dx.doi.org/10.1016/j.gloplacha.2015.03.002). The new paper compares the same Oleander data as in Rossby’s paper with the RAPID data and shows that the Oleander’s Gulf Stream is NOT correlated with AMOC. Only the flow through the entire Oleander line (GS plus Slope Current plus Sargasso Sea- not shown in Rossby et al) is indeed correlated with AMOC. The 20yr Oleander record is also quite short to detect climate changes. Rossby is a very respectable and great oceanographer, so it is a pity that skeptics web sites misuse his result for arguing against climate change studies whether his data are relevant or not (they often emphasize that he is a “real oceanographer” using measurements while climate scientists use unreliable models).
[Response: Thanks for that update Tal, much appreciated! -stefan]
Something that otherwise sensible people immediately start expecting from a Gulf Stream shutdown:
http://truth-out.org/opinion/item/29963-when-is-the-next-ice-age-it-may-come-sooner-than-we-think
By everything actually scientific I’ve read, that is nonsense — but given that truthout.org is usually a relatively sane source of info, would someone more knowledgeable please provide them the more detailed objections I lack?
Food for thought Marvell.
I remember wondering, when I read this piece nearly a decade ago, where we’d be with mitigation when this moment arrived. http://oceanmotion.org/html/impact/globalwarming.htm
The funny thing is that while there is a cold area south east of Greenland “downstream” of there North West Europe has actually got warmer over the past hundred years. The slowdown seems to have affected only part of the Gulf Stream.
DP,
I’ve not read the whole thread of comments, but it is my understanding that it is the gyre in the North Atlantic that mainly transports warmth to Europe in winter, not the AMOC. I recall a Carl Wunsch paper in which he argues that most of the heat flux is atmospheric from further south, not oceanic.
***
I’m pondering at present what this might mean for Arctic Sea Ice (my obsession). I suspect not much. The decline in volume has been driven by ice-albedo feedback enabled by AGW as the feedback ‘seeks’ a new pseudo-equilibrium for sea ice. This has happened over the same period as figure 3 shows a substantial decline in the AMOC, which suggests little future effect. In theory a decline in Arctic Basin Atlantic Water (AW) may result, but AW lies around 70m below the surface, so aside from diffusive fluxes doesn’t seem to play much of a role compared to surface warming, warming river discharge, and warming due to the ice albedo effect.
I expect that the coming years will see a reduction in rate of volume loss of Arctic sea ice, but this will be due to the negative thickness-growth feedback. That it is likely to follow news of the AMOC slowing may be interpreted as a causal connection, I do not think that would be a sound conclusion.
Any ideas on Atlantic circulation during the Messinian Salinity Crisis 5-6 million years ago?
And while we’re at it, the Atlantic circulation during the middle Miocene when Co2 was as high as today?
Stefan,
Do these critiques by McIntyre of your latest paper carry any weight?
http://climateaudit.org/2015/03/28/rahmstorfs-first-trick/
Sincerely,
Jeff
Jeff at 112,
Generally speaking, nothing by McIntyre carries any weight outside the denialist community. He did once detect a math error in a NASA press release. That’s his entire contribution to climate science, as far as I’m aware.
[Response: Actually, it was more substantial than that, but nothing like as important as subsequently proclaimed in the blogosphere/media. – gavin]
Jeff
A number of people, starting with Bill H, have pointed out that McIntyre confused water mass movement and temperature. One discussion is on Hotwhopper here .
As a result McIntyre’s “debunking” of the AMOC paper is meaningless.
(for it is he)
Entropic, Many thanks for helping me gain my 15 minutes of fame. After a fairly gruelling time, involving a fair amount of hominem attacks, Steve Mc made some amendments to his post to try to cover his error – none too successfully. Of course he didn’t say this, merely that he realised “there have been misunderstandings”, not specifying by whom.
Needless to say nobody, me included, received any acknowledgement for pointing out his error. Bit rich for him therefore to continue to claim that scientists don’t give him credit for assistance – for instance he claims that he provided corrections to the supplementary data in Mann Rutherford et al. 2008, and received no acknowledgement. Any truth in this?
One term for that is the Galileo Gambit
Hat tip to Carl Sagan.
Hi
I see you are familiar with Rahmstorf’s AMOC index. Can you tell me how they calculate it since it doesn’t appear to be just = SPG temp – NH temp?
Also Rahmstorf doesn’t report the statistics supporting the relationship between their index and the dN15 tracer series. I’m sure they will have calculated this and it is important to their conclusions, do you know what happened here? I’ve been pretty critical of this elsewhere because it strikes me as a strange omission – just leaving people to eyeball a graph, but then going on to claim a physical relationship.
Finally the paper uses Mann 2009 to calculate historic temps for the series, but I understood GCMs aren’t very good at the SPG temp. There is no comment on this in the paper. It would be useful to understand more clearly what the implications are.
Recent changes in the freshwater composition east of Greenland (pages 2326–2332)
L. de Steur, R. S. Pickart, D. J. Torres and H. Valdimarsson
Article first published online: 1 APR 2015 | DOI: 10.1002/2014GL062759
Can somebody please tell me the length of time it takes for water that sinks in the thermohalyn circulation off Norway to rise again in the Southern ocean?