A recent story in the Guardian claims that new calculations reduce the uncertainty associated with a global warming:
A revised calculation of how greenhouse gases drive up the planet’s temperature reduces the range of possible end-of-century outcomes by more than half, …
It was based on a study recently published in Nature (Cox et al. 2018), however, I think its conclusions are premature.
The calculations in question involved both an over-simplification and a set of assumptions which limit their precision, if applied to Earth’s real climate system.
They provide a nice idealised and theoretical description, but they should not be interpreted as an accurate reflection of the real world.
There are nevertheless some interesting concepts presented in the analysis, such as the connection between climate sensitivity and the magnitude of natural variations.
Both are related to feedback mechanisms which can amplify or dampen initial changes, such as the connection between temperature and the albedo associated with sea-ice and snow. Temperature changes are also expected to affect atmospheric vapour concentrations, which in turn affect the temperature through an increased greenhouse effect.
However, the magnitude of natural variations is usually associated with the transient climate sensitivity, and it is not entirely clear from the calculations presented in Cox et al. (2018) how the natural variability can provide a good estimate of the equilibrium climate sensitivity, other than using the “Hasselmann model” as a framework:
(1) 
Cox et al. assumed that the same feedback mechanisms are involved in both natural variations and a climate change due to increased CO2. This means that we should expect a high climate sensitivity if there are pronounced natural variations.
But it is not that simple, as different feedback mechanisms are associated with different time scales. Some are expected to react rapidly, but others associated with the oceans and the carbon cycle may be more sluggish. There could also be tipping points, which would imply a high climate sensitivity.
The Hasselmann model is of course a gross simplification of the real climate system, and such a crude analytical framework implies low precision for when the results are transferred to the real world.
To demonstrate such lack of precision, we can make a “quick and dirty” evaluation of how well the Hasselmann model fits real data based on forcing from e.g. Crowley (2000) through an ordinary linear regression model.
The regression model can be rewritten as  , where
  ,
,  , and
, and  . In addition,
  and
and  are the regression coefficients to be estimated, and
  is a constant noise term (more details in the R-script used to do this demonstration).
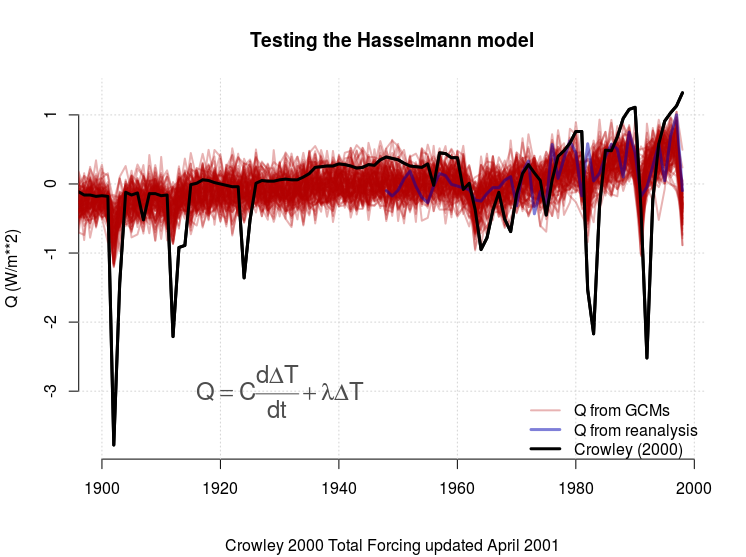
It is clear that the model fails for the dips in the forcing connected volcanic eruptions (Figure 1). We also see a substantial scatter in both  (some values are even negative and hence unphysical) and
  (Figure 2).
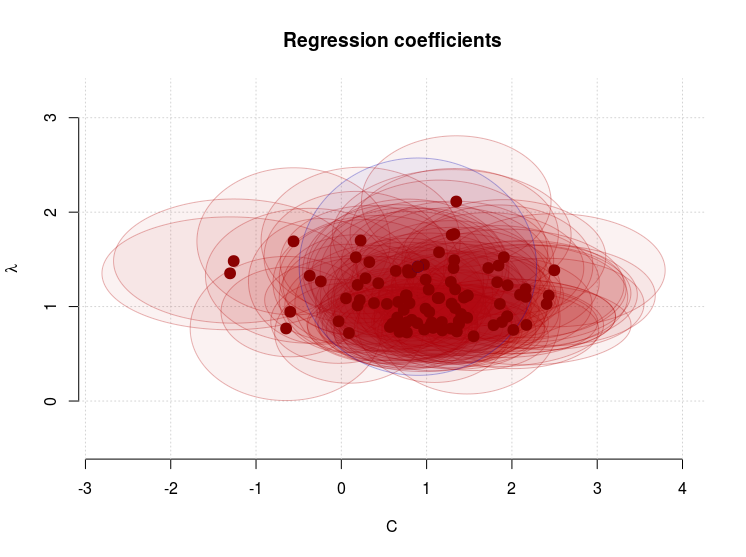
The climate sensitivity is closest associated with , for which the mean estimate was 1.11 , with a 5-95-percentile interval of 0.74-1.62.
We can use these estimates in a naive attempt to calculate the temperature response for a stable climate with  and a doubled forcing associated with increased CO2.
It’s plain mathematics. I took a doubling of 1998 CO2-forcing of 2.43 from Crowley (2000), and used the non-zero terms in the Hasselmann model,
  .
.
The mean temperature response to a doubled CO2-forcing for GCMs was 2.36 , with a 90% confidence interval: 1.5 – 3.3
 . The estimate from reanalysis was 1.71
The true equilibrium climate sensitivity for the climate models used in this demonstration is in the range 2.1 – 4.4 , and the transient climate sensitivity is 1.2 – 2.6 (IPCC AR5, Table 8.2).
This demonstration suggests that the Hasselmann model underestimates the climate sensitivity and the over-simplified framework on which it is based precludes high precision.
Another assumption made in the calculations was that the climate forcing Q looks like a white noise after the removal of the long-term trends.
This too is questionable, as there are reasons to think the ocean uptake of heat varies at different time scales and may be influenced by ENSO, the Pacific Decadal Oscillation (PDO), and the Atlantic Multi-decadal Oscillation (AMO). The solar irradiance also has an 11-year cycle component and volcanic eruptions introduce spikes in the forcing (see Figure 1).
Cox et al.’s calculations were also based on another assumption somewhat related to different time scales for different feedback mechanisms: a constant “heat capacity” represented by C in the equation above.
The real-world “heat capacity” is probably not constant, but I would expect it to change with temperature.
Since it reflects the capacity of the climate system to absorb heat, it may be influenced by the planetary albedo (sea-ice and snow) and ice-caps, which respond to temperature changes.
It’s more likely that C is a non-linear function of temperature, and in this case, the equation describing the Hasselmann model would look like:
(2) 
Cox et al.’s calculations of the equilibrium climate sensitivity used a key metric  which was derived from the Hasselmann model and assumed a constant C:
  . This key metric would be different if the heat capacity varied with temperature, which subsequently would affect the end-results.
I also have an issue with the confidence interval presented for the calculations, which was based on one standard deviation  . The interval of
  represents a 66% probability, and can be illustrated with three numbers: and two of them are “correct” and one “wrong”, which means there is a 1/3 chance that I pick the “wrong” number if I were to randomly pick one of the three.
To be fair, the study also stated the 90% confidence interval, but it was not emphasised in the abstract nor in the press-coverage.
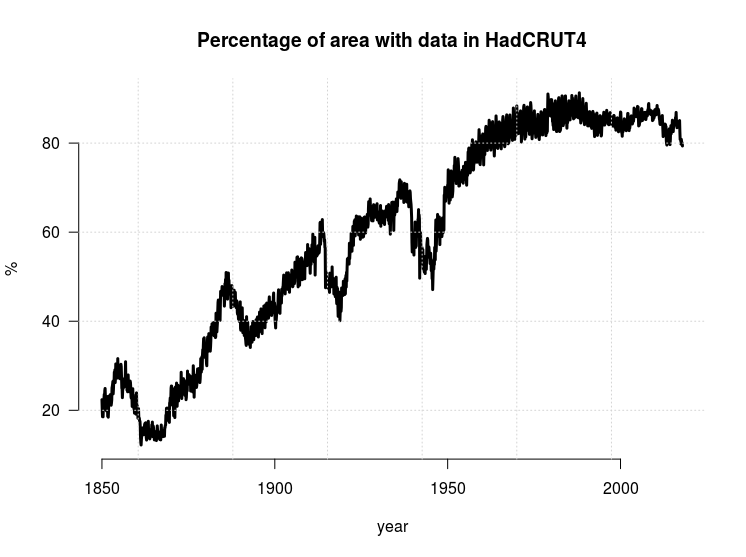
One thing that was not clear, was whether the analysis, that involved both observed temperatures from the HadCRUT4 dataset and global climate models, took into account the fact that the observations do not cover 100% of Earth’s surface (see RC post ‘Mind the Gap!’).
A spatial mask would be appropriate to ensure that the climate model simulations provide data for only those regions where observations exists. Moreover, it would have to change over time because the thermometer observations have covered a larger fraction of Earth’s area with time (see Figure 3).
An increase in data coverage will affect the estimated variance  and one-year autocorrelation
  associated with the global mean temperature, which also should influence the the metric .
My last issue with the calculations is that the traditional definition of climate sensitivity only takes into account changes in the temperature. However, there is also a possibility that a climate change involves a change in the hydrological cycle. I have explained this possibility in a review of the greenhouse effect (Benestad, 2017), and this possibility would add another term the equation describing the Hasselmann model.
I nevertheless think the study is interesting and it is impressive that the results are so similar to previously published results. However, I do not think the results are associated with the stated precision because of the assumptions and the simplifications involved. Hence, I disagree with the following statement presented in the Guardian:
These scientists have produced a more accurate estimate of how the planet will respond to increasing CO2 levels
References
- P.M. Cox, C. Huntingford, and M.S. Williamson, "Emergent constraint on equilibrium climate sensitivity from global temperature variability", Nature, vol. 553, pp. 319-322, 2018. http://dx.doi.org/10.1038/nature25450
- T.J. Crowley, "Causes of Climate Change Over the Past 1000 Years", Science, vol. 289, pp. 270-277, 2000. http://dx.doi.org/10.1126/science.289.5477.270
- R.E. Benestad, "A mental picture of the greenhouse effect", Theoretical and Applied Climatology, vol. 128, pp. 679-688, 2016. http://dx.doi.org/10.1007/s00704-016-1732-y
James Annan has a new post saying that this post “misses the mark.” Worth a read.
-rasmus@49
thanks very much for the answer rasmus. That’s what I thought! :-)
You say- ” I think this is a very crude approach, due to the brutal simplification and several assumptions/approximations which do not really hold. Hence, the calculations cannot give a high precision that reflect the real world.”
which butts up against Peter Cox saying before: “The constant heat capacity C in this model is a simplification that is known to be a poor representation of ocean heat uptake on longer timescales. However, we find that it still offers very useful guidance about global temperature variability on shorter timescales”.
Rasmus then suggests: ” If the terms C and \lambda are no longer constant, but functions of T, then that changes the mathematics and the derivations of the solutions. Perhaps they can be assumed to be roughly constant, but that would require an extra evaluation. We should not assume that the climate sensitivity is constant either, unless there are studies suggesting it is.”
and “…such simple models and analysis are beautiful and useful for discussing topics like these…”
So if I, as a plodder, understand you correctly I am thinking that ECS is similar too a ‘theory of everything’ for CO2. Where ‘C and \lambda’ are kind of similar to the speed of light, C in MC2, where C is not actually constant under all circumstances in the real world, but is assumed it is in E=MC2.
So what I think you’re saying, in my own words, is that Cox et al has simultaneously made too many incorrect assumptions and over simplified the variability / dynamics involved in the climate system. Therefore their conclusion for ECS is unreliable and unsupported by the known science and their own Math.
As a theoretical exercise the work, like all other’s on ECS to date, it has some value and uses, however their ECS range can not be practically applied to the real world for long term T forecasting.
iow, the ‘Variability Jury’ is still out on mathematically sound ‘Attribution’ of all aspects of the Climate System?
Is that a reasonable take-away message for the average Joe?
thx
Meanwhile in the middle of a Weak La Nina cycle, CO2 continues to set new world records for January @ML of ~408ppm, +2ppm above last January.
thx niglej, i agree with your exceptions/buts too. tricky terrain on the best of days. :)
I wanted to thank you all for a scientific discussion with the graciousness and honest clarification, discussion, and evaluation that cannot occur when snipers from the unskeptical “skeptic” universe jump in to undermine the collective wisdom that is real science. I was tempted to say something earlier, but the excellence of the overall discussion was the reason I keep coming back to RealClimate, and having nothing to add, I added nothing.
Thank you all again.
There has to be a tipping point at some point in time because if we see a constant rise in CO2 eventually it will crowd out all other molecules in the atmosphere. We havent seen a tipping point yet and there has been no acceleration in any variable that has been measured and dont refer me to SLR because the accuracy resolution of the satellites is greater than the data output scale. Temperatures in the statopshere have not gone up and the GISS data for troposphere is adjusted ad nauseum. There are no more storms than there ever were. You climate scientists have hoisted the biggest fraud on mankind ever.
AT 56: You climate scientists have hoisted the biggest fraud on mankind ever.
BPL: If you have evidence of fraud, produce it. If not, STFU.
Alan Tomalley @56
Complete nonsense. If all fossil fuels are burned it is estimated that CO2 levels would reach about 5000 ppm. That 0.5% of the atmosphere would hardly be crowding out all other molecules. Regardless, what does this have to do with tipping points or anything for that matter? Nothing.
More nonsense. Satellite accuracy is quite good and well under the observed rise in sea levels. Ask the people of Miami Beach and Micronesia if sea levels have risen.
AGW theory predicts that the stratosphere will cool, which is exactly what is observed.
And the adjustments are clearly justified.
Regardless, the planet is warming as seen by sea level rise (as observed by accurate satellites and tide gauges contrary to your false claim), increased ocean temperatures as measured by the ARGO system, melting glaciers (confirmed by observations and GRACE satellites), longer growing seasons, the migration of species poleward and to higher elevations, melting permafrost, decreasing arctic sea ice, and increased humidity.
Not a prediction of AGW theory. Only increased storm strength, which is clearly occurring.
When did this fraud start? Was it Fourier in the 1820s when he first proposed the idea? Perhaps it was Tyndall in 1854 when he measured the radiative properties of atmospheric gases? Arrhenius in 1896 when he predicted the burning of fossil fuels would warm the planet? Maybe it was E. O. Hulbert of the Naval Research Lab in the early 1930s when he added water vapor to the theory? It’s a naval conspiracy perhaps? Maybe Chandler that British steam engineer in the 1930s who first showed the planet was warming. Perhaps it is a British conspiracy? Or how about Plass in 1954 when he wrote on the role of CO2 in climate change? After all, he did work for the military and it could be a military fraud, right? Was Revelle in on it when he showed the oceans couldn’t absorb the excess CO2 in 1956? Scripps Institute of Ocean might have been just a liberal scam, right? Was the President’s Science Advisory Commission in on the conspiracy when they wrote their report in 1965? Manabe in 1967 when he made his first model? Can’t trust those Japs, right? Was the National Academy of Science in on it already in 1979 when they produced the Charney Report on CO2 and climate or their report in 1983 on changing climate? Please tell me when and how this fraud started and how it works. How are the thousands and thousands of scientists who have worked on the problem since the 1820s complicit? Who got them all to toe the line and continue this big fraud for such a long time?
If you want to criticize the science and make accusations of fraud, I suggest you learn something about the science and its history before you make your silly claims.
@56
Wow, the Dunning-Kruger is strong in this one.
CCH (@58): Mind if I post that last big paragraph on FB? I think it’s an excellent takedown of the “it’s a fraud” or “it’s a liberal plot” claims. Thanks!
MartinJB @60
Most certainly. I’d be flattered.
I’ve posted this in various forms over the years on blogs inspired by Spencer Weart’s work: The Discovery of Global Warming in response to the conspiracy meme. Sometimes I can even be a bit more snarky. I also attempt to use a brief history of the science when I give talks. Again to let people know that AGW isn’t something just thought up by some new world order in order to gain control of the globe or whatever.
The history is powerful IMHO as it helps support the robustness of the science.
CCHolley @58, MartinJB @60
The name of that British engineer in the 1930s was Guy Stewart Callendar.
Thanks CCH! I added Exxon’s in-house report in 1992. And thanks to Digby. I was wondering why I couldn’t find a reference to him…
Digby Scorgie @62
Yikes, not sure where my brain pulled that name from. (O_O)
Thank you for the correction, apparently my memory isn’t working as good as it used to.
#62–
And you can read about Callendar’s life, times and work here, if you wish:
https://hubpages.com/education/Global-Warming-Science-And-The-Dawn-Of-Flight
(There are also articles on Fourier; Claude Pouillet (who made a notable early estimate of the solar ‘constant’, as it was then believed to be); Tyndall; Nils Ekholm (among whose many accomplishments number an excellent description of the ‘top down’ aspect of greenhouse warming, and a notable instance of trusting data in the clutch); and of course Arrhenius–with a significant sidebar on Samuel Langley, who you probably did not know contributed crucially to Arrhenius’s work.)
Gah! In a bizarre misclicking accident, I linked the Arrhenius piece.
The Callendar piece is here:
https://hubpages.com/education/Global-Warming-Science-And-The-Wars
Kevin McKinney @65&66
Thank you for the links, good stuff.
I’m particularly enamored by Langley’s work as he was Director of the Allegheny Observatory which is part of the university of my undergraduate degree. He gets a side bar in my presentations in showing early on through measurements of the moon that the CO2 effect is not saturated.
However, we do try to forget about his work in aviation. I think BPL would agree.
CCH,
They used to hang the Langley aerodrome in Forbes Quad, but they’ve since moved it somewhere else.
Link, please?
Hank,
Annan, “But I thought I should point out that at least these two criticisms of Schneider and Benestad seem basically unfounded and unfair.”
start here, https://bskiesresearch.wordpress.com/2018/01/25/more-about-cox-et-al/ and follow links to prior comments and after
Re 69
Hank,
James Annan’s blog can be reached by going to James’ Empty Blog in the List of Other Opinions. His third post on this subject is here: http://julesandjames.blogspot.co.uk/2018/01/blueskiesresearchorguk-cox-et-al-part-3.html
BPL,
Unfortunately I graduated before the Forbes Quad was completed so never got to see the Langley aerodrome. Glad to hear the University actually honored Langley’s work in aviation. Seems history generally judges him harshly for his failed attempts at human flight while ignoring his many accomplishments.
FYI:
https://zenodo.org/record/1183781#.WpEwIXCUnDs