Guest Commentary by Mauri Pelto (Nichols College)
Preliminary data reported from the reference glaciers of the World Glacier Monitoring Service (WGMS) in 2018 from Argentina, Austria, China, France, Italy, Kazakhstan, Kyrgyzstan, Nepal, Norway, Russia, Sweden, Switzerland and United States indicate that 2018 will be the 30th consecutive year of significant negative annual balance (> -200mm); with a mean balance of -1247 mm for the 25 reporting reference glaciers, with only one glacier reporting a positive mass balance (WGMS, 2018).
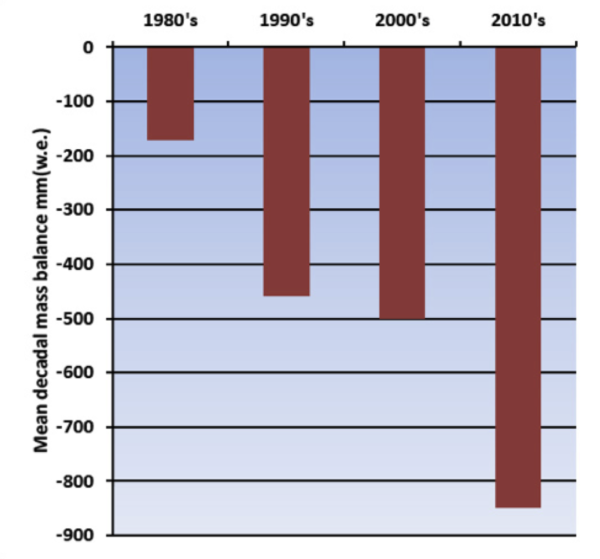
I have spent 35 consecutive summers measuring mass balance on alpine glaciers, and more than 750 nights in a tent to record their response to climate change. A decade ago I described what was happening to alpine glaciers here at RC, but the continued signal of mass loss is inescapable and has been getting worse. The decadal mean annual mass balance of WGMS reference alpine glaciers was -171 mm in the 1980’s, -460 mm in the 1990’s, -500 mm for 2000’s and – 850 mm for 2010-2018.
Just as people need to consume as many calories as the expend or they will lose mass, glaciers need to accumulate as much snow and ice as is lost to melt and calving icebergs in order to survive. After 30 consecutive years of alpine glacier mass loss it is clear that the “diet/lifestyle” of alpine glaciers is not healthy and as the climate they live in changes, alpine glaciers will continue a downward health spiral.
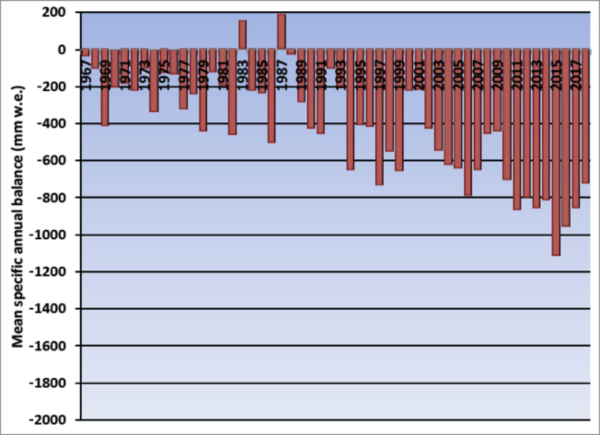
Alpine glaciers are recognized as one of most sensitive indicators of climate change. WGMS record of mass balance and terminus behavior (WGMS, 2017) providing a global index for alpine glacier behavior. This record illustrates a consistent signal from alpine glaciers around the world of significant mass loss and consequent retreat. Glacier mass balance is the difference between accumulation and ablation, reported here in mm of water equivalence (mm). Mean annual glacier mass balance in 2017 was -921 mm for the 42 long term reference glaciers and -951 mm for all 142 monitored glaciers. Figure 1 and 2 are graphs of global glacier mass change showing the annual balance for a set of global reference glaciers with more than 30 continued observation years for the time-period 1950-2018.
Glacier retreat reflects sustained negative mass balances over the last 30 years (Zemp et al., 2015). The increasing rate of glacier mass loss during a period of retreat indicates alpine glaciers are not approaching equilibrium and retreat will continue to be the dominant terminus response (Pelto, 2018). Ongoing global glacier retreat is currently affecting human society by increasing the rate of sea-level rise, changing seasonal discharge in glacier fed rivers, and increasing geo-hazard potential (Huss et al, 2017) (pdf). The recent mass losses 1991-2010 are due to anthropogenic forcing (Marzeion et al. 2014).
The cumulative mass balance from 1980-2018 is -21.7 m, the equivalent of cutting a 24 m thick slice off the top of the average glacier (Figure 1). The trend is remarkably consistent across regions (WGMS, 2017). WGMS mass balance from 42 reference glaciers, which have a minimum 30 years of record, is not appreciably different from that of all monitored glaciers at -21.5 m.
The number of reference glaciers is small compared to the total number of alpine glaciers (~200,000) in the world, but has proved to be a good approximation of global alpine glacier change. Marzeion et al (2017) compared WGMS direct observations of mass balance on a few glaciers to both remote sensing mass balance calculations based all alpine glaciers over the shorter period of available satellite data and climate driven mass balance model calculations and found that each method yields reconcilable estimates relative to each other and fall within their respective uncertainty margins. The WGMS record appears to have a slight negative bias compared to modeling and remote sensing approaches, but this bias has been much reduced with the regionalized approach now used by WGMS.
In 2018 exceptional glacier melt was noted across the European Alps, leading to high snowlines and contributing to large negative mass balance of glaciers. In the European Alps, annual mass balance has been reported from 17 glaciers in Austria, France, Italy and Switzerland. All 17 had negative annual balances, with 15 exceeding -1000 mm with a mean of -1640 mm. This continues the pattern of substantial negative balances in the Alps, which will equate to further terminus retreat. Of 81 observed glaciers in 2017 in Switzerland, 80 retreated, and only 1 was stable (Huss et al, 2018, [Fr]). In 2017, 83 glaciers were observed in Austria,; 82 retreated, and again only one was stable. Mean terminus retreat was 25 m, the highest observed since 1960 when mean length change reporting began (Lieb and Kellerer-Pirklbauer, 2018).
In Norway and Sweden, mass balance surveys with completed results are available for eight glaciers; all had negative mass balances with an average loss of -1420 mm w.e. All 25 glaciers with terminus observations during the 2007-2017 period have retreated (Kjøllmoen et al, 2018).
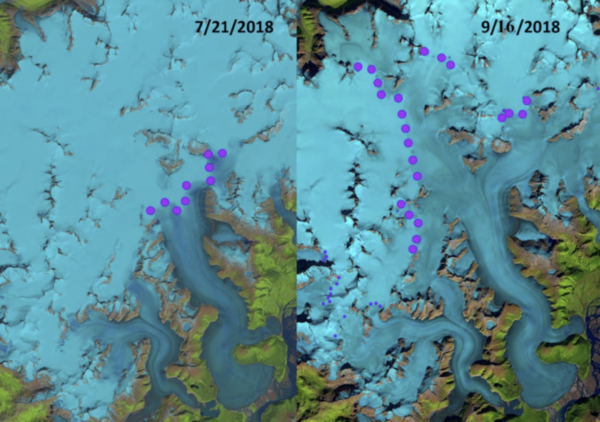
In western North America data has been submitted from 11 glaciers in Alaska and Washington in the United States. All eleven glaciers reported negative mass balances with a mean loss of -870 mm. The longest mass balance record in North America is from Taku Glacier in Alaska. In 2018 the glacier had its most negative mass balance since the beginning of the record in 1946 and the highest end of summer snowline elevation at 1400 m. The North Cascade Range, Washington from 2014-2018 had the most negative five-year period for the region of the 1980-2018 WGMS record.
In the High Mountains of Asia (HMA) data was reported from ten glaciers including from China, Kazakhstan, Kyrgyzstan and Nepal. Nine of the ten had negative balances with a mean of -710 mm. This is a continuation of regional mass loss that has driven thinning and a slowdown in glacier movement in 9 of 11 regions in HMA from 2000-2017 (Dehecq et al. 2018).
The key take away is the same for alpine glaciers around the globe, warming temperatures lead to mass balance losses, which leads to velocity slow down. Mass balance is the key driver in glacier response, and a sustained negative mass balance leads to thinning and retreat, which leads to a glacier velocity decline, whether the glacier is in the Himalayas, Alps or Andes.
References
- M. Zemp, H. Frey, I. Gärtner-Roer, S.U. Nussbaumer, M. Hoelzle, F. Paul, W. Haeberli, F. Denzinger, A.P. Ahlstrøm, B. Anderson, S. Bajracharya, C. Baroni, L.N. Braun, B.E. Cáceres, G. Casassa, G. Cobos, L.R. Dávila, H. Delgado Granados, M.N. Demuth, L. Espizua, A. Fischer, K. Fujita, B. Gadek, A. Ghazanfar, J. Ove Hagen, P. Holmlund, N. Karimi, Z. Li, M. Pelto, P. Pitte, V.V. Popovnin, C.A. Portocarrero, R. Prinz, C.V. Sangewar, I. Severskiy, O. Sigurđsson, A. Soruco, R. Usubaliev, and C. Vincent, "Historically unprecedented global glacier decline in the early 21st century", Journal of Glaciology, vol. 61, pp. 745-762, 2015. http://dx.doi.org/10.3189/2015JoG15J017
- M.S. Pelto, "How Unusual Was 2015 in the 1984–2015 Period of the North Cascade Glacier Annual Mass Balance?", Water, vol. 10, pp. 543, 2018. http://dx.doi.org/10.3390/w10050543
- M. Huss, B. Bookhagen, C. Huggel, D. Jacobsen, R. Bradley, J. Clague, M. Vuille, W. Buytaert, D. Cayan, G. Greenwood, B. Mark, A. Milner, R. Weingartner, and M. Winder, "Toward mountains without permanent snow and ice", Earth's Future, vol. 5, pp. 418-435, 2017. http://dx.doi.org/10.1002/2016EF000514
- B. Marzeion, J.G. Cogley, K. Richter, and D. Parkes, "Attribution of global glacier mass loss to anthropogenic and natural causes", Science, vol. 345, pp. 919-921, 2014. http://dx.doi.org/10.1126/science.1254702
- B. Marzeion, N. Champollion, W. Haeberli, K. Langley, P. Leclercq, and F. Paul, "Observation-Based Estimates of Global Glacier Mass Change and Its Contribution to Sea-Level Change", Surveys in Geophysics, vol. 38, pp. 105-130, 2016. http://dx.doi.org/10.1007/s10712-016-9394-y
- A. Dehecq, N. Gourmelen, A.S. Gardner, F. Brun, D. Goldberg, P.W. Nienow, E. Berthier, C. Vincent, P. Wagnon, and E. Trouvé, "Twenty-first century glacier slowdown driven by mass loss in High Mountain Asia", Nature Geoscience, vol. 12, pp. 22-27, 2018. http://dx.doi.org/10.1038/s41561-018-0271-9
https://www.summitpost.org/the-disappearing-glaciers-of-glacier-national-park/550744
Great article. The one extra thing I would like to understand is a better feel for the scale of the negative mass balance. E.g. What does -850mm/yr equate to in % of total ‘size’ of the glaciers in question (& is that even a good question) – size in quotes because I’m also not clear why a unit of length is used here. Anyone point me at a good reference or two?
Many thanks for this article and the distinct charts.
Thanks for all your dedicated work,Mauri
A hike to Collier Glacier overlook, in central Oregon, had been on my local bucket list for a long time. The old guide books described it as an opportunity to look down on Oregon’s largest Glacier. When I finally made it up there about 10 years ago…….too late! It still exists, but higher up and much smaller.
https://www.bendbulletin.com/article/20071022/NEWS0107/710220392/
*******
Also planning a backpack trip to a location still referred to as Anderson Glacier, in Olympic NP. Again, the namesake is gone:
https://en.m.wikipedia.org/wiki/Anderson_Glacier
Steve, #2–
This may help some:
https://en.wikipedia.org/wiki/Glacier_mass_balance
You know the deniers will fixate on the one that’s growing. From there it’s a small step to “glaciers are actually gaining mass!”
In order to convert a measurement in mm of water to a mass it is necessary to multiply it by some area. Is the appropriate area the accumulation area or the total area of the glacier?
Interesting that ice loss continued to accelerate during the decade of the alleged pause.
#8, Paul–
I’m still coming to grips with the methodology myself, but it appears to me from the article I linked in #6, above, that the area considered is that of the entire glacier, as the balance change is the net of ablation and accumulation, which largely occur in different parts of the glacier.
Eyeballing Figure 1 suggests that the rate of loss is exponential, rather than linear.
The Iceberg that broke off in the Antarctic broke off because we have switched from ice melting to ice making. That means I believe we began the new Ice Age 18,000 years ago. The oceans at the time of the peak were at least 400’ lower than present. That was about 72,000 years ago. The ocean water around the poles is always turned over.
The ocean at the edge of the ice berg, before it was an ice berg, was 400’ lower and it was the edge of the Continent, and the ice and snow were deep back to the center of the continent. The new snow, ice, began to grow, and the ocean began to rise. Because the ocean has turned over the upper level of the ocean is 32’F. Because the 39’F heavier water is a little bit lower, as the ocean rises it begins to melt the ice form the bottom and work its way inland. It has been doing this for the last 72,000 years. 18,000 years ago, the ice age ended and nature began making ice. The ice and snow have been growing on the top, as the bottom is still being eaten inward. The average iceberg is 80% underwater. Sometime in the last 18,000 years that which was over the land got over the water, got heavy enough and it broke off and floated way. At this point in the new ice growth it is about 250 meters thick (820 feet). At this point the lowering of the ocean began to slow down. That is where we are now. When the breaking off gets to the edge of the continent the dropping of the ocean will accelerate.
The Arctic ice at the north pole is doing the same. If you look at the Northwest passage, the shallowest is over land 400’ or less. The ice at the pole is an iceberg. As the ice and snow on top grows the iceberg gets heavier, and it sinks. The 39’F water works on the edge and the center gets thicker and the edge melts away, thus it looks like it is getting smaller but it is actually getting a lot thicker. The Antarctic ice core shows in the last 18,000 years, the beginning of the new ice age, the ice over land has risen 250 meters.
The term THE LAKE HAS TURNED OVER MEANS THE WATER AT THE SURFACE HAS REACHED 39’f. Water as it cools from 39’F to 32’F expands as the surface water cools further. Thus, the term the lake has turned over.
Among other incoherent and/or inane aspects, it’s worth pointing out that the fairly well-known stuff about maximum H2O density and lake turnover applies to pure water and fresh water.
It does not hold in the same way at all for seawater.
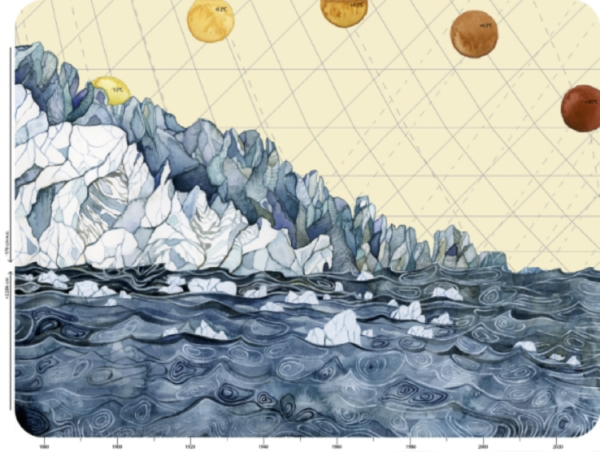
Thanks for the article. Particularly enjoy the artwork; in particular the second (“Time series …”) is sophisticated, beautiful, and informative.
That is true that as the salinity increases the freezing temperature increases. The density also increases. That means that as the fresh water which is no longer frozen tries to move away by convection absorbs salt and the rate of convection increases.
Does no 12 belong in the crank shaft? Inquiring minds want to know.
It does if you can explain the growth of 250 meters of new ice with a high CO2 content over the last 18,000 years other than the new ice age has begun.
RC 17, I think you’re mistaken if you’re saying the Greenland and Antarctic ice caps have only come into being over the last 18,000 years. If that’s not your point, what are you saying?
The Vostok Ice Core. The top 250 meters which was built over the last 18,000 years shows an increase of in CO2 with a very high level twords the top which could only show that man has arrived.
Re: ” as the salinity increases the freezing temperature increases.”
Wait, what ?
sidd
I really must applaud the diligence that it requires to take these measurements for such a long period time. It is articles and work like this that needs to make it to general public. Reading this research which indicated that alpine glaciers in virtually every place are receding, makes hearing individuals attempting to claim that ice sheets and glaciers have been growing all the more infuriating to hear. The arrogance that they make these claims is astounding when there are people dedicating years of time to measuring glacial retreat. Unfortunately, many people cannot understand the concept that yes glaciers melt, but then they refreeze, and if they do not refreeze to the same size, then they have retreated. However, certain articles/people will see that a glacier has refroze and claim this as they expanded. You must take into account the full picture over time, to see that these glaciers are in fact retreating. The data and research here clearly shows that alpine glaciers around the world are in fact retreating. Now I will have a very nicely written article to share with people, thank you!