Guest commentary by Cecilia Bitz, University of Washington
“Polar amplification” usually refers to greater climate change near the pole compared to the rest of the hemisphere or globe in response to a change in global climate forcing, such as the concentration of greenhouse gases (GHGs) or solar output (see e.g. Moritz et al 2002). Polar amplification is thought to result primarily from positive feedbacks from the retreat of ice and snow. There are a host of other lesser reasons that are associated with the atmospheric temperature profile at the poles, temperature dependence of global feedbacks, moisture transport, etc. Observations and models indicate that the equilibrium temperature change poleward of 70N or 70S can be a factor of two or more greater than the global average.
The Arctic Climate Impacts Assessment (ACIA) summarized the evidence for amplification in Arctic surface warming with the statement, “Over the past 100 years, it is possible [33-66% confidence] that there has been polar amplification, however, over the past 50 years it is probable [66-90% confidence]” (ACIA, 2005, p 22). This uncertainty in the evidence of polar amplification should not be confused with the evidence for significant warming in the Arctic. Arctic warming is both highly significant and substantial — it is just not possible to say with very high confidence yet that the Arctic has warmed more than the rest of the hemisphere or globe. The purpose of this posting is to explain why there is sometimes an absence of evidence for polar amplification.
Dramatic changes in ice at the poles are often cited as evidence of recent climate change — changes such as thinning and retreat of the sea ice, collapse of ice shelves along the Antarctic Peninsula and on the north coast of Greenland, melting permafrost, etc. Are these changes evidence of polar amplification? Not really. Because ice is mostly confined to the high latitudes, it is impossible to compare the magnitude of changes in ice across many latitudes. Therefore it seems a mistake to consider changes in ice as prima facie evidence of polar amplification. Instead, I would argue that changes in ice are a consequence of warming, though they may play a role in causing polar amplification. The term “polar amplification” should therefore be reserved to describe the amplification of surface temperature changes.
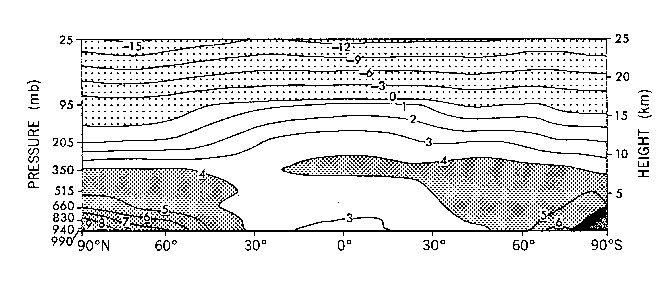
Fig 1. Latitude-height distribution of the zonal mean difference in annual mean temperature (K) in response to the quadrupling of CO2. [From Manabe and Stouffer (1980)] (click to enlarge)
Manabe and Stouffer (1980) first popularized the phrase “polar amplification” to describe the amplified rate of surface warming at the poles compared to the rest of the globe in their climate model’s response to increasing GHG levels. Their early climate model had a simple ocean component that only represented the mixed layer of the water. Their model had roughly symmetric poleward amplification in the two hemispheres, except over the Antarctic continent, where they argued the ice is too thick and cold to melt back (see Fig 1). Both poles warmed more at the surface than the midlatitudes or equatorial regions. Figure 1 also shows that polar amplification only occurs below about 300mb (ie, only in the troposphere). The vertical profile of warming in the lower atmosphere and cooling in the stratosphere from GHGs is well understood as a function of increased absorption and re-radiation.
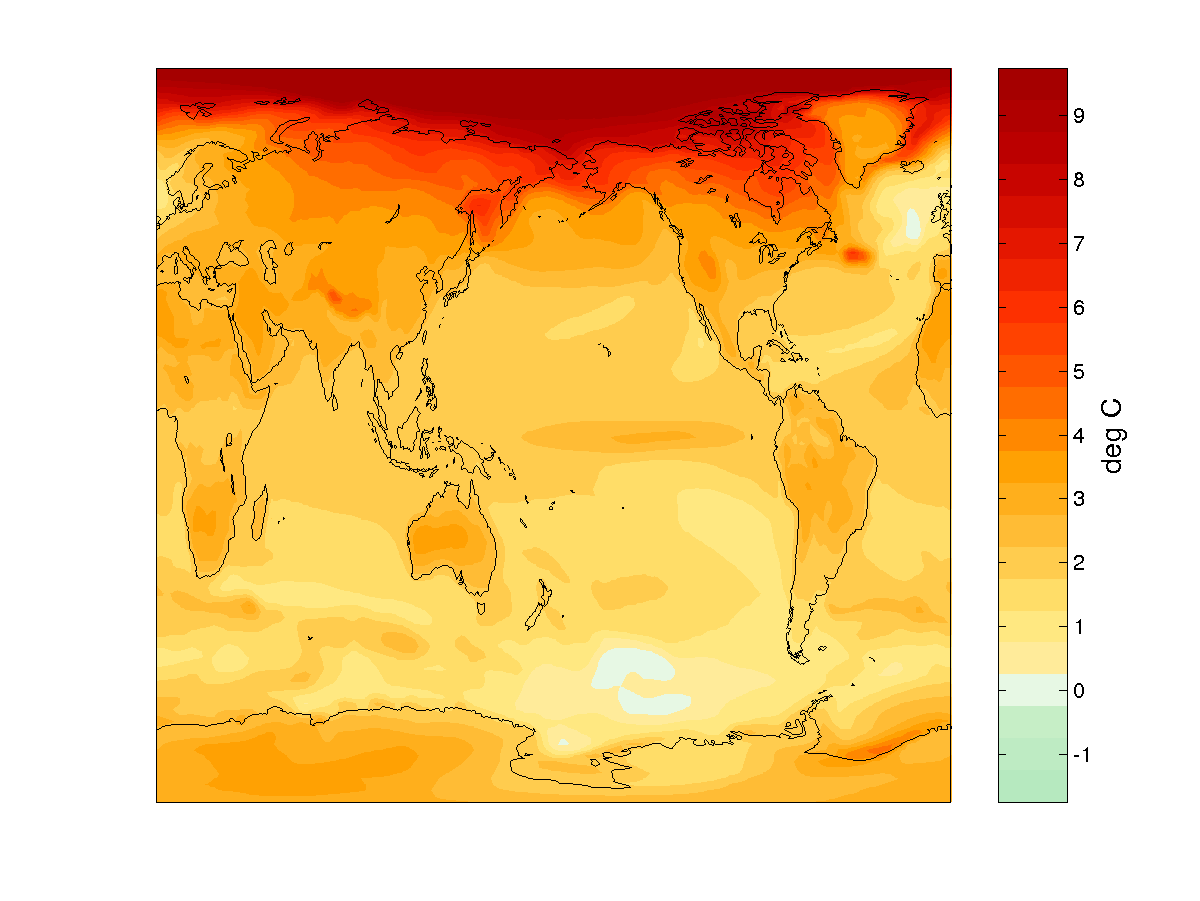
Fig 2. Linear surface warming trend in °C per century from NCAR CCSM3 averaged from 9 ensemble members using the SRES A1B scenario. (click to enlarge)
Observed polar climate change from the instrumental record is not symmetric. Except along the Antarctic Peninsula (Vaughan et al., 2003), most evidence of significant warming is from the Arctic. In addition, total sea ice extent in the Southern Ocean has had no significant trend since satellites began taking data in 1979 (Cavalieri et al 2003). Newer climate models generally also have very modest or no polar amplification over the Southern Ocean and Antarctica in hindcasts of the last century. The presence of a deep and circulating ocean component is key because ocean heat uptake increases most in the Southern Ocean as the climate warms (see Gregory 2000). The asymmetry at the poles does not however result from a difference in feedback strength associated with the ice or atmosphere. In fact, when these same climate models are run to equilibrium (in the same way that Manabe and Stouffer ran their model so that ocean heat uptake is not a factor) the hemispheres have nearly equal polar amplification.
Fig 3. Zonal mean surface temperature change at 2080-2099 relative to 1980-1999 for models archived at PCMDI for the IPCC AR4. The temperatures are normalized by the global mean to emphasize the relative polar amplification across models. (click to enlarge)
In addition to the asymmetry from ocean heat uptake, models have been used to attribute a considerable fraction of the warming on the Antarctic Peninsula and the lack of warming elsewhere on Antarctica to a decreasing trend in stratospheric ozone levels in the past few decades (Shindell and Schmidt, 2004). Due to the successful treaty to reduce ozone-depleting chlorofluorocarbons (CFCs) emissions, ozone levels in the stratosphere are expected to recover over Antarctica by about 2040, so eventually Antarctica begins to warm somewhat in climate model predictions of the 21st century (see Fig 2) (WMO, 2002).
It is well established that climate models exhibit Arctic amplification of future climate change (see Fig 3). In addition, averaging over numerous hindcasts from a single model started with differing initial conditions (known as an ensemble average) yields significant Arctic amplification in simulations of the last century. However, single realizations with a climate model do not universally show Arctic amplification in the past [Bitz and Goosse, in prep]. Thus models and observations alike show uncertainty in Arctic amplification in the last century. Nonetheless Arctic amplification in models (and most likely in nature too) is a robust result of forced climate change, provided the forcing is sufficiently large to overcome internal climate variability. Antarctic amplification only occurs if a model is run long enough so ocean heat uptake in the Southern Ocean does not damp the positive feedbacks and if trends in stratospheric ozone do not cause compensatory cooling. Predictions with climate models indicate that Arctic amplification will be significant (above the 95% confidence level) in one to two decades, while significant Antarctic polar amplification will take much longer. A lack of polar amplification over relatively short periods of time is therefore understandable and does not undermine the credibility of climate models or climate theory in any way.
References:
ACIA, 2005. Arctic Climate Impacts Assessment, Cambridge University Press, New York, U.S., 1042pp.
Cavalieri, D. J., C. L. Parkinson, and K.Y. Vinnikov, 30-Year satellite record reveals contrasting Arctic and Antarctic decadal sea ice variability. Geophys. Res. Lett., doi:10.1029/2003GL018031, 2003.
Gregory, J.M., Vertical heat transport in the ocean and their effect on time-dependent climate change, Clim. Dyn., 16, 501-515, 2000.
Holland, M.M., and C.M. Bitz, Polar amplification of climate change in the Coupled Model Intercomparison Project, Clim. Dyn., 21, 221–232,2003.
Manabe, S. and R.J. Stouffer, Sensitivity of a global climate model to an increase of CO2 concentration in the atmosphere, J. Geophys. Res., 85, 5529–5554, 1980.
Moritz R.E., C.M. Bitz, and E.J. Steig, Dynamics of recent climate change in the Arctic, Science, 297, 2002.
Shindell, D.T. and G.A. Schmidt, Southern Hemisphere climate response to ozone changes and greenhouse gas increases, Geophys. Res. Lett. doi:10.1029/2004GL020724, 2004.
Vaughan, D. G. et al. Recent rapid regional climate warming on the Antarctic Peninsula. Climatic Change, 60, 243-274 2003.
The text around the figures are mixed up with the rest of the text for me… on IE
[Response: Should be better now… – gavin]
From the guest commentary article above: [… The term “polar amplification” should therefore be reserved to describe the amplification of surface temperature changes.]
It is interesting to see this article. I’m updating my Excel spread sheet data plots which show annual air temperature at Alaska climate stations (1950-2005 for most stations). I began this effort in 2000-2001 for posts I made regarding articles in 2000 and 2001 by Willie Soon and Sally B. on climate change in Alaska. My posts were at ClimateChangeDebate (David Wojick group). I made a couple recent (Dec 2005) posts to RC on the thread called Naturally trendy regarding an article on temperatures in Alaska by the Alaska Research Climate Center. I’m not sure what to do with the spread sheet data plots I’m finishing up this week. I would like to share them if others at RC, but I would need advise in where and how to put them at a place that others might access.
With regard to the Antarctic, although I can understand the idea that the ozone hole strengthens the circumpolar westerly. I presume that the extra UV reaching the surface through the hole adds to the overall warming as it’s absorbed and reflected back. How significant a contribution is this?
Also as the Arctic warms and the thermohaline circulation drops off presumably there will be an increase in the flow of water into the southern Atlantic and hence to the Southern Ocean. If that’s the case then presumably this additional flow will inhibit the formation of El Nino’s and perhaps is already doing so, contrary to most expectations?
Lastly, an imbalance in global heating between south and north that’s exacerbated by the ozone hole (I’m not optimistic about this disappearing anytime soon – treaties notwithstanding – consider the impact of PFOA(perfluoro-octanoic acid which is AFAIK not in the treaty) does not seem to be conducive to stable circulation. Consider the unequal impact on the position and activity of the ITCZ(Intertropiocal Convergence Zone).
Just noting an apparent typo: in the sentence “Due to the successful treaty to reduce ozone-depleting chlorofluorocarbons (CFCs) emissions, ozone levels in the stratosphere are expected to peak in about 2040 and decline thereafter,…”, I presume that it should be “CFC levels”, not “ozone levels”, peaking in about 2040.
[Response: Thanks. I’ve adjusted the text to read “ozone levels in the stratosphere are expected to recover over Antarctica by about 2040”. Sorry for the confusion. – Cecilia]
I notice that the model output puts the greatest warming in the arctic ocean, probably related to the shrinking summer ice.
The greatest observed warming so far is occurring over Siberia in winter. When will summer warming overtake winter warming?
Average temperature has little meaning in the arctic, given the annual amplitude of 60 K. Are seasonal maps available?
The early GCM’s which showed amplified warming in the polar regions did so because the models used very crude ocean and sea-ice components. This was true thru the 1980’s, as the models exhibited too much sea-ice with the ice edge located much closer to the equator than actually happens. Since the ice was located where it would intercept more solar energy, this sea-ice was easily melted in the 2xCO2 experiments, producing greater input into the slab oceans used at the time. The effect of high zenith angle on the ocean’s albedo was also left out, thus the difference in albedo produced an amplification which was much greater than that seen in the real world.
The apparent cooling trend over the Antarctic is deduced from MSU data analyzed by UAH. There are severe problems with the UAH TLT over the Antarctic, as I pointed out in a GRL report in 2003. The impact of the relatively high surface elevation and sea-ice on the UAH TLT product may be producing a trend with stronger cooling than that which is actually happening. Furthermore, the influence of the lower tropopause (about 300 mb) over the Antarctic on the UAH TLT may also produce an additional cooling trend in the data. Carl Mears at RSS has produced a TLT product and pointedly leave out data poleward of 70S. My personal opinion is that I don’t trust the TLT data poleward of 60S. This question was not considered as part of the new Climate Change Science Program draft report on the MSU lapse rate issue, which I find most distressing.
A useful paper on what causes polar amplification in the models is Winton 2005. Amplified Arctic climate change: What does surface albedo feedback have to do with it? Geophys Res Lett. In press. In those models where it occurs (and in some it’s rather small), it’s not principally ice-albedo feedback. Rather, it’s due to non-surface short-wave feedback (i.e. clouds, as I understand it).
Recheck that ozone/CFC peak date, against late 2005 news please?
I recall NASA announced at the Dec. 2005 AGU meeting a delay in recovery. They put the recovery date off to maybe 2065, because CFCs keep showing up unexpectedly — either more leaks, or more production, than hoped.
There’s still a lot being produced, e.g.
http://www.japantimes.co.jp/cgi-bin/getarticle.pl5?nb20051021a3.htm
NASA on ozone, delays/doubts about recovery here:
http://www.nasa.gov/centers/goddard/news/topstory/2005/ozone_recovery.html
There is also at least another way of determining Polar amplification, which is by optical atmospheric refraction, measurable all over the world, by mainly using the sun as a baseline sphere.
Some above the horizon high Arctic sun disks were measured to have an average increase as much as 1% in vertical diameter in one year, this is a huge number, and may be due optical amplification not totally dissimilar to temperature.
Current GT anomaly maps, the latest NH monthly ones, are truly giving the impression that SAT amplification is a done deal,. it is kind of hard to understand why current GT anomaly maps are not good examples of amplification since they resemble the display above.
The refraction photos are a new approach? How much of, or how longterm a collection, do you need to get a statistical basis for those measurements’ confidence, and to compare them to other data? (Which statistical test do you plan to use, how many measurements will you need to collect, or over how long a period, to run it?)
Ozone hole recovery model runs here:
http://www.nasa.gov/centers/goddard/images/content/139176main_ozone_recover_figure2.jpg
Google for “always been an ozone hole” to see the baloney as served to the blind who don’t look up references (sigh). Mythinformation prevails throughout.
#11, Hank , it is a totally novel approach, based on data spanning back to 2000. a study of upwards of 14 tropospheres in one shot. I find statistical analyses not as good as theoretical applications from comprehensions. Breaking ground in this science is a whole lot of fun though, as I test my concepts by making projections paired with past NH GT’s. So far it works quite well. Confidence is partly taken from judging accuracy of my projections, although statistical information is equally interesting. . Namely 5 seasons of data collection suffices more or less to see a trend, but a particularly striking one between 2004 and 2005, When there was a marked increase in sun disk sizes of something like 80% of the levels (between 0 and 10 degrees elevation, there are up to 100 deci levels), Some expansions were truly epic, but that is not new, what was strange was a noticeable consistency found from one comparison to another. This reminded me of an amplified signal, a meaning above statistical variances, which eventually prompted to call 2005 the warmest ever for the NH in early April of 2005.
This is an informative post, helpful to those of us curious but lacking in the requisite knowledge about the polar amplification concept. I wonder if a little more might be said about Fig. 2, which, I assume, represents some of the most recent projections along with earlier ones (is this correct?). This figure suggests a rather extraordinary amount of warming of the Arctic oceans, but also a distinct “boundary zone” between moderate and extreme domains of warming (i.e. a steep “warming gradient,” so to speak). Has this been discussed in the relevant literature? Thanks very much for any relevant response.
Fresh off the credibility-boosting exercise of the UAH satellite data revisions of earlier this year (yes, that’s sarcasm), John Christy weighs in on Arctic warming: http://www.upi.com/NewsTrack/view.php?StoryID=20060105-114143-6931r . His thesis seems to be that so much of the warming is concentrated in the Arctic that the warming in the rest of the northern hemisphere must have some other explanation. He then trots out the good old natural cycle argument (for which he has no evidence whatsoever, at least as indicated in this story). Also interesting is that he seems to have gotten into the global temp business. If his temp figures are based on his satellite data, I wonder if he’s still including the bad data from 70oS to the South Pole.
Clarification: I meant surface temp business, but as far as I can tell from the MSU web site they still have nothing on surface temps. It’s not clear which temperature data set was being discussed in the article, nor does Christy appear to have really started promoting annual temp data in an active way (since I couldn’t find a press release or other indication of such an effort). So presumably the reporter initiated things, although if those were indeed just off-the-cuff comments from Christy I have a feeling he’ll end up being sorry about them. OTOH, maybe it’s just a matter of him believing there’s no longer a professional cost to letting his true views be known.
16 Steve, astounding article, as outrageous as it gets in this domain. A cycle as suggested by Christy, the only logical claim asserted, needs some evidence, anything, a story even a memory would help, but there is none to be found in the Arctic. The closest thing I can gather is the mythical open Arctic ocean as conjured up by some tale or theory which got a lot of 19th Century sailors in frozen trouble. The rest of the claims, shall I dare say, are childish in reasoning.
I don’t know much about the various (decadal) oscillations & how they do/don’t relate to GW or Arctic warming, but I just read off of ClimateArk (from LA Times) that the ocean temp off Santa Barbara is highest in 1,400 years, indicating it goes beyond the Pacific Decadal Oscillation, or that oscillation is acting weird, with shortening cycles.
See: http://www.climateark.org/articles/reader.asp?linkid=50379
Would shortening oscillations (perhaps also in the arctic) be related to GW? I was thinking 10-15 years ago, when people were blaming weird weather on el ninos, that GW might be impacting el ninos (making them appear more frequently and/or severely). Methinks skeptics & denialists are hiding behind “natural” oscillations & el ninos, etc, without considering how these themselves might be impacted by GW. I know it would be difficult to tease out the GW effect from the natural oscillation, but wouldn’t one expect in a GW world for GW to impact & amplify these?
John Christy has not “done the homework”. *
* See … How to be a real skeptic at:
https://www.realclimate.org/index.php?p=210
According to the NewsTrack link below, the director of UAH’s Earth System Science Center, Mr. John Christy said:
“It just doesn’t look like global warming is very global,” … “The carbon dioxide from fossil fuels is distributed pretty evenly around the globe and not concentrated in the Arctic, so it doesn’t look like we can blame greenhouse gases for the overwhelming bulk of the Northern Hemisphere warming over the past 27 years” he said. “The most likely suspect for that is a natural climate change or cycle that we didn’t expect or just don’t understand.”
http://www.upi.com/NewsTrack/view.php?StoryID=20060105-114143-6931r
Until Mr. Christy has “done the homework”, any media people or others who allow his statements to be heard or read by the public are behaving as irresponsible human beings.
John Christy is hereby given an assignment to complete before he does any more interviews. He is to write a thorough report on the presentation given by Hansen, J. 2005 (link below). His report will be graded (pass/fail) by knowledgeable and responsible scientists who have been participated in RC discussions during the last 12 months.
Presentation by Hansen, J. 2005. Is There Still Time to Avoid “Dangerous Anthropogenic
Interference” with Global Climate? A Tribute to Charles David Keeling (5.5 MB PDF).
Presented Dec. 6, 2005, at the American Geophysical Union, San Francisco. 50 p
http://www.giss.nasa.gov/~jhansen/keeling/keeling_talk_and_slides.pdf
Additional reading:
http://groups.yahoo.com/group/ClimateArchiveDiscussion/
RE #15 – Here’s another commentary with Christy’s comments. This appears to be the source of the UPI story.
http://www.livescience.com/environment/060106_2005_heat.html
It is rather strange that Christy appears to be unaware of the model results which project that the greatest warming will be seen at polar latitudes. Now that his TLT results have been changed to show warming in the tropical troposphere, one wonders why he is still downplaying the warming trend. One might think that he has an agenda.
#20, a key clue which shows some bias would be articles, like the one you linked, which claim 2005 as #2 warmest (true for some organizations) globally, but fail to mention that 2005 was #1 for the Northern Hemisphere, with 6 months having anomalies greater than +1 C (Nasa Giss). Another clue, is Christy’s baseline GT temperature period, 1979 to 1998, giving an impression that current temperature anomalies are weak. I would expect a great deal of opposition from what ever else like minded experts are conjuring up.
Christy has a point(ish). A portion of the polar warming is due to a shift in the Arctic Oscillation. Now this shift might be triggered in some way by global warming. Then again, it might be natural – the jury is currently out on that one. What’s clear is that trends in sea level pressure differentials (arctic-tropical) over the past century are not recreated by the models at all well (Gillett et al, 2005)
#22, If Arctic Oscillations have any effect on Arctic Ocean sea ice similar to what is going on right now, it would be hard to prove,. Case in point, the quest for the Northwest passage and Bowhead whaling, historically documented events backed by Inuit oral history. If AO’s repeat themselves a couple of times within 100 years , they didn’t clear the ice as much as with fall of 2005. The Norse couldn’t go further West then Devon Island ( about 800-1000) , from Martin Frobisher (1576-1578) , amongst many others following (Davis, Bylot etc). , would have had this passage named after them . Aso whalers ( late 1700t o 1910) would have easily made it down to Alaska from Baffin Bay, invited by an AO triggered occasion of wide open water, and so, some multiple attempts to crack open the Northwest Passage route should have been successful. The passage was said to be impossible, until Amudsen used a small ship, it took all his formidable skills to make it through between 1903-06. Right after this accomplishment Captaine Bernier (1906-1925) didn’t find the ice packs any easier Not until the advent of modern Ice breakers was this passage used on more or less an irregular basis. From documented history, late 16th century until recently, there was no period of an open sea route, or depleated ice conditions, which would justify AO cycles causing similar recent ice conditions, nothing in history is confirming this newly theorized strictly Polar warm up concoction.
The warming of the Arctic in the early 20th century was probably a result of the influx of warmer water into the Barents Sea, resulting from a short-lived change in wind patterns (although probably not AO/NAO) – Bengtsson et al (2004). So substantial Arctic warming can occur naturally. The pattern of modern warming is different, however, suggesting a different mechanism is afoot.
With my limited knowledge, I’m trying to think about various GW factors together. There is the fast(er) warming of the Arctic (for whatever reasons, AGW and/or natural oscillations), which would melt permafrost & send up CH4 & CO2, causing greater GW, not to mention the positive feedback of reducing albedo, and these perhaps eventually leading to the melting ocean clathrates & releasing even vaster amounts of CH4 & causing a lot more warming.
(I think there’s also the physics of ice melting — the melting process requires (absorbs) a lot of energy, but once ice is melted water warming happens very rapidly, along with air warming — since the refrigerator effect is no longer in play. OK, go ahead & laugh at my kitchen physics.)
I’ve also been reading news reports about the slowdown in the Atlantic ocean conveyor, which if greatly slowed or halted would make the Arctic colder, and would perhaps reduce this thawing, as apparently has happened in the past.
But could the rate of these processes have a bearing on the ultimate configuration – whether we trigger enough negative feedbacks (e.g., ocean conveyor halting) to stave off (limited) runaway GW, or whether the negative feedbacks don’t quite make it in time to thwart the positive feedbacks (e.g., thawing permafrost & clathrates), and we enter catastrophic (but limited) runaway GW? (For another instance, I think the rapidity of our GHG emissions seem possibly to be compromising nature’s ability to reaborbs these; plants like CO2, but if they’re dead due to heat or other GW-related factors, they can’t do much absorbing.)
In the past I think the warming & GHG release was slower, & once it triggered the ocean conveyor slowdown or halt, this greatly reduced natural GHG emissions. The natural GHG release & warming was slow enough for the ocean conveyor halt to gradual reverse the warming (except in the few cases of limited runaway warming & mass extinction).
But now we are emitting GHGs lickity split (in geological terms), and the warming (though it seems slow & sluggish on a human scale) is really quite fast, geologically speaking. And perhaps this speed will make the positive feedbacks superseded the negative ones, throwing us into limited runaway GW. And maybe we won’t get such a severe ice age in Europe & North America, even if the conveyor halts.
But even if it did get colder in the north, then people would be forced to burn more fossil fuels to stay warm. And, of course, here in the south, we’d be running our ACs full blast nearly year around.
So might the rapidity (as well as the dose) make the poison?
There you have it, how science gets translated into the mind of a semi-well informed layperson with an active imagination!
What I missed in this discussion until now, is the role of the increase in solar strength (another natural cause) of the last century in the increase of the Arctic temperatures. There is a comprehensive summary of the influence of the solar cycle (and ozone depletion) on global/polar climate by Baldwin and Dunkerton. The role of the longer term solar strength increase is not mentioned, but may be deduced from the results of the change from minimum to maximum within one cycle.
Further, what wonders me is the difference in trends in the Arctic seasons: warming in spring to autumn, but cooling in winter, strong enough to refreeze near all ice that was melted in the other seasons. The role of clouds (and their influence on the heat balance) in this is enormous (and not captured by any model)…
In mid-high latitude (lat) regions, cold seasons have become warmer and more humid and with shorter durations, than years ago, while warm seasons have become warmer and more humid and with longer durations than years ago.
Very cold and dry air masses in mid-high lat regions are less frequent now than years ago. Annual humidity in mid-high lat regions has increased compared to years ago, as shown in my studies on increasing annual average dewpoints in the Upper Midwest and other mid-high lat regions.
Increased humidity, cloud cover and greenhouse effect in mid-high lat regions are allowing the regions to warm more rapidly than in low lat regions. Shorter duration snow cover, shown in my studies on earlier season snowmelt runoff for rivers in the Upper Midwest, indicates a shorter duration of albedo-cooling effect than took place years ago.
Increases in humidity and cloud cover, and the greenhouse effect, particularly in mid-high lat regions in winter with longer nights and short days. Overnight loss of heat has been greatly reduced in mid-high lat regions in winter and other seasons as well.
Growing season duration has increased in the mid-high lat regions compared to what it was years ago, which has allowed increases in yearly evaporation and puts higher amounts of water into the air… leading to increases in humidity in the lower atmosphere. The higher amount of moisture in the lower atmosphere, particularly in mid-high lat regions is warming soils to great depths, as studies have shown. Cold loving native plants have been inhibited while warm loving invasive plant species are taking over undisturbed or lightly disturbed sections in mid-high lat regions at alarming rates, studies have shown.
Large increases in annual humidity and more frequent extended cloudy periods during the longer winter nights are most significant in the mid-high lat regions, compared to low lat regions. Mid-high lat regions will continue to experience higher rates of annual warming than low lat regions, mainly a result of large accumulations of of greenhouse gases in the atmospheric, a result of fossil fuel emissions and global warming feedbacks.
RE 26 & 27, I’m also thinking of the longer summer days & longer winter nights in the high latitudes. I read somewhere, I think in relation to the 2003 European heat deaths, that the nights do not cool down as much as they used to. I’m thinking there is not only a greenhouse effect during the day, but a GHG blanket-effect at night (& during the day), which would apply to the very long winter nights in the Arctic & keep us toastier than we would be without our additional GHG emissions, even in periods without much sunshine.
Of course, if the sun should become brighter, that would only amplify the warming all the more. Since we can’t control the sun, then we should be even more earnest in doing what we can do in reducing our GHGs. The more nature starts making things warmer, the more we will have to reduce. Luckily the scientists haven’t found any increased solar brightness at this point (and I believe them), but we should keep vigilant, ready to super-reduce if such should start happening.
Re: No. 26, 27, 28 – Someone (the U.S. Senate?) needs to investigate the National Weather Service. They are letting us all down. The National Weather Service should be using it’s staff of more than 100 offices 1-2 in nearly every state with ties to local and state gov and media, to help educate the public on climate change. Instead, they ignore the whole concept of global warming by saying the problem is minor or by saying it’s too controversial or uncertain or outside their area to say anything about it publicly. It the meantime, the situation gets worse while the public is kept in the dark.
My concern for a long time has been that the National Weather Service is doing a disservice to all of us by not doing what it is required by Congress to do – predict the weather, including flooding forcasts which threatens life and limb, based on the latest scientific knowledge, which includes knowledge of global warming. I have written my U.S. Senators about this in the past but didn’t have the studies to back up my concerns. Now I do.
Because of the increased temperatures and humidity, global warming increases the amount of water that major storms produce and discharge over land, thus increasing the potential severity of flash floods in places where it does rain (or snow). This was the finding of the study which is summarized below.
Therefore, the U.S. National Weather Service is remiss in avoiding
the reality of global warming in its flood prediction and public
warming notification programs.
The National Weather Service ought be investigated for being
negligent in its duties of accurately forecasting floods as they
are ignoring the whole subject of global warming which, according to the NCAR study, underestimates the severity of flooding and the threat to human lives and property (because more water is discharged).
——————————————-
Fri Oct 14 13:36:00 PDT 2005
“Warmer Seas, Wetter Air Make Harder Rains as Greenhouse Gases Build”
October 13, 2005
BOULDERâ??Storms will dump heavier rain and snow around the world as
Earth’s climate warms over the coming century, according to several
leading computer models. Now a study by scientists at the National
Center for Atmospheric Research (NCAR) explains how and where warmer
oceans and atmosphere will produce more intense precipitation. The
findings recently appeared in Geophysical Research Letters, a
publication of the American Geophysical Union.
The greatest increases will occur over land in the tropics, according
to the study. Heavier rain or snow will also fall in northwestern and
northeastern North America, northern Europe, northern Asia, the east
coast of Asia, southwestern Australia, and parts of south-central
South America during the 21st century.
“The models show most areas around the world will experience more
intense precipitation for a given storm during this century,” says
lead author Gerald Meehl. “Information on which areas will be most
affected could help communities to better manage water resources and
anticipate possible flooding.”
NCAR authors Meehl, Julie Arblaster, and Claudia Tebaldi analyzed the
results of nine atmosphere-ocean global climate models to explain the
physical mechanisms involved as intensity increased. Precipitation
intensity refers to the amount of rain or snow that falls on a single
stormy day.
Both the oceans and the atmosphere are warming as greenhouse gases
build in the atmosphere. Warmer sea surfaces boost evaporation, while
warmer air holds more moisture. As this soggy air moves from the
oceans to the land, it dumps extra rain per storm.
Though water vapor increases the most in the tropics, it also plays a
role in the midlatitudes, according to the study. Combined with
changes in sea-level pressure and winds, the extra moisture produces
heavier rain or snow in areas where moist air converges.
In the Mediterranean and the U.S. Southwest, even though intensity
increases, average precipitation decreases. The authors attribute the
decrease to longer periods of dry days between wet ones. The heavier
rain and snow will most likely fall in late autumn, winter, and early
spring, while warmer months may still bring a greater risk of drought.
http://www.ucar.edu/news/releases/2005/hardrain.shtml
My comment 2. in another thread says:
… I’m updating my Excel spread sheet data plots which show annual air temperature at Alaska climate stations (1950-2005 for most stations).
I’m more than half way done with the work now. I created two albums for Excel generated plots of annual temperature data (1950-2005) for groups of inland and near coast stations. The plots are available for public access for 7 inland stations now. Anyone can access the plots by going to:
http://login.yahoo.com/config/login?.src=ph&.done=http%3a//photos.yahoo.com/ph//my_photos&.intl=us
If you don’t have a member yahoo ID and password, it’s pretty easy to subscribe (for free).
Please let me know if you can get to them and what you think.
re 30.
I meant to post the text in 30. to the Naturally trendy thread, but since it’s already here at Polar Amplification I’ll keep it here only.
There is an easier way to access and view the Alaska temperature plots (inland and coast stations) … by going to and joining at:
http://groups.yahoo.com/group/ClimateArchiveDiscussion/
ClimateArchiveDiscussion(CAD) yahoogroup Photos now contains annual temperature plots for 13 stations in Alaska (7 more for coast group expected this evening or tomorrow am).
The 13 stations in CAD now include:
Inland area
———-
Northway
Talkeetna
Big Delta
Bettles
Fairbanks
Gulkana
McGrath
Coast area
———–
Homer
Anchorage
Annette
Barrow
Bethal
Cold Bay
http://groups.yahoo.com/group/ClimateArchiveDiscussion/
[NOTE: ALL MY TEMPS ARE IN FAHRENHEIT.] I don’t see how anyone can say that there is no evidence that establishes that the Arctic (and northern areas not as far north as the Arctic Circle) are warming faster than the rest of the globe. Yes they are. That is an absolute fact, not a claim.
I lived in Alaska for 17 years and, unlike many people who lived there, I ACTUALLY PAID ATTENTION. Juneau Alaska was founded in 1880, so we have 125 years of weather records. It was a much colder and snowier place until the 1970s. In 1986 the high was 92 degrees, never did it ever break 86 before. In the 1920s people sometimes had to walk through snow tunnels downtown taller than 7 feet. This never happens now. Snow 2 to 3 feet deep is a big deal now. Sometimes in mid-Winter in Juneau it now gets to 55 degrees. This never happened until the 1970s.
Almost all Alaskan glaciers are melting – more than 90% of them. The ice over the Arctic Ocean is smaller (in sq miles) every year, and thinner. I’ve stood on that ice at Prudhoe Bay — trust me, its changed dramatically. Many villages in Alaska are 8 or 9 degrees warmer than fifty years ago. Not the 1 to 2 degrees that climate scientists say the Earth as a whole has warmed in 100 years. ( I believe the Earth as a whole has warmed more than this, but that is less clear cut.) Tens of thousands of square miles of permafrost lands in interior Alaska are now melting, and are impenetrable bogs now.
There are HUNDREDS of pieces of evidence from all over Alaska which show a dramatic warming since the 1950s. The U.S. non-Alaskan media rarely report any of them. You will be shocked when you do some research and find out I am right.
Here’s an article stating that Northern Alaska and Central Alaska are now warmer than in the last 1,000 years. And that this region of Alaska warmed 1.0 degree Centigrade/ 1.8 degrees Fahrenheit PER DECADE between the mid-1970s and the mid-1990s.
The URL didn’t post . Here it is:
http://www.usgcrp.gov/usgcrp/seminars/971202DD.html
It is good to have this article on Polar amplification, very fortunate, especially when, by coincidence a newish theory (#15-16) clearly pushes it aside and almost claims amplification must not exist. Adding to #23, an important detail, would much like to read comments from evolution biologists, about their views on Bowhead whales, which are very regional, the Eastern Arctic Bowhead, does not migrate to Alaska, kept a peculiar counterclockwise migrating track around Baffin Island for millenia, Sir John Ross found a complete skeleton NE Baffin about 150 meters above sea level. Could it be that the Bowhead, nearly hunted to extinction by Eastern Arctic whalers (who never sailed to Alaska), have something to add to this debate? It is more like a final confirmation, there was no time like our days unless you go back, way back when the Pacific Bowhead was the same as the Atlantic one.
#26 Ferdinand , not so for clouds, go to any Arctic IR satellite picture , now is good , but better in a few weeks, and you will find that clouds are scarcer than at warmer latitudes, at certain times of the Arctic year, cloudless models should be quite accurate. In the context of the solar cycle, it may be easier to look back not so far in the past, 2004 with more sun spot activity was cooler than 2005, this in itself shows something else than solar activity at play.
Re #36: Waine, the suncycle-cloud connection is rather general. Measured by satellites, there is some 2% global (low) cloud cover change over a sun cycle (see Kristjansson ea. Fig. 1). This is measurable as a global temperature cycle of some 0.1 K (~ in phase for the 11 year cycle, with an average 2.2 years lag, for the 22 year cycle, see Scafetta and West) superposed over a longer term warming trend. The change in cloud cover and temperature is even more visible in the tropics, where the sea surface temperature can increase several tenths K in a few years towards a solar maximum.
The sun cycle is only vaguely visible in Arctic cloud cover changes, probably together with ENSO cycles (which have a lower frequency). Of more importance is the long-term solar trend: solar activity now is higher than in the past 8,000 years. There is measured evidence that changes in solar strength are coupled with climate for the short (11-22 yr) solar cycles and there is empirical evidence that longer term solar changes have their influence on longer term climate (LIA-current).
In addition, the Science article by Wang and Key points to the influence of the AO (Arctic Oscillation) for the advection of warmer air into the Arctic and a probable influence on cloud cover. The increase in solar strength may have an influence on this too, as changes in tropical stratospheric temperature are forwarded towards the poles and have an influence on the AO…
About the trends that current models project for the future Arctic warming: Even those submitted for the now pending AR4 have the wrong sign for cloud cover changes in the Arctic. From Winton, NOAA, page 3:
For cloud cover, this simply is the opposite of what is seen in reality. The increase of clouds in summer and the decrease of clouds in winter both reduce the warming, thus effectively counteract the amplification of the Arctic vs. the rest of the globe…
See further the graphs of the Science article at the UKww discussion list…
Re #34/35:
Robert, one need to be careful with articles which only give linear trends, as linear trends in cyclic events are highly vulnerable to start and endpoint choice. In the case of Alaska, there is a sudden rise in 1976, due to a change in PDO, but after that there is no trend at all (or even a slight cooling) for Anchorage, Fairbanks and Nome. Only Barrow, at the Arctic Ocean (probably more influenced by ice melting), shows a positive trend of some 2 degr.C in the period 1977-2005, be it that this is from -12.4 to -10.4.
Tom Rees has made a comparison of Alaskan temperatures with the PDO, where you can see that most of the temperature trend is related to the PDO, with a residual increase of 0.28 K/decade, which still is some 50% larger than of the global GISS trend. I suppose that most of the residual increase here too is due to the Barrow trend…
I’ve been sidetracked from completing my annual temperature plots at Alaska COOP stations. I took time instead to create a ten year moving average figure showing annual temperatures from 1820 through 2005 at Minneapolis. To my knowledge, there are no other stations in the U.S. that have a temperature record that goes back that far (1819). The figure can be viewed at:
http://madison.indymedia.org/newswire/display/28356/index.php
After using the ten year moving average, I’m planning to convert my figures for the annual temperatures at Alaska stations. Most of the stations in Alaska have 1950-2005 data, except Homer and Anchorage go back to the 1930s). The plots which I posted yesterday have five year trend lines, at:
http://ph.groups.yahoo.com/group/ClimateArchiveDiscussion/photos
In an early post (#6) it was mentioned that the data indicating a cooling trend in Antarctica has seriously problems. Are there external sources (preferably on the web) which go into this in more detail?
Thanks in advance.
I remember an RC contribution of Markus Rex from PKI/Potsdam in Dec04/Jan05 predicting an extreme decrease in Arctic ozone cover due to more numerous PSC’s, and as a consequence a falling total ozone column. So this would rather play against a warming, if I understand correctly (or do increasing clouds and falling O3 levels cancel out?) . Have Markus’s predictions been fullfilled? Can we estimate the cooling ( or better the not realized warming) caused by this thinning, if it happened. Have ground UVB levels reached exceptional high values in the Arctic this spring?
Most of Antarctic is warming, so there are no legitimate reports on cooling trends there. Articles below indicate Antarctica and ocean waters near Antarctic have been warming more rapidly than anticipated earlier.
Excerpts … The ocean west of the Antarctic Peninsula has warmed by more than a degree since the 1960s – contradicting the results of computer models. … Geophysical Research Letters, Michael Meredith and John King of the British Antarctic Survey write: “Marine species in this region have extreme sensitivities to their environment.” … A study published last year showed krill numbers had fallen by 80% since the 1970s and experts linked the collapse to shrinking sea ice (the crustacean feeds on algae under the ice). … Professor Lloyd Peck, a polar expert also at Bas, commented: “It is the first paper to show a temperature change in the Southern Ocean that could have ecological significance and possibly global importance.” … “Air temperatures on the Antarctic Peninsula have gone up by three degrees in the last 50 years or so and none of the computer models show that either,” Professor Peck told the BBC News website.
… 19 October 2005 Antarctic species feel the warmth
http://news.bbc.co.uk/1/hi/sci/tech/4356422.stm
Also see:
Antarctic glaciers calving faster into the ocean
18 October 2005 NewScientist.com news service
Fred Pearce http://www.newscientist.com/article.ns?id=dn8173
(I recognize I am going off topic here to engage a comment)
#29:
Michael, a call to investigate the NWS could end up crippling it. It has been downsized numerous times already.
I should mention that the local offices of the NWS are only pieces of NOAA. Are you talking about NOAA?…because you said National Weather Service, and they are different. NOAA also includes a many many “national centers,” some of which engage in short-term and longer-term climate projections. I suspect your beef is really with the National Center for Environmental Prediction (NCEP), or more specifically the Climate Prediction Center (CPC).
The local offices of the weather service mostly make daily and multi-day forecasts. They are also responsible for issuing Watches, Warnings and Advisories, with the exception of severe weather watches, which are issued by the Storm Prediction Center. I can’t imagine how working GW wording into their forecasts would go, especially because it is nearly impossible to demonstrate the effect of GW on an *event level.* Maybe something like this:
“Partly cloudy with a 30% chance of thunderstorms, the precipitation from which may have been enhanced by global warming. High of 84 (83 without global warming). Winds out of the south at 10- 15 mph, indicating a persistent, global warming-induced poleward transport of sensible heat.”
I agree that NOAA should have a better outreach program for public information. But unless we are going to start populating NWS offices with outreach climatologists (rather than operational meteorologists), I think we should leave the local weather forecast offices alone.
I should also point out that NOAA has always done a poor job of reaching out to the public. Just look at NOAA weather radio (which transmits local weather forecasts; you have to have a special receiver (shortwave or something in the 162.55 mHz range) to hear its transmissions. Most folks have to shell out extra money just to get this “publicly-available” information.
So I guess all this was to say, I think the problem you identified was with NOAA.
Thank you for your response. My understanding is also that the Peninsula has been cooling, but that it only makes up about 10% of the total area of Antarctica. Per comment #6, it sounds as though current data shows that on average, the Antarctic climate is cooling. The studies I have seen referenced on this point make the same claim.
http://www.sciam.com/article.cfm?articleID=000671C5-3A33-1CDF-B4A8809EC588EEDF&sc=I100322
http://www.nature.com/cgi-taf/DynaPage.taf?file=/nature/journal/v415/n6871/abs/nature710_fs.html
http://www.gsfc.nasa.gov/topstory/20020820southseaice.html
I am interested in finding and reading the sources that show that this data is incorrect.
I think I’ve read the articles sited 44, 3-4 years ago. The data used in the articles to claim a cooling trend anywhere in Antarctic was outdated even then. It is badly misleading to make general statements about a cooling trend or absence of warming using outdated regional climate warming data without clearly showing the dates associated with the data and reports.
Samples:
According to a new study, air temperature on the southernmost continent fell by 0.7 degree Celsius per decade between 1986 and 2000
http://www.sciam.com/article.cfm?articleID=000671C5-3A33-1CDF-B4A8809EC588EEDF&sc=I100322
… net cooling on the Antarctic continent between 1966 and 2000,
The McMurdo Dry Valleys have cooled by 0.7 °C per decade between 1986 and 2000,
http://www.nature.com/cgi-taf/DynaPage.taf?file=/nature/journal/v415/n6871/abs/nature710_fs.html
21 years (1979-1999) of Antarctic sea ice satellite records and discovered that, on average, the area where southern sea ice seasons have lengthened
http://www.gsfc.nasa.gov/topstory/20020820southseaice.html
Sorry, I should have included the dates – because they were available in the articles and I provided the links, I assumed I didn’t need to include them, though this was a mistake.
Is the 2000 data really outdated? In the initial post, a paper with 2003 data about the Artic is sited as a source, as is data from papers from 1997 (Minobe 1997) and 2002 (Beltaos 2002). Without going into details (though I am happy to, if needed) much of the studies re: climate use data that only goes up to 2000 or so.
Of course, if there is a newer study on Antarctica average temperatures, then the data I site would be outdated. Is there such a study, and if so, would you provide the name / source so that I may read it?
I would also be happy to receive a source for the claim made in #6, if someone would provide it.
Thanks.
RE #40 and 44:
The temperature trends deduced from the MSU instruments on satellites shows a cooling trend at high southern latitudes. This data is not the same as surface temperature, as the MSU channel 2 measures a weighted sum of microwave emissions in a narrow frequency band, which it is claimed, represents “temperature”. However, there is still some questions regarding the validity of this data and there have now been several approaches used to analyze this information.
The two most often referenced results are those from Spencer and Christy at UAH and Mears and Wentz at RSS. Both have now produced a so-called “lower troposphere” analysis. Mears has a presentation available which includes a plot of the trends of these two products vs. latitude from computed zonal averages. In Figure 4, both approaches show cooling at high latitudes in the SH. Here’s the URL link:
http://ams.confex.com/ams/Annual2006/techprogram/paper_104116.htm
This is a follow on to the paper Mears and Wentz published in SCIENCE last year. Notice that Mears and Wentz have chosen to exclude the data poleward of 70S, which includes almost all the Antarctic. Christy and Spencer still include the highest SH latitudes, AIUI. There is a known problem of surface influence due to high mountains, such as those of the Antarctic. There may also be another problem due to the large annual cycle in sea-ice extent, as I suggested in a GRL report in 2003. Take a look back at the earlier RealClimate comments regarding the continuing MSU controversy, especially the new CCSP report on some of the issues.
https://www.realclimate.org/index.php?p=170
https://www.realclimate.org/index.php?p=217
Thank you – looks like some good bed time reading! :-)
Eric, thanks for the link to the new paper. Could you point to where it says that S+C continue to include latitudes south of 70S? Figure 4 seems to show them all stopping there.
re Justin Rietz in 46. Is the 2000 data really outdated?
I think 2000 is out dated, especially as the endpoint in a range of years, suggesting to the RC viewer that it may pertain to recent years.
Trends for these ranges in years (below) have nothing to do with what’s happening now.
As in this excerpt:
“Although previous reports suggest slight recent continental warming, our spatial analysis of Antarctic meteorological data demonstrates a net cooling on the Antarctic continent between 1966 and 2000”,
Antarctic climate cooling and terrestrial ecosystem response
PETER T. DORAN*, JOHN C. PRISCUâ? , W. BERRY LYONSâ?¡, JOHN E. WALSH§, ANDREW G. FOUNTAIN, DIANE M. MCKNIGHT¶, DARYL L. MOORHEAD#, ROSS A. VIRGINIA, DIANA H. WALL**, GARY D. CLOWâ? â? , CHRISTIAN H. FRITSENâ?¡â?¡, CHRISTOPHER P. MCKAY§§ & ANDREW N. PARSONS**
* Department of Earth and Environmental Sciences, University of Illinois at Chicago, 845 West Taylor Street, Chicago, Illinois 60607, USA
â? Land Resources and Environmental Sciences, 334 Leon Johnson Hall, Montana State University, Bozeman, Montana 59717, USA
â?¡ Byrd Polar Research Center, Ohio State University, 1090 Carmack Road, Scott Hall, Columbus, Ohio 43210, USA
§ Department of Atmospheric Sciences, University of Illinois, 105 South Gregory Street, Urbana, Illinois 61801, USA
Department of Geology, Portland State University, Portland, Oregon 97207, USA
¶ Institute of Arctic and Alpine Research, 1560 30th Street, Campus Box 450, Boulder, Colorado 80309, USA
# Department of Earth, Ecological and Environmental Sciences, 2801 W. Bancroft Street, University of Toledo, Toledo, Ohio 43606, USA
Environmental Studies Program, Dartmouth College, 6182 Steele Hall, Hanover, New Hampshire 03755, USA
** Natural Resource Ecology Laboratory, Colorado State University, Fort Collins, Colorado 80523, USA
â? â? USGSâ??Climate Program, Box 25046, MS 980, Denver Federal Center, Denver, Colorado 80225, USA
â?¡â?¡ Division of Earth and Ecosystem Sciences, Desert Research Institute, 2215 Raggio Parkway, Reno, Nevada 89512, USA
§§ Space Science Division, NASA Ames Research Center, Moffet Field, California 94035, USA
Correspondence and requests for materials should be addressed to P.T.D. (e-mail: pdoran@uic.edu).
http://www.nature.com/cgi-taf/DynaPage.taf?file=/nature/journal/v415/n6871/abs/nature710_fs.html