Over multiple generations of CMIP models Arctic sea ice trend predictions have gone from much too stable to about right. Why?
The diagnostics highlighted in our model-observations comparison page are currently all temperature based, and show overall that climate models have being doing well on these trends for decades. But there has been increasing attention to trends in non-temperature variables, and there, model performance is more mixed (Simpson et al., 2025). As we’ve discussed before, model-observation discrepancies can arise from three causes: the observations could be wrong (unrealized biases etc.), the models are wrong (which can encompass errors in forcings as well as physics), or the comparison could be inappropriate.
One of the most high profile ‘misses’ in coupled modeling over the last few decades was the failure of the model projections in CMIP3 (circa 2003/4 vintage) to match the rapid losses in Arctic sea ice that started to become apparent in the middle of that decade (Stroeve et al., 2007), and were compounded by the summertime record losses of sea ice in 2007 and then 2012. With an additional decade, how does that look now?
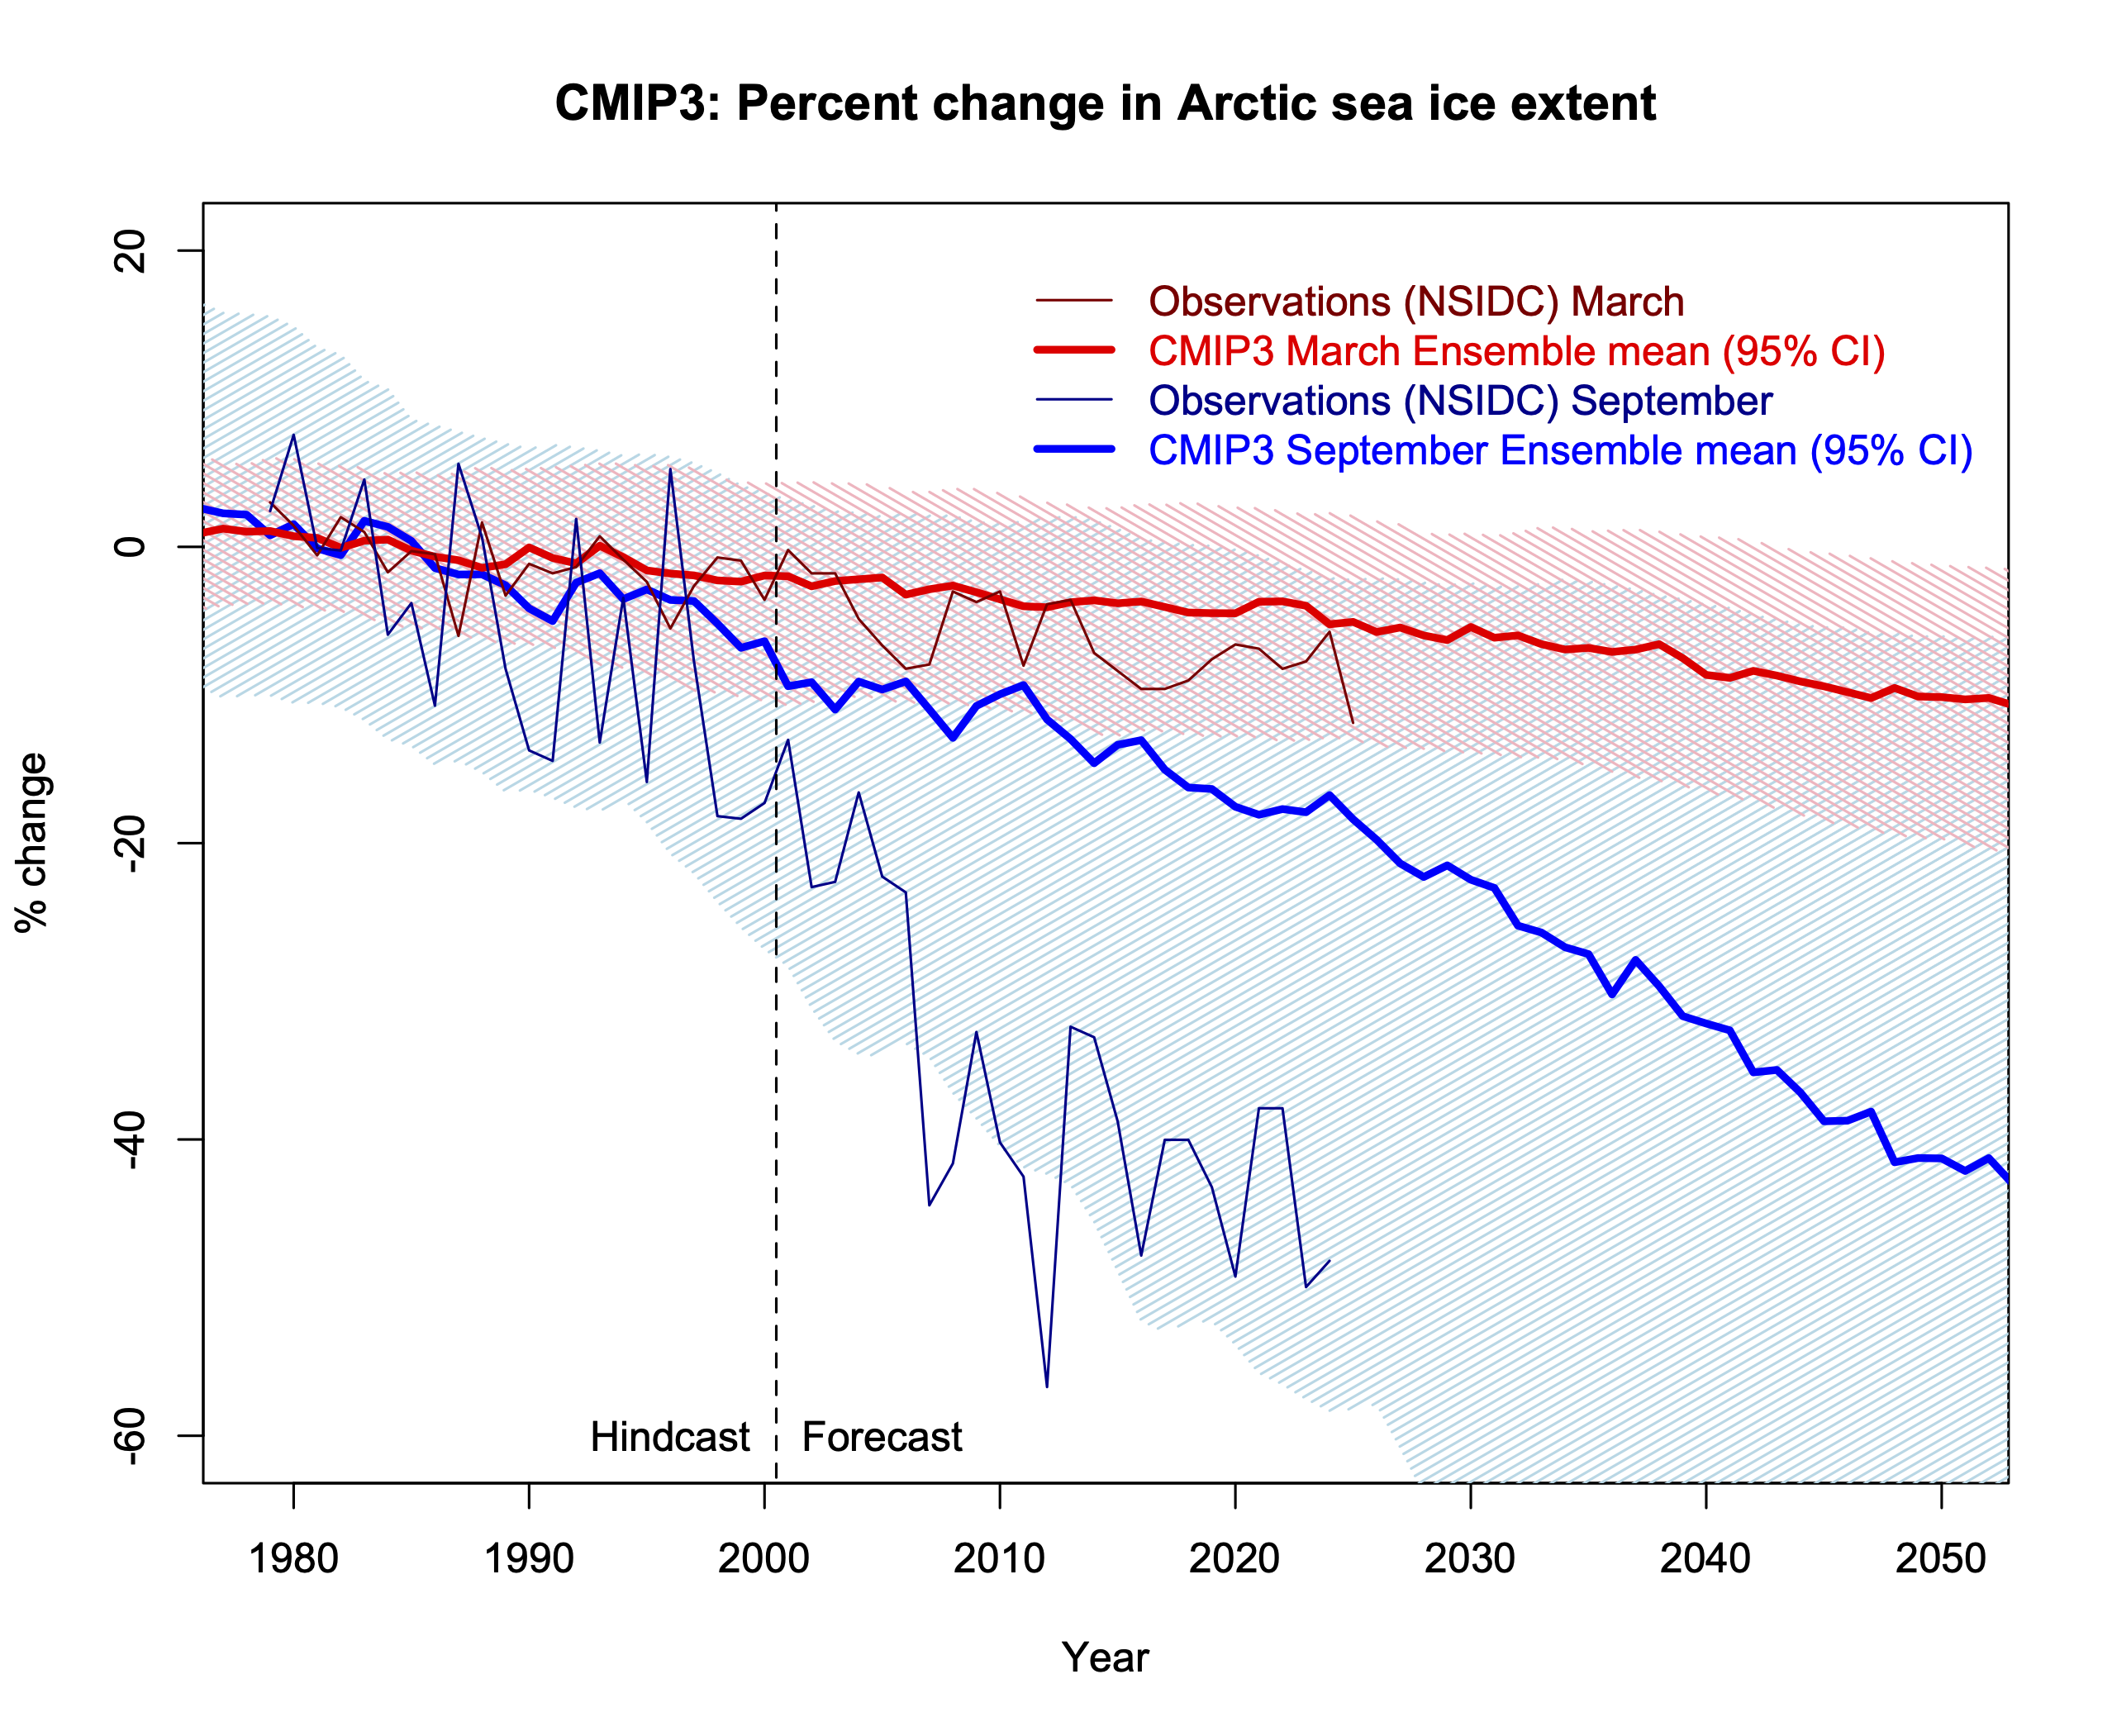
In a word, the CMIP3 Arctic sea ice projections were, and remain, terrible. The ensemble mean predicted rate of change of September Arctic sea ice extent is less than half that observed (-4.5 %/decade vs. -11 %/decade for 1979-2024), and there are only five single individual model simulations (out of 46) that have a loss rate greater than 10 %/decade (95% spread is [-12,-0.7] %/decade). The March trends are also under-predicted, but by a lesser degree. There is no real ambiguity in the observed trends, nor in the comparison (though extent is a little trickier than area to compare to), and so these discrepancies were very likely due to model failures – insufficient resolution to capture the polar sea ice dynamics, too simple sea ice physics, biases in the Arctic ocean simulations etc. Analyses have shown that errors in the absolute amount of sea ice were correlated to the errors in the trends as well.
Development of the CMIP5 models was ongoing as these discrepancies were manifesting, and there were improvements in sea ice physics and dynamics, increased resolution and a reduction in the overall climate biases. The simulations in CMIP5 were conducted around 2011-2013, and used historical forcings from to 2005, and scenarios subsequently. Did that make any difference?
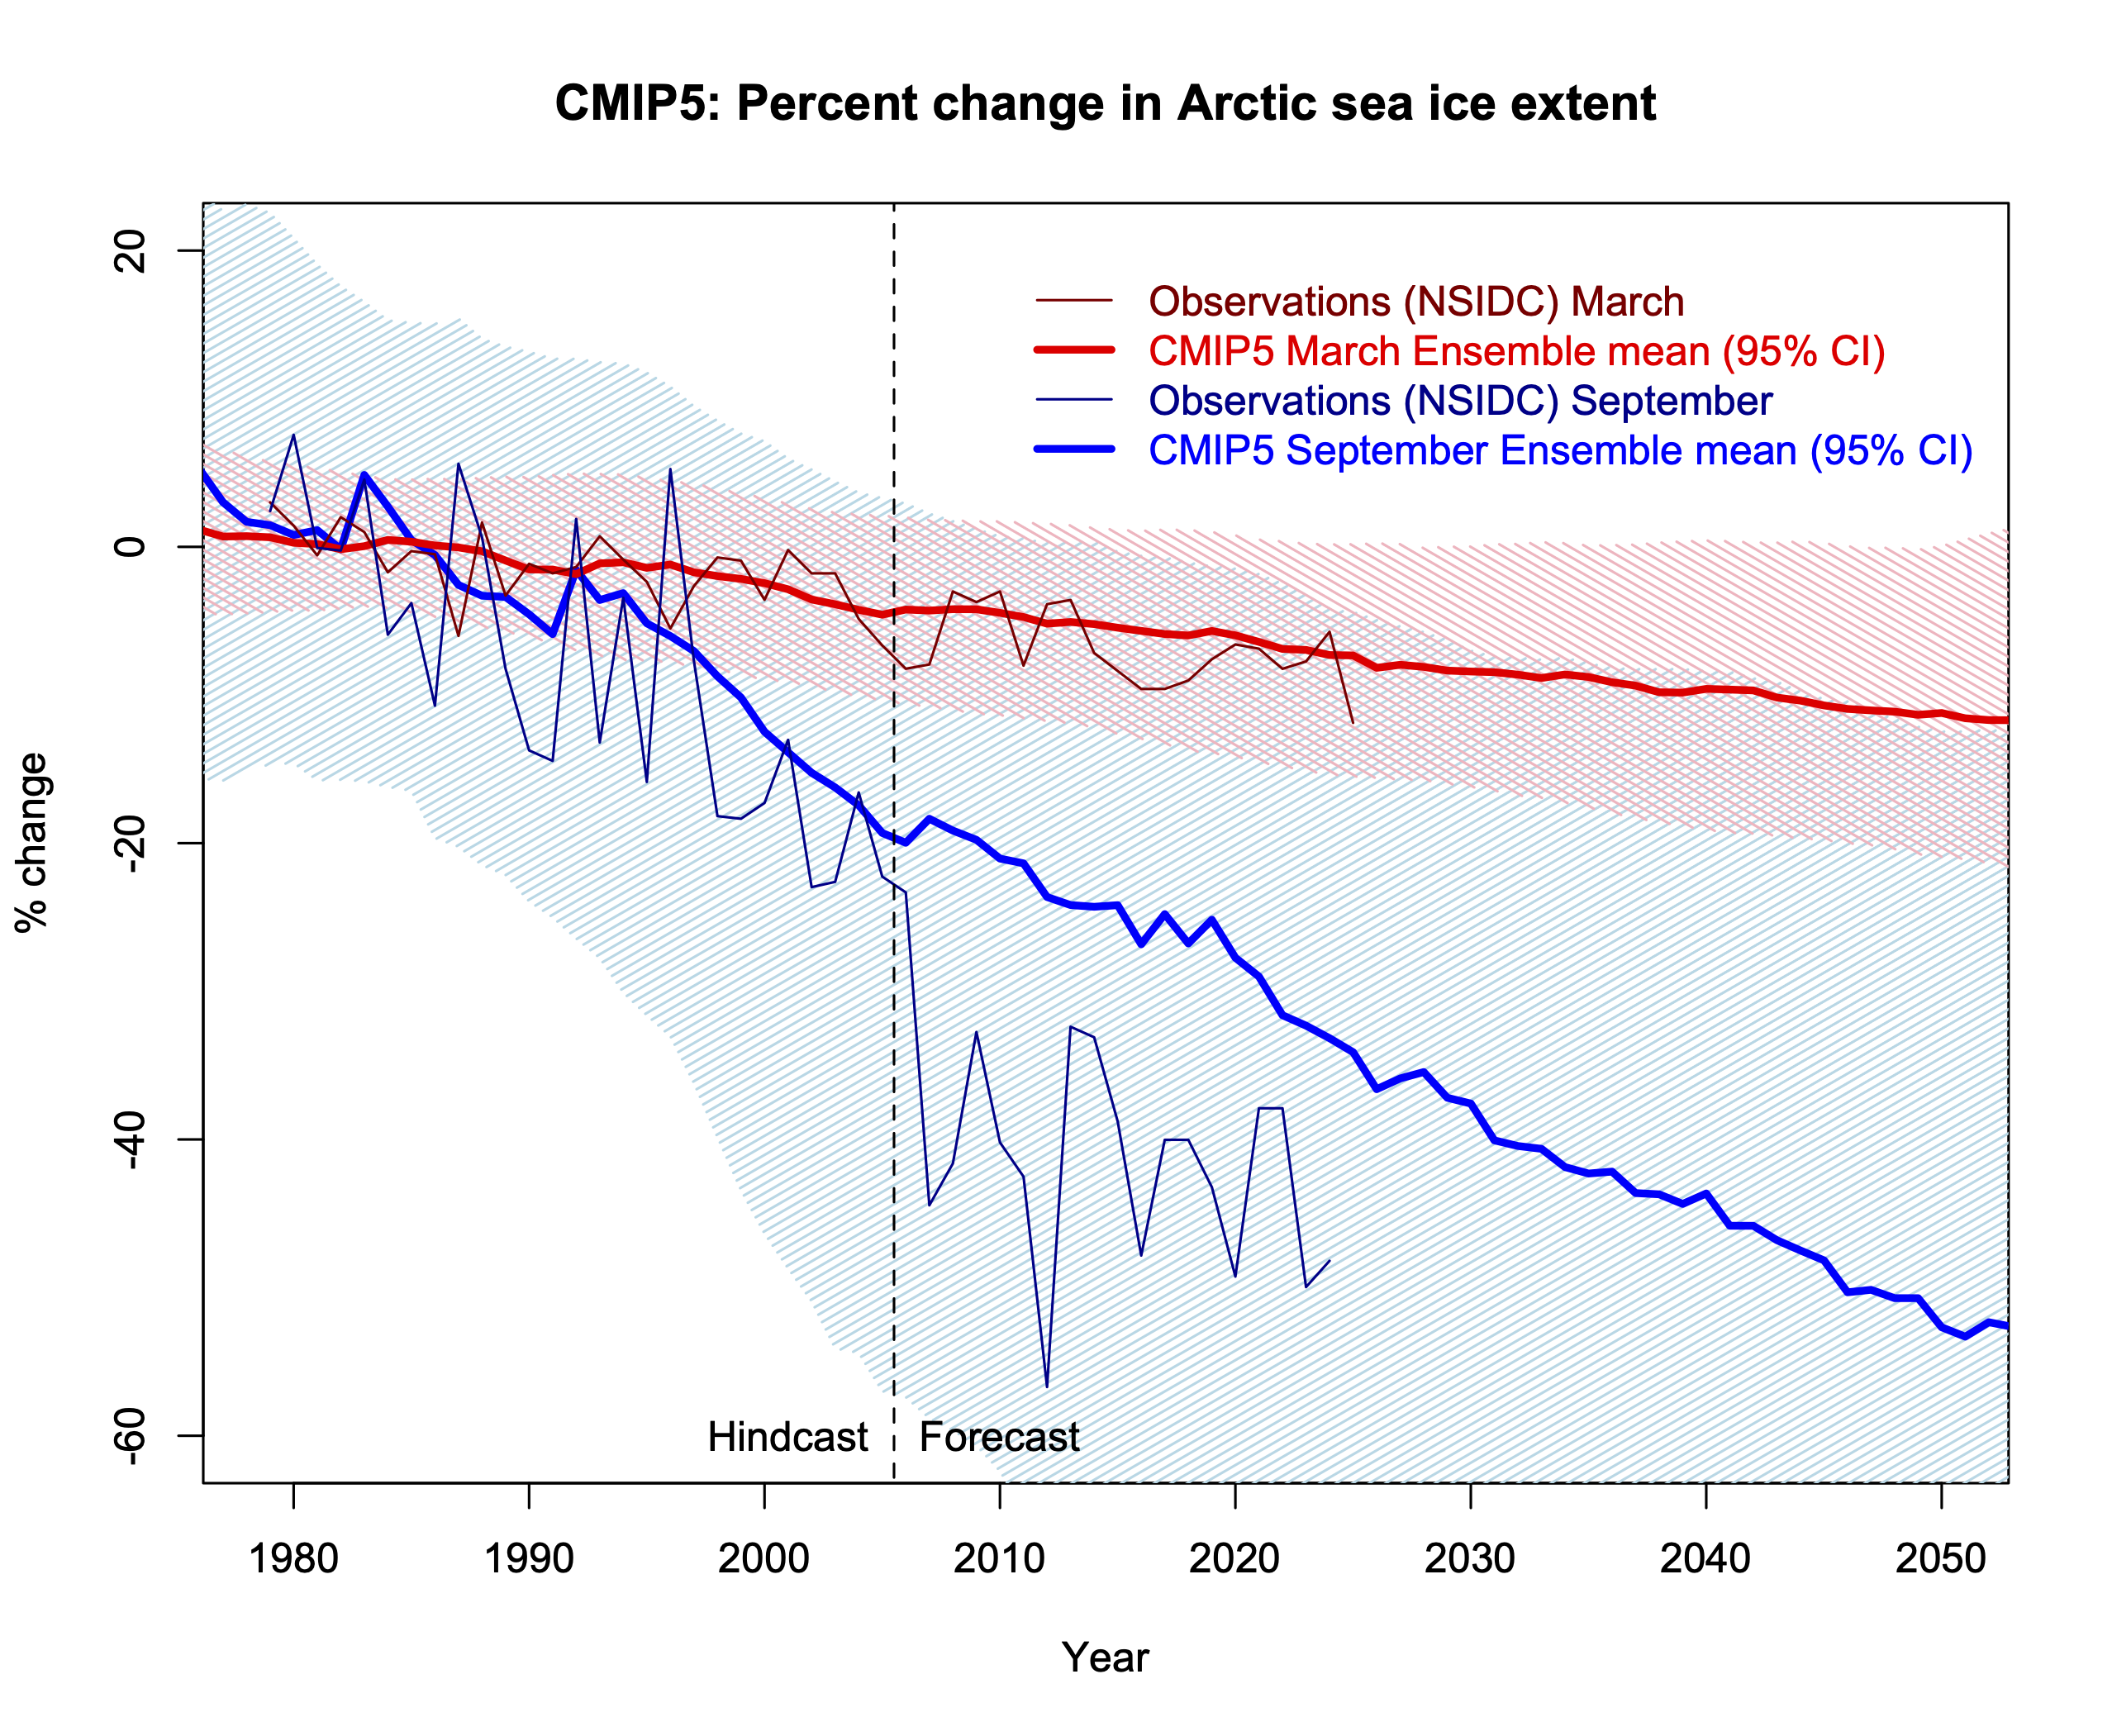
Closer, but no cigar. The spread in the CMIP5 models is larger (a function of greater variability), and the observations are now more within the spread, but the September ensemble mean trend (-8%/decade) is still a bit too low. But nearly 40% of the 107 individual simulations (95% CI is [-20,-1.4]%/decade) now have losses greater than 10%/decade. The March trends are mostly well represented, but there are still large variations in the absolute extent.
There was a longer gap before CMIP6, but those models were developed through to 2017/8 or so, and so developers were well aware of the ongoing discrepancies (Stroeve et al., 2012). Again, there were improvements in sea ice physics, dynamical schemes, forcings (the addition of black carbon impacts on snow and ice albedo for instance), and again, improvements in resolution and in the base climatology.
As a minor aside, from 2007 to 2014 there was a spate of un-peer reviewed claims from a few scientists (Peter Wadhams and Wiesław Masłowski notably) that used non-linear statistical fits to the observed sea ice indices to predict essentially ice-free conditions by 2013, or 2016 or so. These predictions were not based on any physical insight or model, were heavily criticised by other scientists at the time (I recall a particularly spicy meeting at the Royal Society in 2014 for instance!), and (unsurprisingly) were not validated. But this kind of stuff is perhaps to be expected when the mainstream models are not providing credible projections?
Anyway, back to CMIP6. Third time’s a charm?

Actually, this isn’t bad. The CMIP6 ensemble mean for September area trends is now -11 %/decade (observed 13 %/decade) and the March trends are spot on. Note that the observed loss in ‘area’ is slightly larger than the trend in ‘extent’ (13 %/decade vs. 11 %/decade) and I’m using area here because that is what is available. The spread for September trends is [21,3] %/decade which is slightly tighter than in CMIP5, and 40% (again) have losses greater than 10 %/decade.
What lessons can be drawn here?
As we have often stated, models are always wrong, but the degree to which they can be useful needs to be addressed – by variable or by model generation or by model completeness etc. The utility of the CMIP6 ensemble (and presumably the upcoming CMIP7 models) for Arctic sea ice is clearly higher than the CMIP3 ensemble, but there doesn’t appear to be a single thing that needed to be fixed for that to happen. Rather, an accumulation of improvements – in physics, resolution, completeness, forcings – have led to a gradual improvement in skill (not just in the sea ice trends!).
As Simpson et al (2025) noted, there are increasing numbers of climate quality diagnostics that have long enough time series and emerging signals of change, such that there are an increasing number of tests for the model trends. The history of Arctic sea ice comparisons shows that it might be premature to conclude that any specific discrepancies imply that something is fundamentally wrong, or that climate modeling is in a ‘crisis’ (Shaw and Stevens, 2025), it may well be that these discrepancies will resolve themselves in the course of ‘normal’ model development (and as the observed signals become clearer). Or not ;-).
Note on sources: CMIP3 (Mar, Sep) and CMIP5 (historical, rcp45) processed extent data are from Jacob Dörr (Notz et al, 2020) and Alex Jahn (via Julienne Stroeve and Patricia Derepentigny), and the CMIP6 area data is from the U. of Hamburg data portal (courtesy of Dirk Notz). Ensemble means are over the whole ensemble with one simulation = one vote. Also I haven’t screened the CMIP6 models by climate sensitivity (as I’ve done for the temperatures). These choices might make small differences, but not effect the main conclusions.
References
- I.R. Simpson, T.A. Shaw, P. Ceppi, A.C. Clement, E. Fischer, K.M. Grise, A.G. Pendergrass, J.A. Screen, R.C.J. Wills, T. Woollings, R. Blackport, J.M. Kang, and S. Po-Chedley, "Confronting Earth System Model trends with observations", Science Advances, vol. 11, 2025. http://dx.doi.org/10.1126/sciadv.adt8035
- J. Stroeve, M.M. Holland, W. Meier, T. Scambos, and M. Serreze, "Arctic sea ice decline: Faster than forecast", Geophysical Research Letters, vol. 34, 2007. http://dx.doi.org/10.1029/2007GL029703
- J.C. Stroeve, V. Kattsov, A. Barrett, M. Serreze, T. Pavlova, M. Holland, and W.N. Meier, "Trends in Arctic sea ice extent from CMIP5, CMIP3 and observations", Geophysical Research Letters, vol. 39, 2012. http://dx.doi.org/10.1029/2012GL052676
- T.A. Shaw, and B. Stevens, "The other climate crisis", Nature, vol. 639, pp. 877-887, 2025. http://dx.doi.org/10.1038/s41586-025-08680-1
- D. Notz, and S. Community, "Arctic Sea Ice in CMIP6", Geophysical Research Letters, vol. 47, 2020. http://dx.doi.org/10.1029/2019GL086749
Thanks, Gavin! This reminds me of conversations past, in which I tried to explain that 1), more than one climate variable matters; 2) that yes, climate science was and is cognizant of errors, 3) is willing to admit that errors happen, and 4) works to learn from them. Also that, as Ray has said in the past, errors are not always overpredictions, and by extension that “uncertainty is not a friend.”
GAVIN SAYS:
The utility of the CMIP6 ensemble (and presumably the upcoming CMIP7 models) for Arctic sea ice is clearly higher than the CMIP3 ensemble, but there doesn’t appear to be a single thing that needed to be fixed for that to happen. Rather, an accumulation of improvements – in physics, resolution, completeness, forcings – have led to a gradual improvement in skill (not just in the sea ice trends!).
Title:
Have Climate Models Earned Their Arctic Sea Ice “Improvement” — Or Are We Just Smoothing Over 23 Years of Failure?
The recent RealClimate article reviewing predicted Arctic sea ice trends across CMIP ensembles (CMIP3 through CMIP6) raises some troubling questions about how the modeling community is now reframing past model failures as part of a “gradual improvement” narrative.
Let’s be clear: for over two decades, CMIP3, CMIP4, and CMIP5 generated Arctic sea ice projections that were not just slightly off — they were deeply, persistently, and systematically wrong. Most of those models predicted summer sea ice persisting well into the late 21st century, yet we now face plausible scenarios of an ice-free Arctic September in the 2030s or earlier. That’s not a minor deviation — that’s a massive forecasting failure for a major climate system component.
And now, suddenly, we’re told that CMIP6 is doing better — as though this were the natural result of steady scientific progress. But this glosses over some vital issues:
1. Where Is the Post-Mortem on CMIP3–5?
There is zero transparency in most public-facing articles about why CMIP3–5 failed so badly on sea ice. What specific physics, parameterizations, forcings, or feedbacks were missing or mishandled? Without a detailed diagnosis, how can we be sure CMIP6 isn’t just accidentally “right” — or worse, tuned to appear so?
Science is supposed to be about falsifiability and explanation. Yet there’s been no real accounting for how those older ensembles went so wrong, just vague talk of “improvements in resolution and physics.”
2. Improvement… or Post-Hoc Tuning?
The fact that CMIP6 now better aligns with observations after years of criticism about underestimation naturally raises the question: are models now being subtly calibrated or post-tuned to fit the observed data more closely? That’s not inherently unscientific, but it is problematic if:
— It’s not disclosed.
— It gives a false sense of predictive skill.
— It masks ongoing weaknesses within individual models.
3. The Ensemble Mean Hides the Outliers
The RealClimate article relies heavily on smoothed ensemble means, which — while useful for broad comparison — can obscure the fact that many individual model runs still perform poorly. This statistical smoothing flattens out the actual spread and makes the results look more robust than they are.
Even Gavin Schmidt and Roger Pielke Jr. have, in other contexts, pointed out that over-reliance on ensemble means can hide critical flaws. The question isn’t whether the average is better — it’s whether the individual models have learned to capture key dynamics, or whether we’re just cherry-picking those that happen to now align with observation.
4. Coincidence or Competence?
If CMIP6 now “gets it right,” we must ask: is this a real validation of the physical models — or just a statistical coincidence? After 23 years of flawed outputs, we’re owed more than hand-waving and retrospective optimism.
Where’s the evidence that these improvements stem from first-principles physics, and not just smarter curve-fitting or scenario tweaking?
Final Thought
We’re talking about one of the most sensitive climate indicators on Earth — Arctic sea ice — and the narrative now seems to be: “We underestimated it for two decades, but trust us, CMIP6 is better.”
Fine. Then prove it — with transparency, with detailed analysis of past errors, and with testable physical justifications for current model success.
Until then, it’s not denialism to question whether this “success story” is being oversold. It’s just responsible skepticism — the foundation of good science and high public communication standards.
William why do you fill this page up with so many words which don’t actually say much. You could have instead asked Gavin or whomever for examples of how the understanding of physics related to ice sheets has improved. I asked the Google AI search tool and got a detailed answer.
Addendum – Following Up on Arctic Sea Ice Model Skill
Gavin writes:
“One of the most high profile ‘misses’ in coupled modeling over the last few decades was the failure of the model projections in CMIP3 […] to match the rapid losses in Arctic sea ice.”
Yes — and that’s putting it mildly. The ensemble mean and most individual CMIP3–5 model runs not only failed to capture the magnitude of sea ice loss, they fundamentally misunderstood its timing, trajectory, and sensitivity. This was not a minor calibration error — this was a systemic failure, sustained over multiple generations of models.
CMIP6: A Step Forward?
Figure 3 now presents percent change in sea ice area, not extent — yet the CMIP6 ensemble still fails to match the observed trajectory.
The 2007–2012 collapse remains a clear outlier, still not captured by the mean, nor bounded by plausible confidence intervals.
The spread of model projections is disturbingly wide. For 2014, the 95% CI for September ice area ranges from ~3% to over 90% loss. By 2038, it ranges from 15% to well over 100%. These are not scientifically defensible bounds — they suggest fundamental incoherence, not physical realism.
Why is there no work done on Arctic Sea Volume PIOMASS, surely the most critical component for forecasting a blue ocean event and everything else.
Why Invoke Wadhams?
Introducing extreme lowball forecasts (e.g. from Wadhams) serves only to make flawed model ensembles appear “reasonable” by comparison. But this rhetorical tactic distracts from the central issue: the models meant to inform policy, the IPCC, and public understanding have not performed well — and still don’t.
If mainstream models lack credibility, say that plainly. Don’t frame it as a hypothetical:
“Perhaps to be expected when the mainstream models are not providing credible projections?”
That should have been the subtitle:
“Mainstream CMIP models still do not provide credible projections for Arctic Sea Ice.”
Backward-Averaged Success?
You cite -11%/decade September sea ice area trend in CMIP6 (vs -13% observed) from 1979–2025 as evidence of “not bad” performance. But that’s a post hoc average, folding in newer data into older models. It tells us nothing about the forecasting skill of these models in real time. And it masks critical errors during the key period (2007–2012) when the models were most needed.
The issue isn’t whether CMIP6 looks better when smoothed over 45 years — it’s whether it can tell us anything reliable about 2025–2040. From the September % change spread you cite — clearly, it can’t.
Usefulness?
You quote the classic line:
“All models are wrong, but some are useful.”
Then please — quantify the usefulness. How useful were CMIP3–5 for Arctic sea ice? What impact did they have on IPCC projections, or on the scientific literature? What decisions were based on them?
More importantly: how is CMIP6 useful now — when the projected 2025 Arctic September ice loss ranges from ~5% to >100%? That isn’t predictive power — it’s noise. It suggests no practical understanding of how Arctic sea ice will behave in the next 12 months, let alone decades.
Discrepancies “Resolving Themselves”?
Gavin concludes:
“…these discrepancies will resolve themselves in the course of ‘normal’ model development… Or not ;-)”
This sounds flippant. Discrepancies don’t “resolve themselves.” Either:
— The physics improves,
— The parameters are constrained,
— The resolution is refined,
— Or the tuning is made more explicit.
Or else, the model remains wrong.
Worse, your statement seems to simultaneously defend the current ensemble and anticipate its future irrelevance. That’s not scientific humility — that’s hedging. And it weakens public trust.
Final Thoughts
You ask us to continue treating CMIP as the foundation of climate projection — yet when major failures persist for over 20 years, the response is: “They’re improving. Probably. Maybe. Let’s wait.”
That’s not good enough. We deserve:
— A clear technical post-mortem on CMIP3–5 sea ice errors;
— A transparent discussion of how CMIP6 was corrected (or tuned) in response;
— And a candid assessment of what confidence we should place in CMIP7.
Until then, it’s hard to see this as anything more than an exercise in statistical cosmetics.
It doesn’t matter how much lipstick you put on a pig — it’s still a pig.
The ensemble mean might look smoother now, but the model’s skill remains unresolved.
Accuracy is not the same as aesthetic.
Follow-up: Persistent Divergence Between Observations and CMIP6 Projections
One detail that still doesn’t get the attention it deserves: the last 18 years of observed September Arctic Sea Ice minimum trends (2007–2024) remain consistently out of step with the CMIP6 ensemble mean — not just as isolated years, but in the overall trajectory, both in magnitude and rate of change.
The observed decline is more stepwise and abrupt, especially around the 2007 and 2012 minima.
CMIP6 continues to show a smoother, more linear descent that fails to capture the inflection points of real-world losses.
Even today, the ensemble mean lags behind, while the observed data have flattened somewhat in recent years — a nuance CMIP6 doesn’t reflect either.
This persistent mismatch raises two key concerns:
Is CMIP6 tuned only to capture long-term averages, rather than decadal-scale dynamics, tipping points, or variability?
If so, how can it be considered useful for real-world policy, where near-term changes (like the prospect of ice-free Septembers before 2040) carry enormous implications?
We are not talking about modest noise here. The divergence is systematic and enduring, and yet rarely addressed in detail. Why? Until that gap is explained or reconciled, confidence in CMIP’s ASI projections seems… aspirational at best.
For instance, Stroeve et al. (2012) highlighted that earlier models underestimated the rate of sea ice loss, a trend that continues with CMIP6. Furthermore, Notz and SIMIP Community (2020) found that while CMIP6 models offer improved sensitivity estimates, they still fail to simulate a plausible evolution of sea-ice area alongside global mean surface temperature.
MPG.PuRe+7eesm.science.energy.gov+7NOAA Institutional Repository+7
This persistent mismatch raises questions about the models’ ability to accurately represent key processes affecting sea ice dynamics. Until these discrepancies are addressed, reliance on CMIP6 projections for policy-making and climate forecasting remains problematic.
Source Refs
https://eesm.science.energy.gov/publications/arctic-sea-ice-cmip6
https://repository.library.noaa.gov/view/noaa/29934
https://www.osti.gov/pages/biblio/1618526
https://epic.awi.de/id/eprint/51815/
https://link.springer.com/article/10.1007/s00376-022-1460-4
https://scispace.com/papers/arctic-sea-ice-in-cmip6-1t3idhfbxw
https://www.sciencedirect.com/science/article/pii/S1674927824000844
https://pure.mpg.de/rest/items/item_3221097_3/component/file_3231260/content
An assessment of the CMIP6 performance in simulating Arctic sea ice volume flux via Fram Strait
Evaluating the simulation capabilities of the most recent CMIP6 models in sea ice volume flux provides references for model applications and improvements. Meanwhile, reliable long-term simulation results of the ice volume flux contribute to a deeper understanding of the sea ice response to global climate change.
And note Fig.1
https://www.sciencedirect.com/science/article/pii/S1674927824000844
“Until these discrepancies are addressed, reliance on CMIP6 projections for policy-making and climate forecasting remains problematic.”
A question. What sort of policy-making might result from better sea ice model projections and improvements…a deeper understanding of global climate change?
Reply to Ken Towe
Great question — and you’re right to sense there’s a deeper conversation that should be occurring here. Here’s a response off the top of my head to:
> “What sort of policy-making might result from better sea ice model projections and improvements… a deeper understanding of global climate change?
—
Improved sea ice projections wouldn’t just refine academic understanding — they could significantly influence a range of policy decisions, especially those tied to regional risk management, climate adaptation, and strategic planning. Specifically:
1. **Shipping and Arctic Navigation**
Reliable sea ice forecasts are crucial for commercial and military navigation through the Arctic (e.g., the Northern Sea Route or Northwest Passage). Better projections inform infrastructure investments, safety protocols, and insurance risk calculations for Arctic shipping.
2. **National Security and Geopolitics**
Nations with Arctic interests (Russia, Canada, the U.S., China, etc.) rely on long-term projections to shape defense postures and territorial claims. Sea ice decline forecasts influence everything from military base placement to submarine patrol routes and sovereignty disputes.
3. **Indigenous and Coastal Communities**
Accurate modeling affects community planning for northern populations that depend on sea ice for transportation, hunting, and cultural survival. It also influences relocation policies and climate resilience funding.
4. **Climate Feedbacks and Carbon Budgets**
Arctic sea ice loss affects albedo (reflectivity), regional amplification, and atmospheric circulation patterns. Getting those dynamics right is key to projecting downstream climate impacts elsewhere — which in turn affects global carbon budget calculations, timelines for net-zero targets, and urgency behind emission cuts.
5. **Biodiversity and Ecosystem Protections**
Sea ice governs key marine ecosystems. Policy on fisheries management, marine protected areas, and species conservation — from polar bears to krill — depends on reliable predictions of habitat change.
6. **Credibility and Communication of Climate Risk**
When models repeatedly under- or over-predict key features like sea ice, it erodes public trust in climate science. More accurate, verifiable sea ice projections help rebuild that trust and improve how risks are communicated to policymakers and the public.
Over and above all that ASI changes influence global temperatures and our ability to provide short to medium term global temperature projections. Such knowledge should be feeding into everything from the IPCC work to understanding why the Paris Agreement and actions by the UNFCCC and COP system are deeply broken. The ASI and Antarctic SI projections of this CMIP6 remain so wrong. they not fit for any purpose.
So yes — better projections wouldn’t just be about “understanding” climate change. They would refine *practical, real-world decision-making* in domains that touch energy policy, defense, trade, indigenous rights, environmental protection. Along with global climate diplomacy and potentially practical action plans to address global warming itself.
Would you like to follow with your own points? I’d love to compare.
William said “Great question — and you’re right to sense there’s a deeper conversation that should be occurring here. Here’s a response off the top of my head to:
> “What sort of policy-making might result from better sea ice model projections and improvements… a deeper understanding of global climate change?”
Williams response that he claims is off the top of his head looks like it’s written by AI. I just asked google gemini the same question to test this, and got a remarkably similar response.
William: “This persistent mismatch raises questions about the models’ ability to accurately represent key processes affecting sea ice dynamics. Until these discrepancies are addressed, reliance on CMIP6 projections for policy-making and climate forecasting remains problematic.”
I can’t quite decide if this argument is an example of a Ignoratio elenchi (irrelevant conclusion, missing the point) fallacy, a straw man fallacy. or a logic chopping fallacy (nit-picking, trivial objections). In any case, the conclusion is unsupported by the given evidence.
Reply to Steven Emmerson
In your opinion — which, unlike William’s comments, is not supported by any actual evidence.
And that is assuming you even read (let alone understood) the references provided and the specific points William was drawing from. ( I don’t) Easier, I suppose, to wave it all away with a vague Hubristic Sniff about fallacies, while offering none of your own substantive counterpoints.
Prevarication isn’t rebuttal.
So… no counter-evidence, no engagement with the citations, no analysis of the actual claim — just a vague gesture at fallacies and a dismissive shrug. It doesn’t work — especially when the post you’re brushing off is better referenced and more rigorous than your own unsubstantiated opinions.
Gavin’s rhetorical fog was bad enough. Now it’s pea soup. Can’t see a thing. A forum being true to form.
PP: Gavin’s rhetorical fog was bad enough. Now it’s pea soup. Can’t see a thing. A forum being true to form.
BPL: You’re right, this is a horrible forum. If I were you, I’d leave and never come back. That’ll show ’em!
Thanks for an article on my favourite topic Gavin!
I heartily recommend an additional reference, which perhaps goes some way to explaining the significant excursions below the September trend in 2007 and 2012?
0. C. M. Bitz and G. H. Roe, “A Mechanism for the High Rate of Sea Ice Thinning in the Arctic Ocean”, Journal of Climate 2004
https://www.atmos.washington.edu/~bitz/Bitz_and_Roe_2004.pdf
“A general theory is developed to describe the thinning of sea ice subjected to climate perturbations, and it is found that the leading component of the thickness dependence of the thinning is due to the basic thermodynamics of sea ice. When perturbed, sea ice returns to its equilibrium thickness by adjusting its growth rate. The growth–thickness relationship is stabilizing and hence can be reckoned as a negative feedback. The feedback is stronger for thinner ice, which is known to adjust more quickly to perturbations than thicker ice. In addition, thinner ice need not thin much to increase its growth rate a great deal, thereby establishing a new equilibrium with relatively little change in thickness. In contrast, thicker ice must thin much more. An analysis of a series of models, with physics ranging from very simple to highly complex, indicates that this growth–thickness feedback is the key to explaining the models’ relatively high rate of thinning in the central Arctic compared to thinner ice in the subpolar seas.”
”
Perhaps it also helps explain the alleged “pause” in Arctic sea ice decline, so popular in cryodenialistic echo chambers at the moment?
Link: https://agupubs.onlinelibrary.wiley.com/doi/pdf/10.1029/2020GL087965
Key findings from the paper (Notz et al., 2020):
No significant improvement in Arctic sea ice projections between CMIP5 and CMIP6.
“Models that participate in CMIP6 do not show a clear improvement in simulating observed sea‐ice trends over recent decades compared to models from earlier phases of CMIP.”
Still too much Arctic sea ice in CMIP6 simulations for recent decades.
The models systematically overestimate September sea ice extent compared to observations. Same problem as before.
Antarctic sea ice is still mishandled:
The observed increase from 1979 to ~2015 is not captured in the models — which instead show a decrease. That’s a complete miss.
So… What Is Going On? What is the purpose of this article here now?
It’s a little suspicious:
Damage control / reputation management: CMIP3–5 have been (rightly) criticized for years — particularly in terms of Arctic sea ice projections. CMIP6 was supposed to be better. It’s not — at least not clearly — so some scientists may now be trying to massage that narrative.
Preemptive narrative setting: With CMIP7 now being discussed, this may be a way to gently sweep past failures under the rug and frame them as “normal model evolution” — a soft reset, rather than an admission of serious structural flaws or poor tuning.
Defensive posture disguised as openness: Gavin’s tone seems reflective and modest — but the actual content is evasive, hand-wavy, and deflects scrutiny. Mentioning Peter Wadhams as a foil is a distraction tactic, not a serious engagement with past model failure.
Audience management: RC serves both policymakers and laypeople, many of whom are not model specialists. A vaguely reassuring tone — “things are improving” — reduces anxiety and protects institutional credibility, even if it glosses over fundamental problems.
Combine that with vague language like:
“…discrepancies will resolve themselves… Or not ;-)”
and
“…models are always wrong, but still useful…”
— and you’re left with a kind of rhetorical fog machine: soften the failures, spotlight only the ensemble mean, and dodge the hard accounting.
The framing of this post — and the timing — doesn’t quite add up. Compared to dozens of other pressing climate concerns, why this topic, and why now? Five years on from CMIP6, its performance in simulating Arctic and Antarctic sea ice (extent, concentration, and trends) remains poor. It has shown little demonstrable skill in predicting critical inflection points like blue ocean events — and the record hasn’t meaningfully improved since CMIP5.
That the 2020 paper linked here flatly contradicts any claim of serious CMIP6 improvement is telling. The issues have all been covered before in dozens of similar papers.
One of the quieter scandals in climate science communication — particularly around modeling — is how little post-hoc accountability or rigorous performance review takes place. For all the resources poured into CMIP modeling, almost no one in the mainstream is willing to step back and plainly ask:
“How well did these projections actually match reality over the past 10 to 20 years?”
Even serious published critiques (like Notz et al. 2020) are rarely engaged with in public-facing commentary. The pressure to preserve institutional credibility — and to avoid feeding denialist talking points — often leads to a kind of professional omertà: silence, spin, or deflection.
But here’s the truth:
Scrutiny is not denial.
Critiquing poor model performance is scientific due diligence, not heresy.
And holding public scientists to higher standards of clarity, transparency, and engagement only strengthens public trust — it doesn’t erode it.
One day it might begin to happen. Until then there will be no looking under the climate models hood.
Multi-troll: “Key findings from the paper (Notz et al., 2020): No significant improvement in Arctic sea ice projections between CMIP5 and CMIP6.”
and … what statistical criteria have you, or your source, used to determine the “insignificance” of the improvement? Because if you/your source didn’t – then you are using this word in the unscientific, colloquial meaning, of how it LOOKS to you. Which would make it a SUBJECTIVE (i.e. untestable) OPINION. Something along the lines of Chico Marx chiding a women surprised to see him in her bedroom:
– But I saw you [leaving the bedroom] with my own eyes!
– Well, who ya gonna believe me or your own eyes [Fig. 2 vs Fig. 3]?”
Multi-troll: “But here’s the truth: Scrutiny is not denial. Critiquing poor model performance is scientific due diligence, not heresy.”
But using the imperfect model representation of one of the most difficult to replicate outcomes of AGW (change in the sea-ice cover area) to question the credibility of ALL AGW modelling, in order to DISMISS the sense of reductions in GHG emissions using existing technologies and implementable mechanisms (price on GHG emissions) – is a MAINSTAY of DENIALISM – deniers focus on some not necessarily crucial aspect – to throw the entire AGW modelling, and the need to reduce GHGs, with the bathwater.
But it is been already discussed on RC to death, E.g.
==== UV, May 2025 =============
– William: “ I’m not a denier”
– me: “We don’t have to rely on your self-serving declarations, your posts would do: you have just tried to discredit the only feasible way to mitigate AGW (by calling the reductions in GHGs NEITHER “ feasible [nor] wise“, and justified it by saying that they merely “treat symptoms, not causes“) in favour of an alternative [rapid deindustrialization and reduction of population by many billions] THAT YOU KNOW cannot be realistically implemented on the necessary time-scale [next 1-2 decades].
Which is a very definition of an “anything-but-GHGs denier“.
=================================
“to DISMISS the sense of reductions in GHG emissions using existing technologies” …and to throw the entire AGW modelling, and the need to reduce GHGs, [out] with the bathwater.”
Surely, you are aware of the fact that rapid reductions in CO2 emissions will take none of the CO2 already added (420 ppm) out of the atmosphere to lower global temperatures. It does leave carbon in the ground, But that makes it more expensive and difficult for transportation to continue the energy transition to renewables and EVs.
KT: rapid reductions in CO2 emissions will take none of the CO2 already added (420 ppm) out of the atmosphere to lower global temperatures. It does leave carbon in the ground, But that makes it more expensive and difficult for transportation to continue the energy transition to renewables and EVs.
BPL: Transportation can be electrified or work off alternate fuels. Your “we need more fossil fuels to transition to a world without fossil fuels” doesn’t make any sense.
Mr. Levenson…Try doing anything of consequence without using vehicles that run on fossil fuels..Feed eight billion people for example. Install solar and wind farm projects.
Ken Towe: “ Surely, you are aware of the fact that rapid reductions in CO2 emissions will take none of the CO2 already added (420 ppm) out of the atmosphere
Surely, you are aware of the fact that I have taken apart the same argument when you were making it two weeks before. Let me refresh your memory:
=====
Ken Towe 17 May: “GHG reductions, reducing emissions, will take none of the CO2 already added out of the atmosphere”
Piotr 18 May: “First – if large enough – they WILL result in the taking down CO2 already in the atmosphere – as natural uptake will no longer be overpowered by the new human emissions – currently only half of the emitted CO2 stays in the air the reset is absorbed by the natural sinks.
Second – yours is a typical denier/doomer all-or-nothing argument – if we can’t reduce the current levels of CO2 then let’s do nothing and keep increasing atm. Co2. The obvious and fallacy here is that the world at 425ppm won’t be as hellish as the world at 850 ppm.
So you are like a man who stabs his neighbour with a knife, justifies his refusal to stem the bleeding by saying that it would be pointless, since “ it will not bring back any blood you already lost and therefore he plans to continue stabbing the victim until he is dead.
=== end of quote =====
To which, other than crying how the other posters are mean to you (you characterizing the above as “ personal insults” ;-)) – you had NO answer to the above FALSIFIABLE arguments.
Nor had your defender, as in his powerful intellect he understood the above as me …. having to admit that his Ken was right:
Multi-Troll (“Thesallonia”): “ Piotr acknowledged that CO₂ will decline slowly once emissions stop — which aligns with what Ken said.”
So unable to defend your claim in the original thread – you repeat it, hoping for a different outcome? You know the definition of what is this? ;-)
Reply to readers
Catastrophic climate change impacts are always local, not global.
a reminder from https://climateandeconomy.com
Mindful that nothing that the above cheap troll does has any effect on anything. He is just another self-infatuated bloviating bullshit artist who loves to hear himself talk and has done nothing but praise himself and insult everyone else since the day he arrived at RC. He is a boor and a bore, and his comments are worthless and empty.
Hat tip to secular animist for the above content he posted. Imitation is the most sincere form of praise.
Pedro prietos depiction of Piotr is wildly inaccurate, and is just a classic example of psychological projection.
William reply about Piotr’s comment:
So now he’s quoting me from another thread while I was replying to a different person on a different topic entirely, ignoring the whole of what Pedro Pietro wrote here. From that he is constructing a fantasy mashup of motivations, identities, and imagined threats to climate science. Piotr left the realm of reasoned argument and crossed into performance art. Even worse.
Let me make it simple for everyone else: while backing up Pedro’s rational framing and genuine concerns.
“Critiquing poor model performance is scientific due diligence, not heresy.”
Everyone has a basic human right to question what’s produced. That does not equate to denying all climate modeling as is being falsely alleged here against Pedro — and, I suspect, myself as well. It’s honestly hard to follow the total lack of coherence and all-caps intolerance Piotr brings to the table. Nor does that comment, made in good faith, justify the paranoid screed he launched into.
If he can’t tell the difference between scientific scrutiny and denialism, maybe he should stop imagining he’s the arbiter of either.
Finally, Piotr didn’t engage with any of Pedro’s conclusions or actual opinions. We all have opinions — even Piotr (God help us) — but all he’s staged here is yet another slapstick routine from the Marx Brothers movie playing in his head. He has no arguments. No logic. It’s just projection, all the time. That’s his ongoing contribution to this forum: constant trolling. It’s better ignored — or better yet, binned.
Pedro –
The link you provided is to Shu et al. (2020), which does not include your quoted key finding but instead says, “The observed Arctic September SIE declining trend (−0.82 ± 0.18 million km2 per
decade) between 1979 and 2014 is slightly underestimated in CMIP6 models (−0.70 ± 0.06 million km2 per
decade),” which sounds pretty good to me.
The most plausible Notz et al. (2020), titled “Arctic Sea Ice in CMIP6” (https://agupubs.onlinelibrary.wiley.com/doi/full/10.1029/2019GL086749) doesn’t include your quoted key finding either but instead says, “In particular, the latest generation of models performs better than models from previous generations at simulating the sea-ice loss for a given amount of CO2 emissions and for a given amount of global warming.”
A shocker… Or not.
Thanks, Dr. N-G.
Reply to John N-G
Apologies that seems to be a sticky copy paste url. Your url is correct: https://agupubs.onlinelibrary.wiley.com/doi/full/10.1029/2019GL086749 or
https://repository.library.noaa.gov/view/noaa/29934 or
https://par.nsf.gov/servlets/purl/10173113
And I didn’t convey my meaning or sources accurately either, I was in a rush, sorry.
I covered broader ground and cannot detail every point I’ve seen related to or in Notz et al accurately here, sorry. It’s old news anyway, long ignored. Feel free to draw your own conclusions based on what you choose to read and check yourself.
Try for example the above quote you mention came from: Arctic Sea Ice in CMIP6
https://scispace.com/papers/arctic-sea-ice-in-cmip6-1t3idhfbxw
TL;DR: In this article, the authors examined CMIP6 simulations of Arctic sea ice area and volume and found that most models fail to simulate at the same time a plausible evolution of sea-ice area and of global mean surface temperature.
Challenges in Simulating Sea Ice and Temperature: Despite the advancements, most CMIP6 models struggle to simultaneously simulate a realistic evolution of both sea-ice area and global mean surface temperature. This discrepancy highlights ongoing challenges in climate modeling.
Sensitivity Metrics Comparison: When comparing sensitivity metrics between CMIP6 and previous CMIP phases, it is generally difficult to distinguish CMIP6 models from those in CMIP5, except for a few highly sensitive simulations. This suggests that while some models have improved, the overall sensitivity landscape remains similar.
This: “Models that participate in CMIP6 do not show a clear improvement in simulating observed sea‐ice trends over recent decades compared to models from earlier phases of CMIP.” is out there somewhere. No time to chase, sorry. The questions and info provided by william may be useful to balance the positive only professional omertà. As he points out the 95% CI range is implausible and the last 18 years results (mini mean trend line) remain far below the ensemble mean even if not as bad as CMIP3 and 5 were.
Still, most CMIP6 models fail to simulate at the same time a plausible evolution of sea-ice area and of global mean surface temperature.
see https://eesm.science.energy.gov/publications/arctic-sea-ice-cmip6
but some simulate implausible historical mean states compared to satellite observations, leading to large intermodel spread. Summer SIA is consistently biased low across the ensemble. Compared to the previous model generation (CMIP5), the intermodel spread in winter and summer SIA has reduced, and the regional distribution of sea ice concentration has improved.
https://www.bas.ac.uk/data/our-data/publication/antarctic-sea-ice-area-in-cmip6/
As a whole, the models successfully capture some elements of the observed seasonal cycle of sea ice but underestimate the summer minimum sea ice area. – Models project sea ice loss over the 21st century in all scenarios, but confidence in the rate of loss is limited, as most models show stronger global warming trends than observed over the recent historical period.
https://www.x-mol.net/paper/article/1251324725277122560
There are more of course but it’s unlikely anyone commenting would be interested here anyway.
There remains more important issues than messy ref urls and expecting any independent person on a forum without the resources of NASA-GISS et all to perfectly convey over 5 years of critical discussions of CMIP6 and sea ice extent at the poles.
I repeat the issue is more about _ “— and you’re left with a kind of rhetorical fog machine: soften the failures, spotlight only the ensemble mean, and dodge the hard accounting.
The framing of this post — and the timing — doesn’t quite add up. Compared to dozens of other pressing climate concerns, why this topic, and why now?”
It’s old news and everyone in the field already knew these CMIP6 sea ice data were still not useful or reliably accurate. The same as Gavin’s 2023-2024 global mean temperature projections were not accurate. Or rather a dismal failure and like CMIP6 (5 and 3) they still cannot work out why.
“But trust me, the cheque is in the mail.”
PP: everyone in the field already knew these CMIP6 sea ice data were still not useful or reliably accurate.
BPL: Predicting an 11% decline when it was actually 13% is “not useful or reliably accurate?” Depends on what your standards for “not useful or reliably accurate” are, doesn’t it?
BPL, exactly right. Predictions will never be 100% accurate, so that gives PP an excuse to constantly complain that things aren’t perfect, and hear the sound of his own voice, and make like he’s saying something useful.
Re. “scrutiny is not denial”…In ANY area of science when we are talking bleeding edge, it takes a _qualified expert_ to do the “scrutinizing”. And, as you may or may not know it takes being in possession of a huge knowledge and skill base that takes years and even decades to master..
Did you do your homework?
jgnfld: as you may or may not know it takes being in possession of a huge knowledge and skill base that takes years and even decades to master..
That’s an essential point. Few deniers or doomers have put the time and effort in to become genuine experts on that of which they speak. Even published experts know their limitations, and depend on their specialist peers for bleeding edge judgements on knowledge and skills they themselves haven’t mastered.
We are fortunate to have Prof. Nielsen-Gammon with us. As Texas State Climatologist, he is a qualified expert on the geophysics of climate change if anyone is. Yet while he has published research on diverse phenomena including sea ice, he acknowledges that he’s not an expert on every climate-related topic. When he’s evaluating a claim that’s beyond his own knowledge, rather than trying to become comprehensively literate on everything that’s known about that topic, he relies on scientific meta-literacy. He spoke at AGU 2012 about it, then wrote a blog post, now only available from the Wayback Machine:
web.archive.org/web/20130213192911/https://blog.chron.com/climateabyss/2013/02/scientific-meta-literacy
Excerpt:
There are, perhaps, less than a thousand people worldwide who know enough about climate change’s impacts on tropical cyclones, extratropical transitions, wind speeds, rainfall rates, and sea level rise to qualify them to evaluate that statement [about Superstorm Sandy]. It’s not even clear that I’m one of them! The requisite level of climate literacy is enormous.
But there’s an important lesson here about how we decide which scientific statements to believe and which ones not to believe. Those of us who are trained scientists but who do not have enough personal literacy to independently evaluate a particular statement do not throw up our hands in despair. Instead, we evaluate the source and the context.
We scientists rely upon a hierarchy of reliability. We know that a talking head is less reliable than a press release. We know that a press release is less reliable than a paper. We know that an ordinary peer-reviewed paper is less reliable than a review article. And so on, all the way up to a National Academy report. If we’re equipped with knowledge of this hierarchy of reliability, we can generally do a good job navigating through an unfamiliar field, even if we have very little prior technical knowledge in that field.
Professional scientists must learn to quickly and reliably tell good science from bad, or they won’t get published. Amateur deniers and doomers who “do their own research”, calling it “due diligence”, are afflicted with the Dunning-Kruger effect. Because due diligence means putting as much time in as the published experts have, and once the denier or doomer has done so, they’ll realize how much of what they thought they knew, was inaccurate!
PP: Critiquing poor model performance is scientific due diligence, not heresy.
BPL: And assuming no one is critiquing poor model performance, and that anyone who critiques it is committing “heresy,” is an extended straw man argument. What the hell do you suppose CMIP is for?
The IPCC AR6 (WGI, Chapter 8.5.2.3) emphasizes that changes in land surface properties, especially soil moisture, can significantly influence atmospheric circulation patterns, including stationary waves, and contribute to polar climate anomalies. Specifically, it states:
“Changes in land surface properties, including soil moisture, vegetation, and snow cover, can alter the surface energy and water balance, which in turn influences atmospheric circulation patterns, including stationary waves and monsoon systems.”
“Such land–atmosphere interactions have the potential to modulate energy and moisture transport into the Arctic and thereby contribute to polar climate anomalies such as sea ice extent and surface temperature patterns.” (AR6 WGI, Ch. 8.5.2.3)
These dynamics are conceptually supported by available data depicted in Seo and co. 2025 “Abrupt sea level rise and Earth’s gradual pole shift reveal permanent hydrological regime changes in the 21st century” https://www.science.org/doi/10.1126/science.adq6529.
ERA5-Land reanalysis (Fig. 4) shows that since around 2000:
https://substackcdn.com/image/fetch/f_auto,q_auto:good,fl_progressive:steep/https%3A%2F%2Fsubstack-post-media.s3.amazonaws.com%2Fpublic%2Fimages%2Fd09e3f0a-2498-489f-9893-3af2064dcb1c_998x431.png
Potential evapotranspiration (PET) has sharply increased due to warming,
Actual evapotranspiration (ET) has flattened or declined, suggesting soil moisture limitation,
Global soil moisture has steadily declined, and
The water balance (P − ET) has become more negative, reflecting increased evaporation demand not met by precipitation.
This would imply that drier soils are reducing latent heat flux and enhancing sensible heating, which in turn could intensify land–ocean thermal contrasts and modify midlatitude circulation, enabling poleward energy transport into the Arctic.
Arctic warming events are often associated with persistent mid-latitude circulation anomalies.
Needless to say, the shape, timing, and character of the ERA5 land moisture reanalysis product shows striking similarity to the Arctic sea ice extent.
However, previously in response to Tomas https://www.realclimate.org/index.php/archives/2025/05/unforced-variations-may-2025/#comment-832708
Gavin Schmidt rightly cautions:
“The whole discussion rests on an assumption that the ERA5 reanalysis is truth, but for variables like soil moisture, the reanalysis trends are going to be highly influenced by whatever datastreams are available – which change over time. I am not persuaded (as yet) that this is not just a data source switch as opposed to a real phenomenon.”
The consistency between theory, observed circulation anomalies, and modeled feedbacks continues to support the plausibility of continental desiccation as a contributor to Arctic anomalies, even as the magnitude and reliability of the soil moisture signal itself remains an active research question. We see how the CMIP suites are only capturing the monotonous creep of the prescribed radiative forcing, and appear to be limited in the scope of tuning.
It could be useful to see if improved model atmospheres arise from prescribing the questionable ERA5L reanalysis moisture product, especially considering these phenomena in ERA5L have striking resemblance to the more reliable observation of Arctic sea-ice extent variation.
In Re to JCM, 1 Jun 2025 at 8:42 AM,
https://www.realclimate.org/index.php/archives/2025/05/predicted-arctic-sea-ice-trends-over-time/#comment-834019
Dear JCM,
Do I understand correctly that in your present post, you summarize arguments why the ERA5 reanalysis, with respect to land moisture, may be correct despite various datastreams used therefor (and that Dr. Smidt’s doubts about it may be overcautious)?
Greetings
Tomáš
P.S.
In a parallel thread, I noted on 13 May 2025 at 3:59 PM,
https://www.realclimate.org/index.php/archives/2025/05/the-most-recent-climate-status/#comment-833207
that “climate status indicators” included in various reports go hardly beyond atmospheric CO2 concetration and various temperature indicators. The same appears to apply for the climate status indicators used on this website:
https://www.realclimate.org/index.php/climate-model-projections-compared-to-observations/
As I think that e.g. global annual precipitation and/or distribution thereof between land and sea may be equally or, perhaps, even more important indicators of changing climate, I would like to repeat my question herein:
“Only the European report contains an information about soil moisture (water content in upper soil layer up to the depth of 7 cm). Unfortunately, while its chapter 13 shows very interesting, mutually interrelated temporal trends in cloud cover and sunshine duration, no analogous information about temporal trends in precipitation, soil moisture and/or river flow can be found in the respective chapters 7, 8 and 9. I have not found an information how the “river flow” was calculated. I could not find any information about summary runoff from Europe, as well as about groundwater levels and their temporal trends. The report is also completely silent about terrestrial vegetation, soil organic matter, and possible trends in their temporal developments.
Information regarding trends in land hydrology, soil condition and terrestrial vegetation seem to be basically missing in all other reports as well, although these factors certainly play a role in both regional as well as global climate regulation and their developments in the future may be crucial for human civilization. I therefore wonder why they are not reported, nor included among “climate indicators” (see e.g. page 11 of the European executive summary) yet.”
Recommendation to lurkers: avoid those using this platform to see themselves in print and attack the authors who have shared their knowledge and expertise with us all. And to those correcting the corrections, who will then correct the corrections of the corrections … you get the picture!
Gavin, three questions:
1. What is your evaluation of this?
https://agupubs.onlinelibrary.wiley.com/doi/full/10.1029/2024EF004961
2. Why is there so much focus on September, rather than March? March going below a certain level is certainly far more serious a “tipping point”, and that’s obvious without any fancy modelling.
3. Is there any fancy modelling that gives an indication of what that level might be?
(I was hoping there might be an actual scientific discussion on this topic, although it seems like the denial-of-service sock-puppet spam-bots are already at work.)
Reply to zebra
Are these only simulations of SAT and not real world observations of SAT which they are comparing in these CMIP6 theoretical estimates? Could it be a hypothetical analysis evaluating an already flawed/imperfect hypothetical model? No free time to check, but you posted the paper, you should know.
Note on Notz et al. (2020):
This paper examines Arctic sea ice trends in CMIP5 and CMIP6 models, specifically analyzing how modeled sea ice loss relates to modeled global mean surface temperature (GMST). It does not directly compare the models’ GMST outputs to observational temperature datasets like GISTEMP or HadCRUT. Instead, it focuses on internal model behavior and consistency across ensemble members. However, observed sea ice extent and area (e.g., from NSIDC) are used as a reference for evaluating modeled sea ice trends.
Notz et al. (2020) paper on Arctic sea ice in CMIP6 :
Compares the sea ice–temperature relationships across models — that is, how each model’s own global mean surface temperature (GMST) relates to its own simulated sea ice extent (SIE).
In other words, they are not evaluating how well each model’s temperatures align with observed global temperatures, nor how well sea ice simulations align with observed sea ice trends at the same level of actual global warming.
Here’s the key methodological excerpt (paraphrased for clarity):
“We consider sea‐ice area and global mean surface air temperature as simulated by each model… This allows us to determine the simulated sensitivity of Arctic sea‐ice area to warming for each model.”
At least is what it sounds like to me and others. The devil is always in the details, yes? It definitely is when it comes to energy systems and consumption.
Of the 6 responses to Gavin article as of Jun 1, I see:
– one paragraph from Kevin,
– half a page post from Jim Hunt (most of it a quote from a source)
– 8? screenfulls from doomer troll(s) “William”/”Pedro Prieto”
That’s a known paid-troll/bot technique – downgrading forums that are not conductive to the interests of the troll/bot owners – by saturating such forums with its own troll/bot drivel, and thus drowning the discussions on topics they want to suppress. A version of the “denial of service” hacker attack.
In Re to Piotr, 1 Jun 2025 at 11:20 AM,
https://www.realclimate.org/index.php/archives/2025/05/predicted-arctic-sea-ice-trends-over-time/#comment-834024
Hallo Piotr,
Let me, first, shortly return to your last May post of 31 May 2025 at 11:09 PM,
https://www.realclimate.org/index.php/archives/2025/05/unforced-variations-may-2025/comment-page-2/#comment-834009
I agree almost fully to your points, except your opinion that it is necessary to (directly) engage the trolls. Herein I rather tend to agree with Ms. Anderson who thinks that it may rather amplify their influence and in certain sense, endorse their presence on the website.
It appears that various suspicious subjects share a common love to activities of Russian government. In the past, I tried several times to ask them if they know that Russia strives to subjugate a neighbour nation in an unprovoked aggressive war. They have never admitted any fault, and eventually disappeared from the website. I therefore see thse repeating attempts of their successors under various names as a strong hint that this website indeed faces a systematic organized attack.
I decided to avoid further attempts to interact with such subjects directly, and since then restrict myself only on a warning to others that there was a further shameful attempt to switch Real Climate into another platform for Russian hybrid war. I supopose that any such attempt can be seen as sufficient evidence that the respective subject has a zero credibility and does not come in a good will.
Although this approach has not found followers yet, I still hope that putting such subjects spreading the “Russian mir” infection into a “quarantine” could represent a more effective response than speaking with them gently or shouting on them loudly.
Greetings
Tomáš
P.S.
In the flood of contributions from entities that we both suspect to be professional troll(s), you might have missed my post 27 May 2025 at 5:51 PM,
https://www.realclimate.org/index.php/archives/2025/05/unforced-variations-may-2025/comment-page-2/#comment-833799
wherein I tried to explain why I have not understood yet why you so strictly refuse the idea of the proposed modelling experiment, with the aim to resolve the question if climate sensitivity may or may not depend on water availability for evaporation from the land.
If so, could you do me the favour and, as the May thread is already closed, reply herein?
Many thanks in advance!
Tomas Kalisz “I agree almost fully to your points, except your opinion that it is necessary to (directly) engage the trolls. Herein I rather tend to agree with Ms. Anderson who thinks that it may rather amplify their influence. ”
I said nothing about engaging the trolls – I simply questioned Susan Anderson’s saying that we shouldn’t indicate their multiple identities, because there are “many, many” separate people who could have such views. To which I indicated that using multiple handles is critical to the success of trolls. And in fact, recognizing that we are dealing with the same troll/bot posting under various names – REDUCES the temptation to engage them, created by the Susuan presumption that these are new people coming to discuss and therefore deserve the benefit of doubt – i.e., engaging with them. And I suggested applying Occam’s razor to the entity in question (“Thesallonia”).
My engagement with known multiname trolls is rather limited – I ignore most of their posts and comments, replying:
– when they repeat the denier/doomer fallacies to which lay people may be vulnerable
– to write not TO them, but ABOUT them (their troll tricks and motivation)
– when their posts provide entertainment value – not to look far – “Pedro Prieto” defended and complimented Ken the Denier for the argument … Ken T. didn’t make, In fact, in parallel post Ken implied the OPPOSITE. And the icing on the cake – among people who DID write what Ken didn’t – was “the Prieto Principle ” the same one who called troll “Pedro Prieto” – an imposter.
More vacuous nonsense from the boring boor and his tag-team element. A real textbook example of the “forum denial-of-service” troll strategy: flood, derail, and drown. The goal isn’t debate — it’s exhaustion.
PP: A real textbook example of the “forum denial-of-service” troll strategy: flood, derail, and drown. The goal isn’t debate — it’s exhaustion.
BPL: Thank you for admitting that. The first step to change is acknowledging that you have a problem.
Ken Towe: “ Surely, you are aware of the fact that rapid reductions in CO2 emissions will take none of the CO2 already added (420 ppm) out of the atmosphere
Surely, you are aware of the fact that I have taken apart the same argument when you were making it two weeks before. Let me refresh your memory:
=====
Ken Towe 17 May: “GHG reductions, reducing emissions, will take none of the CO2 already added out of the atmosphere”
Piotr 18 May: “First – if large enough – they WILL result in the taking down CO2 already in the atmosphere – as natural uptake will no longer be overpowered by the new human emissions – currently only half of the emitted CO2 stays in the air the reset is absorbed by the natural sinks.
Second – yours is a typical denier/doomer all-or-nothing argument – if we can’t reduce the current levels of CO2 then let’s do nothing and keep increasing atm. Co2. The obvious and fallacy here is that the world at 425ppm won’t be as hellish as the world at 850 ppm.
So you are like a man who stabs his neighbour with a knife, justifies his refusal to stem the bleeding by saying that it would be pointless, since “ it will not bring back any blood you already lost and therefore he plans to continue stabbing the victim until he is dead.
=== end of quote =====
To which, other than crying how the other posters are mean to you (you characterizing the above as “ personal insults” ;-)) – you had NO answer to the above FALSIFIABLE arguments.
Nor had your defender, as in his powerful intellect he understood the above as me …. having to admit that his Ken was right:
Multi-Troll (“Thesallonia”): “ Piotr acknowledged that CO₂ will decline slowly once emissions stop — which aligns with what Ken said.”
So unable to defend your claim in the original thread – you repeat it, hoping for a different outcome? You know the definition of what is this? ;-)
I have to repeat it, defend it because you don’t seem to understand, unwilling to comprehend? We cannot currently move forward with anything of consequence without using vehicles that run on fossil fuels. EVs are in the future. .We can’t grow agriculture, feed people. Plant trees. We can’t travel across large distances. And we certainly can’t install massive renewables…solar and wind farm projects, We can’t even build charging stations for EVs. So, that must mean more oil will be needed and used. We can’t just stop emissions. Natural uptake? That is limited by the carbon cycle, The oxygen created is used by aerobic respiration to recycle biomass CO2 back into the atmosphere from dead algae and trees…plants.
Get it now.?