Statements often appear in the media about suggesting that more extreme mid-latitude storms will result from global warming. For instance, western Norway was recently battered by an unusually strong storm which triggered many such speculations. But scientific papers on how global warming may affect the mid-latitude storms give a more mixed picture. In a recent paper by Bengtsson & Hodges (2006), simulations with the ECHAM5 Global Climate Model (GCM) were analysed, but they found no increase in the number of mid-latitude storms world-wide. Another study by Leckebusch et al. (2006) showed that the projection of storm characteristics was model-dependent. (Note that the dynamics of tropical and mid-latitude (often called ‘extra-tropical’) storms involve different processes, and tropical storms have been discussed in previous posts here on RC: here, here, here, and here).
The factors that control this are often confounding and so make this a tricky prediction. Simple arguments based on the expected ‘polar amplification‘ and the fact that the surface temperature gradient between the tropics and the poles will likely decrease would reduce the scope for ‘baroclinic instability’ (the main generator of mid-latitudes storms). However, there are also increases in the upper troposphere/lower stratospheric gradients (due to the stratosphere cooling and the troposphere warming) and that has been shown to lead to increases in wind speeds at the surface. And finally, although latent heat release (from condensing water vapour) is not a fundamental driver of mid-latitude storms, it does play a role and that is likely to increase the intensity of the storms since there is generally more water vapour available in warmer world. It should also be clear that for any one locality, a shift in the storm tracks (associated with phenomena like the NAO or the sea ice edge) will often be more of an issue than the overall change in storm statistics.
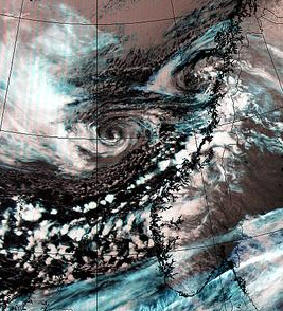 I believe that the jury is still out on the extra-tropical storm issue because the climate models are still limited in their ability to represent them adequately. For instance, wind speeds are not well captured by the models (Leckebusch et al., 2006), and modelled key characteristics of the cyclones were sensitive to the models’ spatial resolution: Work by Jung et al. (also published in Quart. J. R. Met. Soc. (2006), vol 132, p. 1839-1857) suggested that several key characteristics of extra-tropical cyclones in the global ECMWF numerical weather model are highly sensitive to the horizontal resolution. This is also acknowledged in a recent paper by Wernli & Schwierz (2006; J. Atm. Sci., vol 63, p. 2486). However, for some regions, Jung et al. noted that model problems were insensitive to the horizontal resolution employed in their model experiments. Ulbrich (EMS/ECAC06) also found a dependency of the storm statistics in re-analysis with different spatial resolution (the picture from GCMs was similar to the re-analysis, provided the re-analysis was carried out with similar spatial resolution). It was also concluded that the different models analysed gave a similar large-scale picture of how extra-tropical storms respond to a global warming: the frequency of weak storms decline and the strong storms are projected to become more frequent. The sensitivity to resolution is understandable, because while an entire storm system can be very well resolved (they can be 1000 miles across), there are very sharp features at the fronts (the comma shaped clouds) which are a challenge even for weather forecast models to get right. Secondary ‘cyclogenesis’ (where a new storm is ‘spun off’ from an existing storm) is also something that improves markedly as resolution increases.
One can try and address that by using a high-resolution regional climate model (RCM), forced by simulations from a coarser GCM at its boundaries (a process called ‘nesting’). The RCMs provide a similar description of the minimum sea level pressure (SLP – a parameter related to wind storms and the cyclone depth) as the GCMs, irrespective of their spatial resolution (The KNMI scenarios 06 Fig. 6-3). RCMs, however, are not completely free to do their own thing, but must follow the GCMs, at least on the larger scales. So should we really expect an RCM to produce a different storm climate? What implications would a substantially different cyclone climate in the RCM have for the larger-scales and the energy transport? Cyclones play an important role in the poleward energy in the mid-latitudes (‘eddy-transport’), which ultimately has a bearing for the large-scale circulation. Since cyclones involve significant parts of the hydrological cycle, such as evaporation, moisture transport, condensation and precipitation, a different cyclone climate in an RCM and GCM would presumably present inconsistencies for the water budget. Furthermore, a paper by Peng et al. (2006) suggests that eddy forcing may be responsble for large-scale response to changes in the sea surface temperatures. In other words, the cyclone climate affects the large-scale circulation, and a widely different behaviour in the RCM and the GCM would imply an inconsistency.
One robust result among most GCMs is a poleward shift in the position of the storm tracks (Bengtsson & Hodges , 2006; Yin ,2006). It is important to keep in mind that for the local communities concerned, it is changes in the position of the storm tracks that is most important, rather than the global number of storms. Another robust result is that the NAO in the models tends to shift more towards its positive phase (stronger westerly winds) as greenhouse gases rise, tending to increase winter storms coming ashore in Northern Europe, and decrease them around the Mediterranean (Miller et al, 2006).
A conceptual picture of processes affecting mid-latitude is: One, that latitudinal variations in the temperature and air flow give rise to ‘baroclinic instability’; Second, the humidity of the air also plays a role as the latter influences the energy budget. An analogy for the two can be a sloping surface: the former is the how steep the slope is and the latter the height of the drop. Sharp spatial temperature contrasts and horizontal wind shear favour an unstable growth of the storm system.
As we mentioned above, global warming generally implies a ‘polar amplification’ (stronger warming near the North Pole), and so the average poleward temperature gradient is expected to diminish, leading to less unstable conditions on average. On the other hand, a warmer Arctic may imply less sea-ice and a greater heat loss to space, which must be balanced by heat transport from the lower latitudes, a poleward heat transport which may involve the mid-latitude storms (ice insulates the ocean from the atmosphere and keeps the temperatures down). Increased temperatures also implies higher humidity, and thus a higher capacity for energy conversion through condensation – the energy fuel of convection. So it isn’t a simple picture and one should be wary of simple statements on the topic.
2006 Pacific typhoon season First storm formed: May 9, 2006 Last storm dissipated: December 19, 2006 Strongest storm: Yagi and Cimaron – 910 hPa (mbar), 195 km/h (120 mph) Total storms: 23 official plus 2 unofficial Typhoons: 15 Super Typhoons: 7 (unofficial) Total fatalities: At least 2,532 Total damage: Unknown
Id like to add:
2006 Pacific typhoon season wiki
http://en.wikipedia.org/wiki/2006_Pacific_Typhoon_Season
http://en.wikipedia.org/wiki/Hurricane_Ioke
Oh and the overall weather forcast this year …
World faces hottest year ever, as El Niño combines with global warming
World faces hottest year ever, as El Ni�±o combines with global warming
http://news.independent.co.uk/environment/article2116873.ece
RE: 52/53
Hey Sunburst;
Actually, it appears the El Nino event is breaking up in the ITCZ as we type. It appears to have broken down into eddies or pools of warmer temperatures and may be in the process of dissipating. (Note: That at the same time there is clear evidence of continued strong El Nino like weather patterns. This appears to drive the question set, is it the weather that drives El Nino or El Nino that drives the weather? Too bad we are do not seem able to define what drives the large scope weather patterns or oscillations yet.)
Dave Cooke
Do you got a link and did something similar happend in the past?
Are these fluctuations?
How looked 1998 in compare?
Sorry, for all this questions which come in mind, and thanks to share live science.
[Response: That kind of simplistic Popperism only works for idealized ‘clean’ situations where the issue is black or white, right or wrong. That just isn’t applicable to the real world where the issue is much more nuanced – how right? what is the tolerance for error? does a new feature reduce the error or not? Therefore models (in the generic sense) are supposed to increasingly match observations as they get closer to the underlying ‘truth’.
In reply to ‘Response’
Is it now evident that there is a crisis in the standard models? Is there an expected paradigm shift in the models as opposed to a need for model tuning? Kuhn rather than Popper?
In the case of this puzzle (Forecasting and explaining past changes to the macroclimate/the glacial/interglacial cycle), the standard models are obviously missing key fundament components of the physical processes.
From Broecker’s famous Angry Beast article (see attached link for details) in which he discussions macroclimate models and extreme climate changes:
http://www.soest.hawaii.edu/GG/FACULTY/POPP/Broecker%201999%20GSA%20Today.pdf
‘Models to the Rescue?’
“…No one understands what is required to cool Greenland by 16C and the tropics by 4 +/-1C, to lower the mountain snowlines by 900m, to create an ice sheet covering much of North America, to reduce CO2 by 30%, or to raise the dust rain by an order of magnitude. If these changes were not documented in the climate record, they would never have entered the minds of the climate dynamics community.
Models that purportedly simulate glacial climates do so only because key boundary conditions are prescribed (the size and elevation of ice sheets, sea ice extent, sea surface temperature, CO2 content, etc;)”
Comments:
1) In the Angry Beast article Broecker postulates that the Younger Dryas was caused by a fresh water pulse, from Lake Agassiz. Subsequent data has shown that the fresh water pulse hypothesis is likely not correct. See attached paper below for the data and another hypothesis.
2) An alternative hypothesis to Broecker’s non-linear knife edge hypothesis (Small natural or anthropogenic changes can force the macroclimate from one mode to another mode and hence create the massive ice sheets and so forth.) is the hypothesis there is a massive semi-periodic external forcing, that forces the macroclimate from one mode to another. (P.S. The massive natural external forcing function is not the THC.)
Link: Reduced solar activity as a trigger for the start of the Younger Dryas?
http://scholar.google.com/url?sa=U&q=http://dept.kent.edu/geography/GEC/Reduced_solar_activity_as_a_trig.pdf
[Response:A few thoughts regarding ‘Is it now evident that there is a crisis in the standard models? Is there an expected paradigm shift in the models as opposed to a need for model tuning? Kuhn rather than Popper?‘. Since models are never (at least very rarely) perfect as they mimick only the essential features of whatever they represent, one may always find a point beyond which they are no longer valid – i.e. beyond their limitations. To name a couple of silly examples to illustrate this, the climate models cannot tell us much about the single air molecules in a given region or whether a stroke of ligthening will hit a particular house. This does not mean that the model is falsified, eventhough one may argue that both may have some effect (albeit miniscule) on the atmosphere. I think therefore one has to define for which limits model is valid, before you can validate them in earnest and call for Popper. GCMs with a ~1-degree resolution and cloud parameterisation were surely not designed to investigate stormsin details (as they were not deigned to study molecules or lightening), although it’s reassuring that they without any fingering do produce storm-like featuresselves by them selves (this cannot be said about the molecule or lightning), although not as perfect as we would like them. But since storms play a role in the larger picture, it is important that they are represented in a realistic fashion statistically, e.g. through a mix of sub-grid parameterisation and grid-resolved numerics (as the molecules are). There have been numerous studies with numerical atmospheric models, may of which bear close resemblance ot operational numerical weather forecasting. Their continual use and important contribution to everyday life, suggest that these models in general give useful prognoses. -rasmus]
Re #56
William, any comment about this as an alternate explanation for Younger Dryas?
http://ams.allenpress.com/archive/1520-0442/14/11/pdf/i1520-0442-14-11-2369.pdf
RE: 54
Hey Sunburst:
Here are a few of the links that I have found useful. For me the beginning of my search began in relation to a story from NASA over 8 years ago, where the EOS/MODIS packages seemed to indicate a lower upper altitude temperature and less CO2 then theory at the time supported. It was then theorized that the CO2 was preventing the warmth from the surface from reaching the upper troposhere. Last spring it was announced that the cooling there was false and the issue was related to the variation in the satellite altitude versus atmospheric altitude. Now it appears that the CDIAC suggests that the cooling in the 250mb range appears to be valid.
Given this flux in the data and our lack of understanding we seem to have in regards to data there is a good reason to check your sources. This is a good reason that most of the following references are related to government or educational institutes as they usually are the source of the data most sites use in their data analysis. Generally, the data I am referencing here has been filtered for layman consumption, if you have any issues there are plenty of folks either here or on the various sites that are more then willing to assist you. Good Luck in your research.
http://www.ncdc.noaa.gov/oa/ncdc.html
http://lwf.ncdc.noaa.gov/oa/climate/research/sst/2006weekly-sst.html#top
http://tao.noaa.gov/tao/jsdisplay/sel_time_series_ndbc.shtml
http://www.pmel.noaa.gov/pirata/display.html
http://modis.gsfc.nasa.gov/index.php
Dave Cooke
Have a look at the more recent articles citing the kent.edu piece, which is rather old now. This for example (can’t put in a link to it)
Milankovitch climate reinforcements — Global and Planetary Change, Volume 40, Issues 1-2, January 2004, Pages 27-48
Thanks for the suggested sources, also usefull to me is the debate over here http://www.wunderground.com/blog/JeffMasters/comment.html?entrynum=605&tstamp=200612
Re #54 and unsubstantiated claims about “El Nino breaking up in the ITCZ”, here’s the actual forecast from the NOAA Climate Prediction Center on the current state of affairs in the Pacific:
“Synopsis: El Niño conditions are likely to continue through May 2007. Equatorial Pacific SST anomalies greater than +1ºC were observed in most of the equatorial Pacific between 170ºE and the South American coast (Fig. 1). The latest SST departures in the Niño regions are between 1.1ºC and 1.3ºC, except for Niño 1+2 (Fig. 2). The increase in SST anomalies during the last several months has been accompanied by weaker-than-average low-level equatorial easterly winds across most of the equatorial Pacific and negative values of the Southern Oscillation Index (SOI). Collectively, these oceanic and atmospheric anomalies are consistent with the early stages of El Niño in the tropical Pacific.”
http://www.cpc.noaa.gov/products/analysis_monitoring/enso_advisory/
The World Meteorological Organization agrees with this prediction:
“The WMO said its latest readings showed that a “moderate” El Niño, with sea temperatures 1.5C above average, was taking place which, in the worst case scenario, could develop into an extreme weather pattern lasting up to 18 months, as in 1997-98. The UN agency noted that the weather pattern was already having “early and intense” effects, including drought in Australia and dramatically warm seas in the Indian Ocean, which could affect the monsoons. It warned the El Niño could also bring extreme rainfall to parts of east Africa which were last year hit by a cycle of drought and floods.”
http://www.cpc.noaa.gov/products/analysis_monitoring/enso_advisory/
For those interested in what the El Nino/Southern Oscillation is and what effects can be expected, the Goddard Space Center has a very nice animation page showing temperatures and flows for the 1997-1998 El Nino: http://svs.gsfc.nasa.gov/vis/a000000/a000500/a000552/index.html
Hey Ike;
Now you know I would not claim something unless the proof was available, regardless of the forecast, the physical evidence points to a different picture IMHO. Feel free to take a look for yourself:
http://lwf.ncdc.noaa.gov/oa/climate/research/sst/ani-weekly.html
BTW Ike, there is also data available if you go to the:
http://tao.noaa.gov/tao/jsdisplay/sel_time_series_ndbc.shtml
site that demonstrates that the heat content in the upper 40 meters is dissapating along with a gradient rise in the 20 Deg. C Isoterm level.
Again the best forecast is a 50-50 proposition in most cases. In the case in which you have trimodal indicators it looks to be a 33-33-33 proposition at best. No one said this is a science yet; much of the good work here is still an art.
Dave Cooke
I report. You decide.
I suppose this fits here, since the subject of snowstorms was the basis for the TV segment.
I ordinarily don’t watch the Fox or as some call it Faux News Channel, but since my TV is old enough to be in graduate school, I have recently been forced to channel surf as the sound abruptly cuts out on MSNBC and CNN among others.
So, today, while watching the wrap up of the funeral for former President Ford, I wound up on Fox. Neil Cavuto had as two of his guests a man representing some kind of business association and that scion of science frequently referenced here, Dr. Patrick Michaels, today listed as affiliated as a fellow of the Cato Institute (these are the people who believe that the government that doesn’t govern at all governs best–I think that’s called anarchy).
Anyway, Cavuto put forth the hypothetical that the liberal media being mostly in the northeast, have fixated on the unusually warm weather there the last few weeks as evidence of global warming for sure, while ignoring the two massive blizzards that have buried the Denver area.
Michaels and business boy both agreed that the media, especially the NY Times (recently “broadly” criticized here, I recall) and CBS, seize upon weather events that support AGW, but ignore ones that don’t, e.g., the blizzards.
A graphic was posted showing some headlines from the Old Gray Lady over the last 80 years that said we were experiencing record warmth or cold and that a new ice age was coming or global warming.
In other words, extrapolating recent weather events to support some kind of disaster scenario that requires the government to act, obviously in violation of Cato Rule No. 1.
Michaels said that there actually hasn’t been warming in the NE U.S. as would be predicted by the AGW proponents and that in general, the warming of the first part of the past century is due to increased solar activity.
But here’s the good part people. It isn’t just the fearmongers at the Times the fair and balanced folks want you to be wary of. The real problem is that AGW propagandist Al Gore.
According to Michaels, Gore takes the fact that most scientists agree that there is some AGW and extrapolates that to mean that most also subscribe to a gloom and doom scenario when there are actually only a few. Michaels also said that the gloomster researchers also only report the results that support their end of the world theories.
Neil seemed relieved to know that Dr. Pat was out there, along with a handful of others, ready to set the record straight, no matter how many Weekly World News-like headlines the Times and CBS throw up.
Thank goodness all those government workers and researchers and the school children were home today so they could get straightened out on this very important issue. I suppose the next step for Dr. Pat and Cato is a public burning of DVDs (will DVD’s burn?) of An Inconvenient Truth.
I have a question that someone here will probably know the answer to about the co2-warming relationship being logarithmic. I was thinking today about the rule of thumb that doubling of co2 from any level causes a constant warming (~3C I think it is). I know there is an extreme upper level where weaker saturation bands come into play and this rule of thumb breaks down. But I realised there must be a lower level where it breaks down too. Otherwise there are an infinite number of doublings preceeding preindustrial level:
280-560 = 3C warming
140-280 = 3C warming
70-140 = 3C warming
35-70 = 3C warming
18-35 = 3C warming
9-18 = 3C warming
etc = to infinity..or..where does it stop?
So I was wondering if the relationship at the lower end isn’t really logarithmic at all. Is there a proper diagram of the relationship somewhere rather than the logarithmic curve that I have in my head?
When talking about the ” polar amplification”, it is important to keep the vertical asymmetry in the meridional difference in the warming trend in mind. For the surface temperature, polar warming is ususally larger than tropoical warming. But this does not mean the decrease in poleward heat tranport because of the reduction in tropics-pole temperature gradient. In the trosphere, the atmospheric warming in tropics is usually larger than the warming in polar area in most of the climate simulations for doubling CO2, so there is in fact increase in the tropics-pole atmospheric temperature gradient which could enhance the poleward heat transport. Even the poleward sensible heat transport is reduced, the poleward latent heat transport must be increasing so the changes in mid-latitude storms is inevitable. Cai(2006),(Climate Dynamics,Vol 26, 661-675) proposes such a dynamic feedback an important factor responsible for the spatial heterogeneity of atmosphere and surface warming.
Re #64
My first guess is that starting with no greenhouse gasses, the greenhouse effect would increase linearly with the first additions, and then start to become more logarithmic. (Of course, that’s without some of the very nonlinear feedbacks one would encounter, such as the transistion into/out of a Snowball Earth state.)
But I would also enjoy knowing this in more detail.
I pretty much laid out all I know or could deduce on atmospheric radiation in the comments at:
http://blog.sciam.com/index.php?title=liveblog_james_hansen_can_we_still_avoid&more=1&c=1&tb=1&pb=1
(start at the comment on November 25, 2006 23:23). Caution – I’m not an expert, and I got very very long winded and I didn’t plan ahead much organization of the subsections.
as long as I’m here again:
obviously when I wrote in #50 that decreasing meridional temp gradient would lead to decreased east-west temp variation (in SSTs, I meant) unless ocean surface gyres strengthened, I was not accounting for upwelling, which in some cases could enhance temperature variations in an otherwise warmer world (such as around Antarctica, where there could be a positive feedback between the winds driving the upwelling and the temperature gradient driving the winds). Also, when I mentioned decreased cyclogenesis around the east coasts of Asia and North America, I was thinking of winter.
There is also a likely Hadley cell reconfiguration. Theoretically, there should be a semi permanent High pressure close to the North Pole, completely in sync with the Arctic Ocean Gyre, expelling Ice to the North Atlantic, sort of keeping a balance of permanent Ice. However I have noticed very often low pressure systems at the North Pole, this in itself does the opposite, keeps old ice from escaping the Arctic Ocean, a counter balance for the present warmer days. But having more peristent low pressure systems near the Pole causes a complete change over from the normal Hadley setting, ulimately having an effect on the Ferrel mid latitude cell, a change in location or a readjustment a bit more complex than the standard 3 cell model from equator to Pole, causing a significant change of weather at the mid latitudes as well.
In response to the comment: ‘Since models are never (at least very rarely) perfect as they mimic only the essential features of whatever they represent, one may always find a point beyond which they are no longer valid – i.e. beyond their limitations.’
Is there a Crisis with the Climate Models? Any facts to support an alleged crisis?
What is a crisis in a field of science?
There are problems with the foundation of macro climatology. The current status of the field is analogous to geology during the period when the tectonic plate hypothesis was being developed. Fundamental concepts that are part of the macro climatology canon appear to be false, based on recent data and analysis. Rather than addressing these newly identified problems as an opportunity for a breakthrough, the perfectly nature and common reaction is to attempt to modify and tune the models to explain the data, with no changes to the canon, or to just ignore the conflicting data.
[Response:Sorry, but this analogy is not clear, and what you write is your (hand waving) view, but constitutes no convincing evidence. -rasmus]
Facts and work by others that supports the alleged statement, ‘Macro climatology is in a crisis’.
1) Richard Muller and Gordon MacDonald’s finding that glacial cycles follow a 100-kyr cycle which matches a 100 kyr cycle in the earth’s orbital inclination, not eccentricity. See attached link to their 1997 paper for details. (P.S. Cause of warming has nothing to do with interstellar dust. No surprise in the abanding of eccentricity as everyone knows, the insolation changes associated with eccentricity could not have possibly have caused the end of the glacial cycle.)
Link to Muller et al’s paper.
http://muller.lbl.gov/papers/NAS.pdf
[Response:I’m not following you – what is your definition of ‘macro climatology‘ , and how do you take Muller et al’s paper paper to be an evidence for the falsification of the climate models? -rasmus]
2) Based on finding 1) next question is how could orbital inclination possibly affect the earth’s climate. (Something is required to cause the massive warming that ends the glacial cycle. Important, as without the warming the earth stays in the glacial state.)
3) Yamazaki et al. find a 100 kyr and a 41 kyr cycle in the magnitude of geomagnetic field in the proxy record. http://scholar.google.com/url?sa=U&q=http://sciencemag.org/cgi/content/abstract/295/5564/2435
4) Next two questions. A) How could changes in the geomagnetic field possibly affect the macroclimate? B) What could possibly be causing the changes to geomagnetic field? (P.S. It appears based on work by others, that the earth’s inclination can change 6 degrees per day. That finding is a real surprise! Need a side trip to check the geomagnetic models/cannon and the data that supports an alleged rapid change. The speed and cause of the geomagnetic field change might be important, if we were concerned about rapid climate changes.)
Answer to 4 A) question is modulation of GCR, see this link to Kirby, Mangini, and Richard Muller’s 2004 paper, for an outline of the basic hypothesis and supporting data.
Link to Kirby et al’s paper.
http://arxiv.org/pdf/physics/0407005
5) The devil is of course in A) the darn details of the GCR affects and of course we need B) proof the GCR phenomena is real.
Starting with 5 B), (See attached link to Palle et al.’s 2004 paper). See figure 2 and figure 3. As noted in the paper, there is very good correlation (significant at the 99.5% level) to low level cloud cover and GCR levels 1985 to 1995. Starting in 1993, the low level cloud cover starts to reduce at minus 0.065% per year. We should note that GCR/cloud level data (this observation) is at a time when the solar activity is at its highest level in 8000 years and the solar large scale magnetic field has doubled. That fact explains the minus 0.065% drop in low level clouds.
Link to Palle et al.’s paper
http://solar.njit.edu/preprints/palle1264.pdf
[Response:I don’t find these figures very convincing, as the curves are short, with only two cycles, and a host of other factors may affect the cloudiness. e.g. ENSO. I think the figures are interesting, but the jury is still out on that one. -rasmus]
Moving to 5A). See link to Brian Tinsley and Fangqun Yu’s attached paper. Palle et al’s paper notes the data supports the electroscavenging hypothesis, see Tinsley and Yu’s paper for details. The electroscavenging process is dependent on the magnitude of current movement ground to ionosphere. It is assumed the recent (1993) observed ‘Sprites’, where Sprites is the name of the massive charge discharge from ionosphere to cloud tops is being caused by the solar activity. (See attached link which discusses the increase and changes in solar activity.) It is assumed the change in solar activity (coronal holes) are causing the increase in the electroscavenging process.
Link to Tinsley and Yu’s paper.
http://www.utdallas.edu/physics/pdf/Atmos_060302.pdf
Link to paper, recent changes to the sun. (Read section 3. See figure 1 and figure 2.)
http://sait.oat.ts.astro.it/MSAIt760405/PDF/2005MmSAI..76..969G.pdf
[Response:I still have problems downloading this paper. Sorry! -rasmus]
Regarding the El Nino question: given the timescales of the El Nino phenomenon (which is still poorly understood, as are all the other multidecadal oscillations, of which El Nino is by far the most studied) we are certainly due for another one. One effect of El Nino is a greater then usual transfer of heat from the tropics to the mid-latitude regions, so El Nino may be a tropical mechanism of ‘letting off steam’ brought on by a slow buildup of thermal energy in the equatorial surface ocean, which periodically lets off a pulse of energy – just a guess.
The datasets that L. David Cooke (#62) links to actually show a warming ocean consistent with the onset of an El Nino pattern. Note also that the ‘baseline period’ for the ‘anomaly’ is 1971-2000 – which seems like a pretty bizarre baseline considering that global warming has been going on for decades now. I wonder what the anomaly would look like if the period 1965-1975 (or 1975-1985) was used as the baseline? – I imagine it would be quite a bit higher. It seems to me like someone is fudging the numbers to make the anomaly come out lower then it should be.
The real question of interest is this: what effect will global warming have on the El Nino / Southern Oscillation? Will you see more frequent El Ninos or less frequent El Ninos or no change at all? One thing is clear: we should expect to see equatorial temperatures continue to rise (as evidenced by the melting of the Andean glaciers, Kilimanjaro snowfields, and Mexican volcanos) which means that equatorial ocean temperatures, i.e ocean heat content will also continue to rise. About half of expected sea level increase is expected to be due to the thermal expansion of water as it warms; the other half is from melting land-based glaciers.
I prefer to discuss observations rather then models for the simple reason that it’s a lot harder to question the actual data (though the denialists will certainly try). The models provide a theoretical basis for understanding how the oceans and atmosphere behave, and are critically important because they produce testable predictions (such as the prediction that polar regions and high altitude regions would be the first to show the effects of global warming), but without good data (for example, Lonnie Thompson et al’s high altitude glaciar core data) no tests are possible.
One other point (RE #67) the 3-cell Hadley model is what you get when you imagine that the Earth has no continental landmasses – it’s a conceptual model only. The real Hadley circulation is far more complex and is heavily influenced by the landmasses, though you still see the desert belts due to the dry descending air. What global warming has done (another model prediction that has come out correct) is put more water moisture in the atmosphere, meaning that the heat capacity of the atmosphere has increased- meaning that more heat will be transported to the Greenland, Arctic and Antarctic regions – meaning more and more rapid melting of the ice sheets as we transition into a climate regime the Earth hasn’t seen in some 3.3 million years… at least. How will the increased moisture in the atmosphere affect the Hadley circulation? Will we see monsoons and unprecedented flooding in mid-latitude regions?
Even if in the long run the Arctic is fairly warm, it seems quite likely that Arctic winters will continue to produce cold dry air masses in the near-term period that will generate intense storms as they encounter warm wet air from the tropics – but who knows where these storms will occur? They’ll probably be much less damaging then the hurricanes, at least.
As a matter of pure scientific observation, it is now January 3, 2007 and central Maine USA has not yet had any winter.
Re “So I was wondering if the relationship at the lower end isn’t really logarithmic at all. Is there a proper diagram of the relationship somewhere rather than the logarithmic curve that I have in my head?”
You have it right. The logarithmic relation only holds for a few orders of magnitude. It doesn’t raise the world’s temperature 3 K to go from one CO2 molecule in the atmosphere to two.
Re 68: In Southern Finland we had two weeks of snow in the beginning of November. E.g. In Helsinki December was 6,2C warmer than the average between 1971-2000. The Finnish Meteorological Institute has given the reason for the record warmness warm wet air coming from the Atlantic.
Related to the topic of this thread, it looks like the energy stored into the ocean is now released through these lows and storms to the northern parts of Europe and eastern America. However, the temperatures are now so high, that somewhere in Northern hemisphere extremely cold conditions must prevail. Does anyone know where?
Re: #5
All models are wrong, but some are useful.
As someone who spent most of the professional life developing “wrong” models I have to comment on this.
You are right but there’s more to the story. Crude models are usually useful for qualitative understanding of the physics involved rather than for quantitative prediction purposes. The better (more detailed) the model the better the chance (usually, but see below) for a more accurate prediction. Conversely, “better” models are more difficult to use if you want to explain something, simply because there are too many interacting mechanisms involved. In climate modeling there is even an expression “kitchen sink model”. This means – throw everything in and see what happens.
There is a famous – and very relevant – exception to the rule. Cane-Zebiak El-Nino model is bare-bones simple yet it is used for prediction. What is curious is that “better” models (GCMs, the very same kind that are used for long term climate forecast) do not show any improvement (in fact, it’s the other way, I believe) in forecast accuracy over C-Z model, at least that was the case until recently. What do you make of this? Indeed, some models are useful. Moreover, some models are a lot more useful than others.
Alistair points out (and I agree) that the climate models are “too wrong” to be used for meaningful prediction. You can argue against it intelligently, as Rasmus did in comment to #56, but it is disingeneous to dismiss it with one sentence brush-off.
Wally Broecker (William – thanks for the link) makes a lot broader point about models inadequacy, similar in spirit to what I was trying to say in a couple of previous threads, but a lot better substantiated, of course. For some reason, the modeling community is not arguing with him. Guess why.
See, you don’t need to be a denialist to mistrust the models.
[Response: Well this member of the modelling community often argues with Wally on this point – but not by claiming that models are perfect, but by demonstrating that they can be useful. I’ve mentioned this paper before I know, but LeGrande et al 2006 is a great example of a model doing a good job at putting disparate pieces of evidence into a constistent context, despite being imperfect. -gavin]
Re 68
Rasmus,
I have no difficulty downloading the paper using the Mozilla browser, so I have copied the abstract for anyone having problems here:
K. Georgieva, C. Bianchi and B. Kirov “Once again about global warming and solar activity” Mem. S.A.It. Vol. 76, 969
Abstract. Solar activity, together with human activity, is considered a possible factor for the global warming observed in the last century. However, in the last decades solar activity has remained more or less constant while surface air temperature has continued to increase, which is interpreted as an evidence that in this period human activity is the main factor for global warming.We show that the index commonly used for quantifying long-term changes in solar activity, the sunspot number, accounts for only one part of solar activity and using this index leads to the underestimation of the role of solar activity in the global warming in the recent decades. A more suitable index is the geomagnetic activity which reflects all solar activity, and it is highly correlated to global temperature variations in the whole period for which we have data.
HTH,
Cheers, Alastair.
[Response:Thanks, Alastair. -rasmus]
Some of the cold air has lingered around Alaska. Several record low readings noted.
http://climate.gi.alaska.edu/Summary/current_sum.html
Re above:
“It appears based on work by others, that the earth’s inclination can
change 6 degrees per day” — Astley
“I don’t find these figures very convincing” — Rasmus
Me neither. I can’t find any source for that notion — is that claim taken from Velikovsky? If it claims a change in the inclination of the magnetic axis, it moves not remotely that fast. In the inclination rotational axis of the planet, a six degree change would have been noticed — putting aircraft and satellites and bird migrations off course, changing sunrise and sunset timing, and causing the oceans to slop around dramatically.
Who is the source for the notion the planet’s inclination can change six degrees a day? Why do you find it believable?
I am fascinated with the following. The notion is, bi or multi modal “bands” (as in energy bands in quantum physics) within which the climate system can reside. It cannot be ruled out that modes may encompass degrees of meridionalty of jet stream tracks. One migh envisage modes ranging across a spectrum from the zonal extreme to a highly meridional extreme. Consider the interaction of a scheme such as this with the energy / heat content of the oceans or of the ocean-atmosphere system. This paradigm may also be of use when examining oscillation modes of SST patterns and of the overarching ocean – atmosphere system (e.g. ENSO, PDO, AMO, other yet to be understood ones). Just some food for thought when assessing the degree to which the Earth’s thermal state may or may not influence mid latitude storm strength and frequency of occurrence.
Re #64 and others: I happened to run across a site – http://edgcm.columbia.edu – that has a version of a climate model that you can run on your PC, at least if you’re unfortunate enough to be stuck in the Windoze world. So download the model, plug in your scenarios, and see what happens :-)
And re #68: ” It appears based on work by others, that the earth�s inclination can change 6 degrees per day. That finding is a real surprise!”
I’ll say! Would one of those others happen to be Veilikovsky?
Are there any models yet, taking released methane feedback in account while making global warming predictions?
http://news.independent.co.uk/environment/article2110651.ece
http://en.wikipedia.org/wiki/Clathrate_gun_hypothesis
http://www.nature.com/nature/journal/v443/n7107/abs/nature05040.html
https://www.realclimate.org/index.php/archives/2005/12/methane-hydrates-and-global-warming
http://news.bbc.co.uk/1/hi/sci/tech/6166011.stm
So we need to update the models and predictions. This also mean the ocean does not need to heat up in a long time process to release the sediment from the sea floor.
A brief note relevant to mid-latitude storms: Pat Michaels was interviewed on FOX news and he claimed that the Denver snowstorms mean that global warming isn’t really happening. Now, just as a thought exercise, will a moister atmosphere result in more or less snow in the interior United States in winter? Isn’t this region known for it’s cold dry winters (as skiers and snowboarders will tell you, Colorado is famous for dry powder, unlike California where the snow tends to be fairly wet).
One would have to look into the historical climate record for Denver, but as far as off-the-cuff explanations go, it seems fairly obvious that more water in the atmosphere could easily result in greater snowfall in continental interiors. Snowfall in Denver doesn’t mean global warming isn’t happening – but a lot more people are watching FOX news then are reading realclimate, unfortunately.
Some have pointed to this and have claimed that we should not expect Greenland glaciers to melt since snowfall may increase in their interiors – but it seems quite likely that the snow won’t stick around all year; it will instead melt due to the warming Arctic summers – perhaps lubricating the glaciers. Again, the data collection is critical – gravity mapping Greenland on a continual basis would help answer these questions.
Noticeably, the host of FOX news didn’t ask Michaels about melting tropical glaciers or El Nino.
[Response: I think you should expect more precipitation in general from higher T; but in some places what was snow will be rain. This also applies to Greenland: the interior should get more snow; the edges will melt more – William]
Re: #73 (comment)
Gavin,
I doubt Wally would ever dismiss the models on wholesale basis. Of course models can be useful. In the linked paper he just points out a few things that are currently well out of reach of any existing model. I don’t think there is any dispute about it, is there?
This may be a basis for the notion of rapid change in the geomagnetic field’s inclination. The momentary local measurements do vary. Here’s the inclination changing by about three quarters of one degree, and the declination changing by minus six degrees, briefly, today, in one spot. That’s not the global axis changing, it’s a local event.
http://www.spaceweather.gc.ca/common_apps/output_files/a3e85f5ba3a49228c35cc16610d34bedBLC2007Jan0300240dif_plot.png
RE: #79 – What is the state of Far Northern Asia right now? (i.e. degree of ground freezing, snow cover, average daily temperature, etc). Anyone have this sort of info handy?
Re #73
Sashka, you wrote ‘Alistair points out (and I agree) that the climate models are “too wrong” to be used for meaningful prediction. You can argue against it intelligently, as Rasmus did in comment to #56, but it is disingeneous to dismiss it with one sentence brush-off.’
Happy New Year and thanks for your support :-)
My point is not really that the models are too wrong for meaniful prediction, but rather that they are failing to make meaniful predictions about Mid Latitude Storms, because they are too wrong. In other words, their failure to consistently predict the change in storminess is evidence that the models are wrong. There is also their failure to account for the rapid warmings at the the start of the B-A inter-stadial, at the end of the Younger Dryas, D-O events, the surface temperature of Venus, the warm winter anomaly at the Martian poles, the length of the PETM, the runaway warming at the end of Snowball Earth, and the Faint Young Sun paradox.
Rasmus argued that the models had got some things right. That does not mean the models are correct. As Karl Popper explained, you cannot prove the models are correct, only that they are giving the right answer. If they give the wrong answer, then they are faulty. They are giving the wrong answers to the problems I listed.
Gavin also gives an example of where the models get the right answer as proof that they are correct, but if you read “Modelling an Abrupt Climate Change by Allegra LeGrande and Gavin Schmidt at http://www.giss.nasa.gov/research/briefs/legrande_01/ then they give the game away. They admit “By scaling the model’s response a little, we estimate that a reduction of about 50% in the MOC is the most consistent with the data.” Well done Allegra and Gavin! They have a model which can be made to fit with the data, but if the model is correct why does it not also reproduce the Younger Dryas? Popperism says no matter how well it fits the 8.2 ka event, if it does not fit the YD then it is faulty.
If the models are under-estimating the effects of increased carbon dioxide, and so the speed of melting the Arctic sea ice, then these models could be leading us to disaster rather than being what Coby calls useful.
In “Atmospheric Radiation” Goody & Yung writing about the source function for the Schwarzschild equation say ‘Since it is reasonable to suppose that emission is a property of matter alone, the source function … should continue to be the Planck function. This argument is fallacious, however, because, as first pointed out by Einstein, emission is also influenced by the incident radiation field (induced emission.)’ However, that argument itself is fallacious because Einstien was writing before the discovery of quantum mechanics. We now know that emission is not only influenced by the radiation field, but also by the mechanical effect of collisions from other molecules.
In short, this means that OLR (outgoing longwave radiation) depends on atmospheric pressure which only changes if the mass of the atmosphere changes, a very uncommon event. So there is no negative feedback on temperature due to an increase in OLR. It is the clouds that provide the negative feedback, but since they behave in a non linear fashion, we get abrupt climate changes.
Will my big idea be stolen? McLuhan wrote “Only puny secrets need protection. Big discoveries are protected by public incredulity.” I guess my idea is safe :-(
RE: 69
Hey Ike;
To an extent you are correct, there are indications of the pool migrating from west to east; however, the synoptic data in the last 30 days sems to indicate differently then the forecasts IMO, the pool of warmth to the west is diminishing or appears to be flowing towards about 140 Deg. W and 35 Deg. S. If you look at the change in the last 30 days the curves for the majority of the equatorial surface of the Pacific Heat Content appears to be recovering.
Along with this effect where there are clear increases of SSTs off the Coast of Africa near Madagascar and the rise in the open South Pacific mentioned above, interspaced between these events and continental areas there are clearly cooler SSTs developing.
Regardless of the time period of the baseline, to my understanding this happens to be the basis that NOAA applies to most of their forecasts in regards to El Nino/La Nino patterns. I will be interested in seeing what the data looks like in 30 more days. I certainly hope you and the current forecasts are wrong; however, I’ll try to keep an open mind.
Dave Cooke
Steve – Does this help?
http://pogoda.rbc.ru/eng/fullfoto.php?img_id=4
RE: 77
Hey Mr. Sadlov;
Though your modial idea was further developed then my original intent in my posting, I see now in retrospect that must be the characteristic I assign to the data I have been recording from the http://nomads.ncdc.noaa.gov:9091/ncep/charts I have been reviewing. There appear to be multiple modes in which there are characteristic dominance in the ITCZ of certain pressure patterns regardless the season. However, I do not suspect that the formation of the event in the ITCZ is the driving element, they are more likely a signal of an event in the polar latitudes. (One fellow on UKweatherworld suggested a magnetic anomaly and for the recent Australian phenomena, it seemed plausible.)
I can watch the 250mb region and see a zonal pattern develop then fade into a separate pattern and then finally back again over large scales of time. The interesting thing is also watching the NH Jet Stream deviations and the Relative Humidity (categorized by pressure zone and dominate pressure pattern), differences depending on which pattern seems to be strongest.
During the recent events in southern Australia, you could see one to three Anti-Cyclonic events and could follow them down to the 850 to 1000 mb range near the Melbourne – Sydney area. When I look at the current anomaly forming in the Central South Pacific and follow the pressure zones to the surface it appears similar. I have not documented enough observations yet. However, I am interested in tying these in with the atmospheric moisture content images from the Cloud Sat/Calipso Experimental packages in the same area. (Currently if you look at the region of 140 Deg. W and 38 Deg. S and boarding either side it reminds me of the movie in which there is a string of strong events, like swirling storms on Jupiter, that set up seasonally and slowly slide across the zone until the season changes and they finaly break down. Also interesting to watch is these patterns and the variation of the Jet Stream seem to switch Poles about every 2 years. Last year it was the NH and now the NH Jet is relatively elliptical while the SH is varying wildly. (Note: This is the first time in three years I have seen the effect appear seasonal.)
I think you may have the right of it though, repeatable patterns that are difficult to anticipate or have significant distribution of peak values might very well suggest many modes with the resultant appearing chaotic or “noisy”. I wonder if it might be possible to statistically extract the signals from the data streams.
[Response: There is a whole existing literature on this sort of thing. You might start with this review by Ghil et al (2002). -mike]
Kind of like when I was working with Bell Labs and we were discussing extraction via Fourier Transforms of signals from background microwave noise.
Dave Cooke
In reply to comment 78: “Who is the source for the notion the planet’s inclination can change six degrees a day? Why do you find it believable?”
The statement: “That a six degree a day change in the earth’s magnetic field.”, is believable, because it is confirmed by data. (Two different locations. Note the field change at the Oregon change occurred during the last glacial period.)
Link to Acton’s Near Instantaneous Geomagnetic Reversal Paper
http://scholar.google.com/url?sa=U&q=http://www.geo.edu.ro/~paleomag/PDF/00-180-225.pdf
New evidence for extraordinary rapid change of geomagnetic field during a reversal
http://scholar.google.com/url?sa=U&q=http://www.nature.com/nature/journal/v374/n6524/abs/374687a0.html
As to those who have concerns that this rapid change in the geomagnetic field is not possible if the source of geomagnetic field is the earth’s core, as it is physically impossible for a core change to have created the observed rapid field change, do not worry.
There are multiple, very basic, fundamental physics problems as to how the earth’s core could even possibly have generated the observed geomagnetic field (devil is again in the details, I can say more if you are interested). After 20 years of study, geophysicists agree that these basic fundamental problems have not been answered. Surprisingly, rather than continue to beat the same dead horse, someone has looked out of the box and has found another source for the geomagnetic field (The correct solution seems so obvious. It is hard to believe that 20 years has been spent working on geomagnetic computer models that have no basis in physical reality.)
Comments:
1) Interestingly, “Sprites”, the recent change in solar behavior, and rapid geomagnetic field changes appear to be linked.
2) Link to another paper that supports the finding of 100 kyr and 41 kyr periodicity in the geomagnetic field strength.
http://scholar.google.com/url?sa=U&q=http://www.dstu.univ-montp2.fr/LGHF/equip/gaillot/PDF/6_EPSL184.PDF
[Response: This is purely informational to other readers, and not a desire to discuss this. However, I would simply point out that even in the abstract of the above paper they state: ‘These results suggest that the orbital frequencies embedded in the paleointensity record are the expression of lithologic variations, and probably not a characteristic of the geodynamo itself.’ – To help you translate that, it means that climate is affecting the paleo-intensity (through changes in the composition of the sediment), not that the geomagnetic field is affecting climate. -gavin]
re: 84. “In other words, their failure to consistently predict the change in storminess is evidence that the models are wrong.”
Goodness, this is complete and utter nonsense. Perhaps you do not have an understanding of the purpose and use of various models. Models in all scientific fields are not perfection and no one claims they are. Prediction models provide strong guidance as to the likelihood of occuring events. For example, in one simple sense, Gausian models provide information about the likelihood that an event will occur based on the statistical distribution about the mean. If an event is not “at the mean”, the models are *not* “wrong”. However, over time with regard to repeated events, the models will be quite accurate. Furthermore, saying the “models are wrong” over and over in various posts does not make the statement any more correct.
Re: #84
Alastair,
My views are less radical than yours. I’m not bothered by the fact that any climate model can be falsified. This is a trivial and uninteresting statement. What bothers me is the scope of falsification and implications to how we weight the models results. To me, the models are way too “wrong” … but I’m beating a dead horse already.
Re: #33
The bigger the number cruncher the closer we get to the “truth” (or the shorter the time to find “truthiness”).
This is true if you are solving a traveling salesman problem but not true in application to chaotic dynamics. You can use all the computers in the world in parallel and it will not take you an inch closer to predicting weather 3 weeks from now.
We may never find a solution to the maths but the success of spacecraft vivdly demonstrates we can do without it.
A wrong analogy. Even a multi-body problem is a (usually) stable and easily computationally tractable.
re: 90. There is no “dead horse” or “falsification” unless you understand how scientific models work. Both in design, purpose, and testing through repetition and through rigorous (read the IPCC reports!) scientific peer-review.
Re #73 and the various El Nino discussions
The Cane-Zebiak El-Nino model is used in this paper
http://ams.allenpress.com/archive/1520-0442/14/11/pdf/i1520-0442-14-11-2369.pdf
to model abrupt climate change, specifically the Younger Dryas.
The authors note:
“The results presented here provide a quantitative demonstration
of how orbital forcing, which varies smoothly
over time, can provoke an abrupt climate response. Two
regimes of ENSO behavior are identified for different
orbital configurations in which the total power, period,
and regularity of the oscillation are distinct. When the
ENSO oscillation is in transition between the two regimes,
and is weak and moderately regular, the system
can lock to the period of the forcing… This behavior
recurs on an approximately 11-kyr timescale,
when perihelion occurs either during boreal winter or
summer.”
They further note:
“We note that the modern ENSO (zero forcing) is close to
the transition period during which abrupt ENSO shutdowns
can occur, suggesting that currently ENSO may
be fairly sensitive to external forcing.”
Re #64, #71,#78
Thanks, that all makes a bit more sense now, but im still not getting it yet.
https://www.realclimate.org/index.php?p=142 gives a figure for attribution of co2 to the total greenhouse effect (33C) somewhere between 12-25%, which is about 4-9C. Surely this constrains the maximum of climate sensitivity quite severely if a logarithmic relationship of a 4.5C rise per doubling co2 holds for even a small part of the co2 rise.
For example:
70-280ppm = 4.5C warming
140-280ppm = 4.5C warming (9C warming so far..whoops co2 accounts now accounts for all the greenhouse effect!)
I guess that I am missing something crucial (this is my bet) or the logarithmic relationship is only a generalization that holds for triple digit concentrations and before that doublings produce lower temp rises as was suggested.
I will try out this climate model #78 linked to, although im doubtful I will figure out how to use it for this question
[Response: If you compare the radiative forcing for a doubling of CO2 now is is around 4 W/m2. If you calculate the forcing removing all CO2, then it’s around 20 W/m2 i.e. around 5 times as much. If you actually run a model with this kind of change then temperatures drop enormously (due to the water vapour feedback) – though how much faith you would put in such a simulation is unclear. It is likely therefore that at small values the increase of forcing with CO2 is greater than logarithmic – and you could check that with a real line-by-line model. -gavin]
RE#85: “Regardless of the time period of the baseline (1971-2000), to my understanding this happens to be the basis that NOAA applies to most of their forecasts in regards to El Nino/La Nino patterns” – so what were they using prior to the record 1997-1998 El Nino year?
See http://www.bom.gov.au/climate/glossary/elnino/elnino.shtml ; here you will find definitions and explanations of the factors that play into El Nino, such as the Southern Oscillation Index, the Humboldt Current, and the Walker Circulation.
It may be possible that El Nino conditions are weakening, but not vanishing, according to Australian forecasters. Notice the use of clear and easily understandable language – they are trying to explain the situation, not to confuse it:
http://www.bom.gov.au/climate/enso/index.shtml
“Summary: El Niño maturing
Mature El Niño conditions continue to dominate the equatorial Pacific Ocean. Ocean surface temperatures have been steady over the past fortnight at somewhat more than 1°C above average right across the central and eastern equatorial regions, and cloud patterns generally show a classic El Niño structure. Computer model guidance continues to suggest that Pacific Ocean temperatures, and hence the El Niño, may peak around January or February 2007. This timing would be consistent with the breakdown of past El Niño events.
However, there are a few signs that the event may have already started to weaken: the SOI has only been weakly negative for more than a month; the Trade Winds in the western and central Pacific have strengthened to near-normal values in December; and sub-surface temperatures show a weakening of east-Pacific warmth and a strengthening cool signal extending from the west.”
This means that the El Nino may not be as strong as the record 97-98 one – but still present.
Regarding the use of models to predict El Nino, see the following site: http://www.bom.gov.au/climate/ahead/ENSO-summary.shtml Notice that about nine different models are being used, and they give neutral to warm conditions as forecasts. Similar approaches are used in short-term weather forecasts – but I don’t hear Alastair crying out about the failure of weather models… why not? Note in particular the difference in outputs between the UK Met Office model ( http://www.metoffice.gov.uk/research/seasonal/elnino/index.html ) and the NOAA model ( http://www.cpc.ncep.noaa.gov/products/people/wwang/cfs_fcst/images/nino3SSTMon.gif ). Remarkably different predictions!
Given all the political maneuvering at NOAA, as well as the attempts to silence senior scientists, as well as their peculiar choice of a ‘baseline’ (1971-2000) for calculating anomalies – I’d take their forecasts with a large grain of salt.
I’d like to see the climate denialists answer a simple question: do they think that record-breaking temperatures will continue to pop up all over the planet in the coming years, or not? More to the point, when do they expect to see this trend end, and on what grounds do they believe that? My prediction is that you won’t see an end to new record temps until atmospheric CO2 levels are stabilized – but that won’t happen until we replace fossil fuels with renewable energy systems.
Re #89 If the one model says that the storms in the North Atlantic are going to increase and another says they are going to reduce, then I think it is quite fair of me to say that some models are wrong.
If some models say that the the climate sensitivity is 1.5K and other models say that the climate sensitivity is 4.5K, and the rest say somewhere in between, only one value is correct. Only one out of those dozens of models is correct, and I am entitled to say the vast majority of models are wrong!
If they now clustered around 3.3K to 3.7K then I would accept them as correct, but they have remained with a variation of over 300% for 15 years. It seems to me obvious that there has been something wrong with the models for at least that time.
The climate models are not calculating a Gaussian distribution of climate sensitivity. They each calculate an exact value. Their results do not change as a result of random variation, as would happen in a Gausssian distribution, but due to the use of different sets of parameters eg. Gavin’s about 50%!?
I may be saying that the models are wrong as often as John Cleese said “This parrot IS dead!” in the Monty Python sketch, but that does not mean that he or me is not correct! It only means that … some things have to be said loud and often if they are going to be believed.
THE MODELS ARE WRONG!
Re #91
Dan (and others,)
You have to realise that just because an article is peer reviewed it is not neccessarily correct. There were plenty of articles opposing continetal drift before plate tectonics was accepted, and plenty of papers criticising the idea of an impact causing the dinosaur extinction before the Chicxulub crater was found.
The problem with climate models is that the Schwarzschild equation was introduced by Robert Emden for terrestrial radiation (it was desgned for solar radiation) before peer review was invented, but now we are stuck with it because it is “part of science.”
Planck’s function would not be used as the source function today now that we know about radiationless relaxation.
RE: #91 – Do *YOU* understand how the models work? By this, I mean, do you understand the algorithms, the mathmatical basis for the model elements, and, most significantly, the propagation of error terms? Do you truly understand all of this to a degree that would allow you to state some assessment of falsifiability?
RE: Comment in Regards to 87
Dr. Mann;
Thanks for the reference, I have only gotten through the first 8 or so pages and will clip a copy for further study. I am ashamed that the majority exceeds my abilities; however, the basic premise so far that I find interesting is the reliance on harmonics. The idea being if you lined up a number of bells, hit each of them at the same time with one clapper, and then analyzed the resultant for the original pure tones. The intent was to identify each time the pressure wave passed the null point and then try to associate its partner.
This works well for a symmetrical source like a bell or a object with consistent size and density. At issue is what happens if the source of the signal is asymmetrical, what if the sources are like different shaped pieces of metal with some having sound absorption foam on one side or at different ends, in short, harmonics would not be valid in the analysis. As to the discussion of lag and the Fourier Analysis that again would be appropriate if there was a known forcing and that the energy would be transferred to secondary sources at a given or known time and either reflected or resonated by the secondary source.
I agree I need to read further and it may be revealed, so please forgive my ignorant ramblings. It is unlikely that the forcing energy source is “free floating” in a natural system, hence it should resonate. By the same token, the likelihood of the forcing energy to not invoke a symmetrical expansion and contraction as in a pressure wave is also unlikely in a natural system. I will continue my research, thanks for the start!
Dave Cooke
RE: #91 – Do *YOU* understand how the models work? By this, I mean, do you understand the algorithms, the mathmatical basis for the model elements, and, most significantly, the propagation of error terms? Do you truly understand all of this to a degree that would allow you to state some assessment of falsifiability?
Oh for goodness sakes. Yes, it happens to be part of my job. And “*YOU”? Do you understand the statistical significance of propagating errors? And how they are accounted for? Do you truly understand the complete overstatement of “falsifiability” that is being made here?
[Response: Be nice, people. -gavin]