Regional Climate Projections in the IPCC AR4

The climate projections presented in the IPCC AR4 are from the latest set of coordinated GCM simulations, archived at the Program for Climate Model Diagnosis and Intercomparison (PCMDI). This is the most important new information that AR4 contains concerning the future projections. These climate model simulations (the multi-model data set, or just ‘MMD’) are often referred to as the AR4 simulations, but they are now officially being referred to as CMIP3.
One of the most challenging and uncertain aspects of present-day climate research is associated with the prediction of a regional response to a global forcing. Although the science of regional climate projections has progressed significantly since last IPCC report, slight displacement in circulation characteristics, systematic errors in energy/moisture transport, coarse representation of ocean currents/processes, crude parameterisation of sub-grid- and land surface processes, and overly simplified topography used in present-day climate models, make accurate and detailed analysis difficult.
I think that the authors of chapter 11 over-all have done a very thorough job, although there are a few points which I believe could be improved. Chapter 11 of the IPCC AR4 working group I (WGI) divides the world into different continents or types of regions (e.g. ‘Small islands’ and ‘Polar regions’), and then discusses these separately. It provides a nice overview of the key climate characteristics for each region. Each section also provides a short round up of the evaluations of the performance of the climate models, discussing their weaknesses in terms of reproducing regional and local climate characteristics.
Africa.
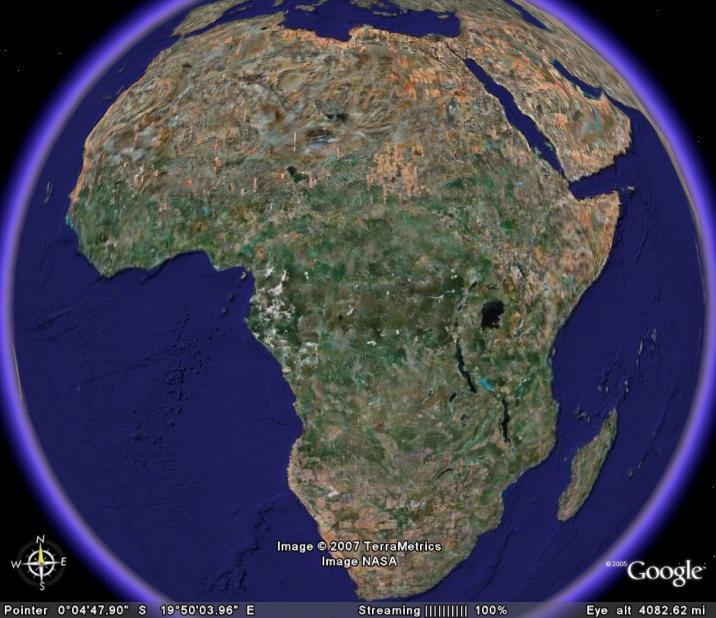
The report asserts that the extent to which regional models can represent the local climate is unclear and that the limitation of empirical downscaling is not fully understood. It is nevertheless believed that land surface feedbacks have a strong effect on the regional climate characteristics.
For the future scenarios, the median value of the MMD GCM simulations (SRES A1b) yields a warming of 3-4C between 1980-1999 and 2080-2099 for the four different seasons (~1.5 times the global mean response). The GCMs project an increase in the precipitation in the tropics (ITCZ)/East Africa and a decrease in north and south (subtropics).
Europe and the Mediterranean.
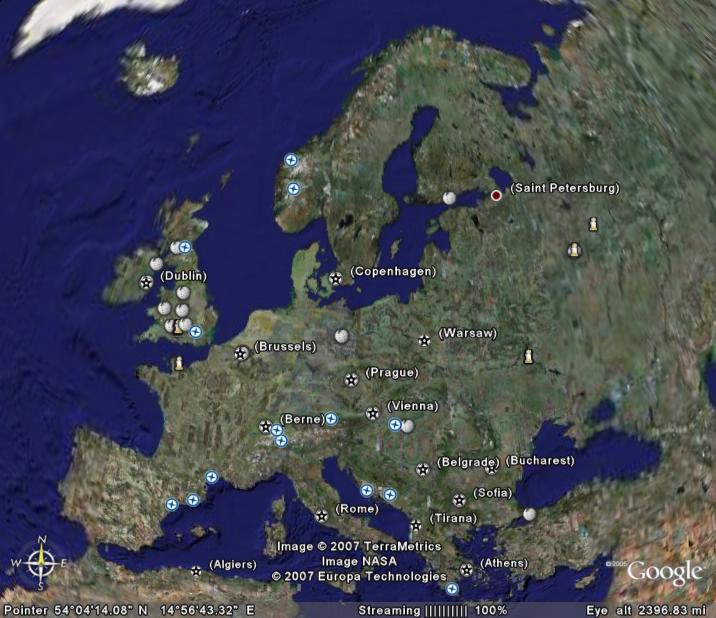
A more detailed picture was drawn on the results from a research project called PRUDENCE, which represents a small number of TAR GCMs. The time was too short for finishing new dynamical downscaling on the MMD.
The PRUDENCE results, however, are more appropriate for exploring uncertainties associated with the regionalisation, rather than providing new scenarios for the future, since the downscaled results was based on a small selection of the GCMs from TAR.
Therefore, I was surprised to see such an extensive representation of the PRUDENCE project in this chapter, compared to other projects such as STARDEX and ENSEMBLES. (One explanation could be that the STARDEX results are used more in WGII, although apparently not cited. The results from ENSEMBLES are not yet published, and besides STARDEX is mentioned twice in section 11.10.)
There are some results for Europe presented in chapter 11 of IPCC AR4 which I find strange: In Figure 11.6 the RCAO/ECHAM4 from the PRUDENCE project yields an increase in precipitation up to 70%(!) along the west coast of mid-Norway. Much of this is probably due to an enhanced on-shore wind due to a systematic lowering of the sea level pressure in the Barents Sea, and an associated orographic forcing of rain.
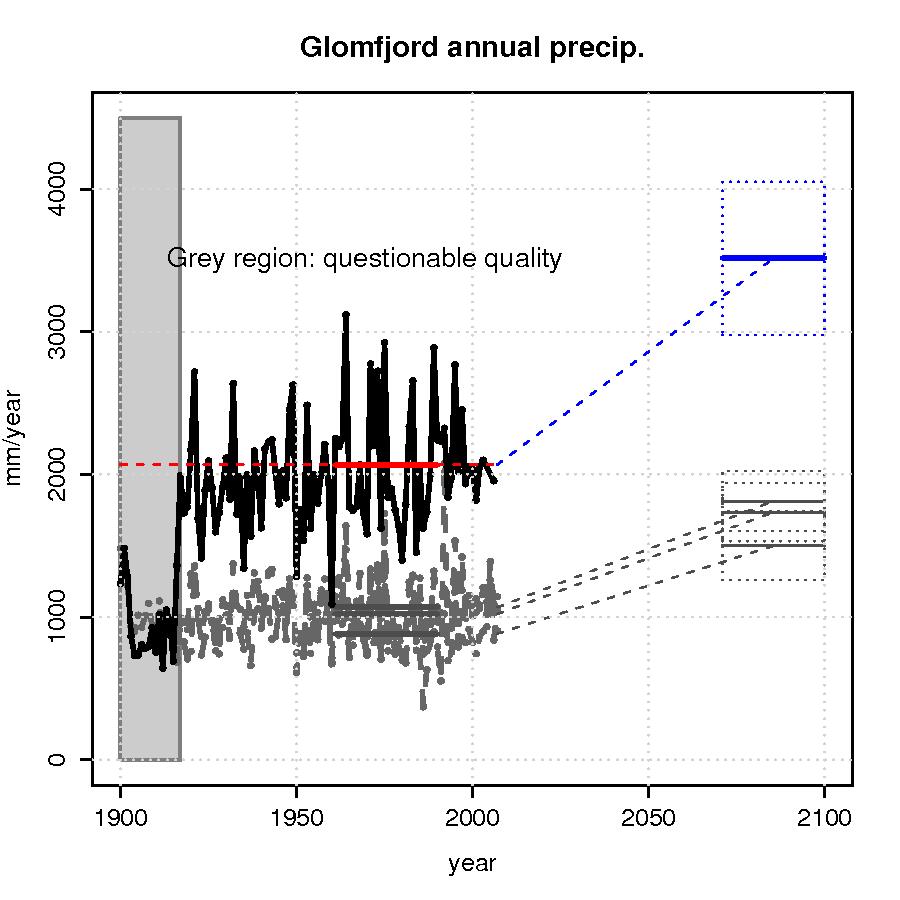
The 1961-90 annual total precipitation measured at the rain gauge at Glomfjord (66.8100N/13.9813E; 39 m.a.s.l.) is 2069 mm/year, and a 70% increase will therefore imply an increase to 3500mm/year (Left figure) which in my opinion is unrealistic . Apart from a sudden jump in the early part of the Glomfjord record, there are no clear and prominent trends in the historical time series (Figure left). The low values in the early part are questionable as the neighbouring station series do not exhibit similar jumps/breaks and is probably a result of a relocation of the rain gauges.
An increase of annual rainfall exceeding 1000mm would imply either that evaporation from the Norwegian Sea area must increase dramatically, or the moisture convergence must increase significantly since the water must come from somewhere. However, the whole region is already a wet region (as indicated by the annual rainfall totals) in the way of the storm tracks.
There are large local variations here (see grey curves in left Figure for nearby stations) and Glomfjord is a locations with high annual rainfall compared to other sites in the same area, but even a 70% increase of the rainfall with annual totals exceeding 1000mm at nearby sites (adjacent valleys etc) is quite substantial.
However, one may ask whether the rainfall at Glomfjord may change at a different rate to that of its surroundings. This question can only be addressed with empirical-statistical downscaling (ESD) at present, as RCMs clearly cannot resolve the spatial scales required.
To be fair, another PRUDENCE scenario presented in the same figure, but based on the HadAM3H model rather than the ECHAM4, suggests an upper limit for precipitation increase over northern Europe of 20% over northern Sweden.
Asia.
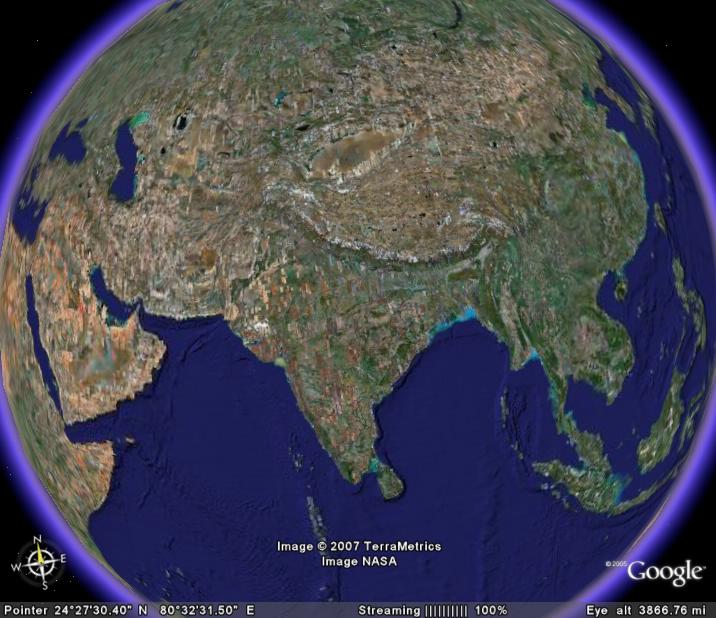
The Asian climate is also influenced by ENSO, but uncertainties in how ENSO will be affected by AGW cascades to the Asian climate.
There are, however, indications that heat waves will become more frequent and more intense. Furthermore, the MMD models suggest a decrease in the December-February precipitation and an increase in the remaining months. The models also project more intense rainfall over large areas in the future.
North America.
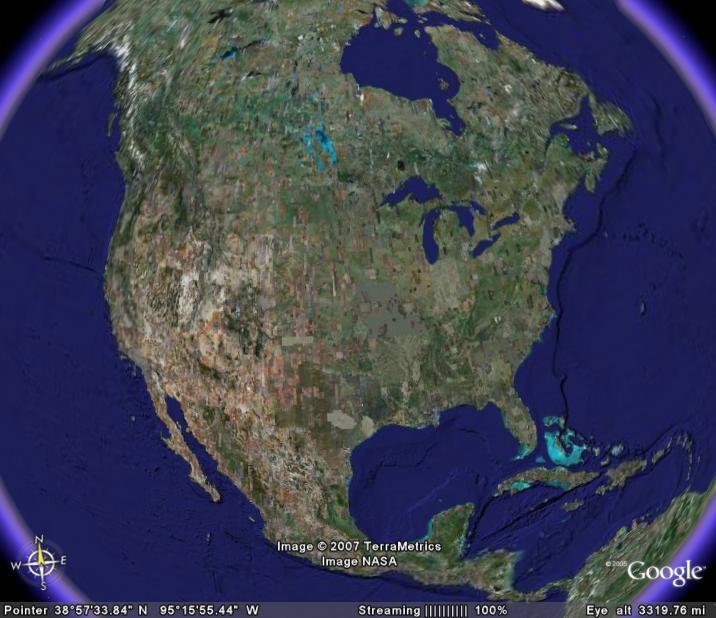
The MMD results project strongest winter-time warming in the north and summer-time warming in the southwest USA. The annual mean precipitation is, according to AR4, likely to increase in the north and decrease in southwest.
A stronger warming over land than over sea may possibly affect the sub-tropical high-pressure system off the west coast, but there are large knowledge gaps associated with this aspect.
The projections are associated with a number of uncertainties concerning dynamical features such as ENSO, the storm track system (the GCMs indicate a pole-ward shift, an increase in the number of strong cyclones and a reduction in the medium strength storms poleward of 70N & Canada), the polar vortex (the GCMs suggest an intensification), the Great Plains low-level jet, the North American Monsoon system, ocean circulation and the future evolution in the snow-extent and sea-ice. Some of these phenomena are not well-represented by the GCMs, as their spatial resolution is too coarse. The same goes for tropical cyclones (hurricanes), for which the frequency, intensity and track-statistics remain uncertain.
A number of RCM-based studies provide further regional details (North American Regional Climate Change Assessment Program). Despite improvements, AR4 also states that RCM simulations are sensitive to the choice of domain, the parameterisation of moist convection processes (representation of clouds and precipitation), and that there are biases in the RCM results when GCM are provided as boundary conditions rather than re-analyses.
Furthermore, most RCM simulations have been made for time slices that are too short to provide a proper statistical sample for studying natural variability. There are no references to ESD for North America in the AR4 chapter except for in the discussion on the projections for the snow.
Latin America.
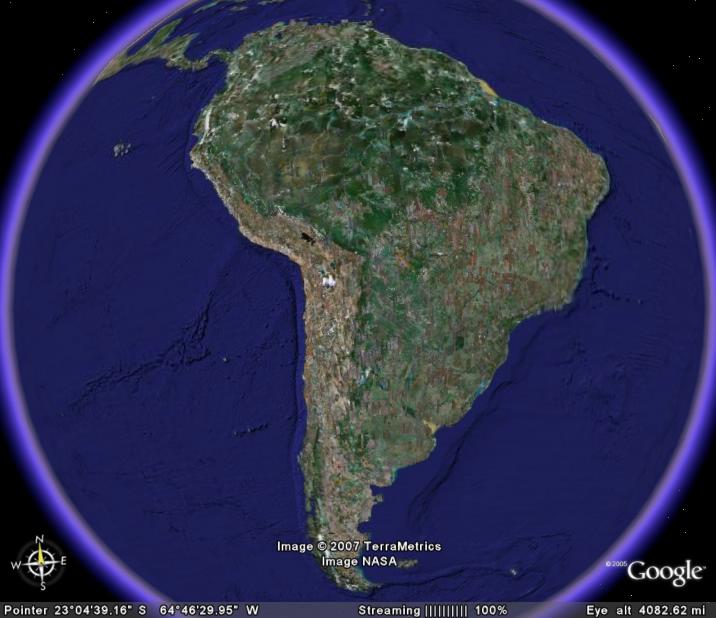
The projections of the seasonal mean rainfall statistics for eg the Amazon forest are highly uncertain. One of the greatest sources of uncertainty is associated with how the character of ENSO may change, and there are large inter-model differences within the MMD as to how ENSO will be affected by AGW. Furthermore, most GCMs have small signal-to-noise ratio over most of Amazonia. Feedbacks from land use and land cover (including carbon cycle and dynamic vegetation) are not well-represented in most of the models.
Tropical cyclones also increase the uncertainty for Central America, and in some regions the tropical storms can contribute a significant fraction to the rainfall statistics. However, there has been little research on climate extremes and projection of these in Latin America.
According to AR4, deficiencies in the MMD models have a serious impact on the representation of local low-latitude climates, and the models tend to simulate ITCZs which are too weak and displaced too far to the south. Hence the rainfall over the Amazon basin tends to be under-estimated in the GCMs, and conversely over-estimated along the Andes and northeastern Brazil.
There are few RCM-simulations for Latin America, and those which have been performed have been constrained by short simulation lengths. The RCM results tend to be degraded when the boundary conditions are taken from GCMs rather than re-analyses. There is, surprisingly, no reference to ESD-based studies from Latin America, despite ESD being much cheaper to carry out and length of time interval being not an issue (I’ll comment on this below).
Australia & New Zealand.
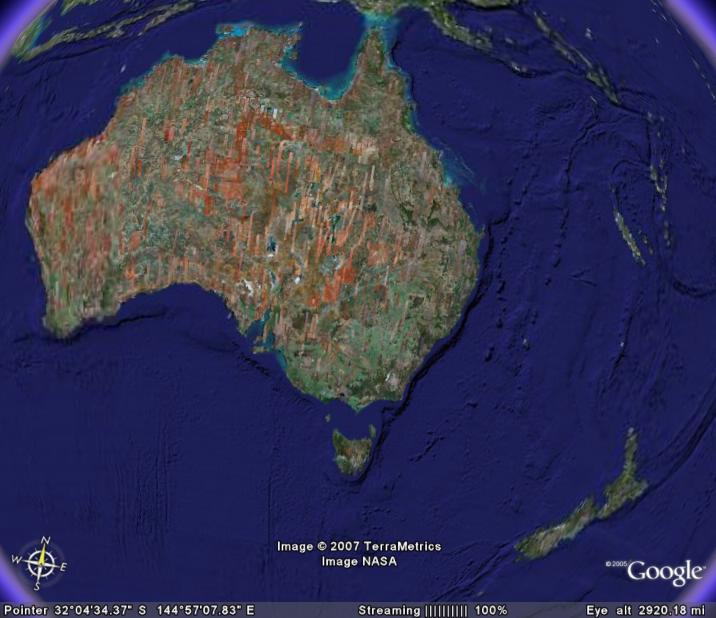
The MMD projections for the monsoon rainfall show large inter-model differences, and the model projections for the future rainfall over northern Australia are therefore considered to be very uncertain.
Little has been done to asses the MMD skill over Australia and New Zealand, although analysis suggest that the MMD models in general have a systematic low-pressure bias near 50S (hence a southward displacement of the mid-latitude westerlies). The simulated seas around Australia has a slight warm bias too, and most models simulate too much rainfall in the north and too little on the east coast of Australia.
The quality of the simulated variability is also reported to be strongly affected by the choice of land-surface model.
The projections of changes is the extreme temperatures for Australia and New Zealand has followed a simple approach where the range of variations has been assumed to be constant while the mean has been adjusted according the the GCMs, thus shifting the entire statistical distribution. The justification for this approach is that the effect on changes in the range of short-term variations has been found to be small compared with changes in the mean.
Analysis for rainfall extremes suggest that the return period for extreme rainfall episodes may halve in late 21st century, even where the average level to some extent is diminishing. AR4 anticipates an increase in the tropical cyclone (TC) intensities, although there is no clear trends in frequency or location.
Furthermore, TCs are influenced by ENSO, for which there are no clear indications for the future behaviour. AR4 also states that there may be up to 10% increases in the wind over northern Australia.
AR4 states that downscaled MMD-based projections are not yet available for New Zealand, but such results are very much in need because of strong effects from the mountains on the local climate. High-resolution regional modeling for Australia is also based on TAR or ‘recent ‘runs with the global CSIRO glimate model. A few ESD studies by Timbal and others suggest good performance at representing climatic means, variability and extremes of station temperature and rainfall.
Polar regions.
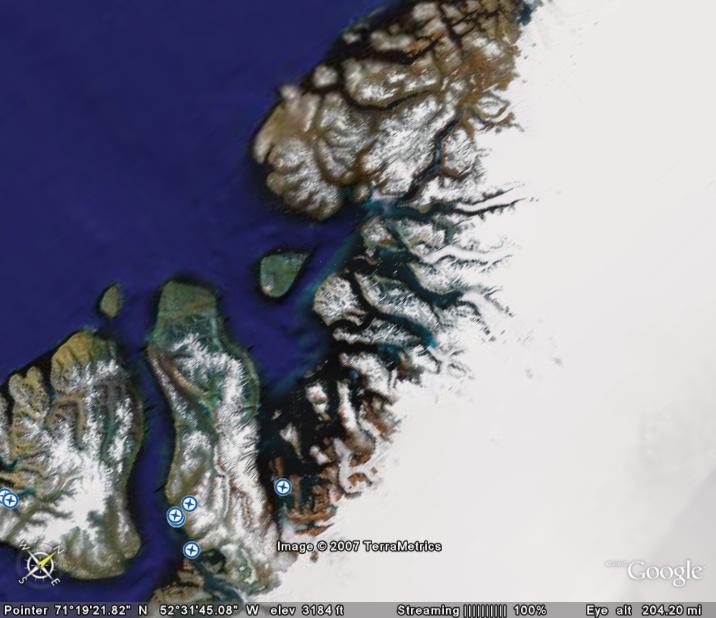
However, the understanding of the polar climate is still incomplete, and large endeavors such as the IPY hope to address issues such as lack of decent observations, clouds, boundary layer processes, ocean currents, and sea ice.
AR4 states that all atmospheric models have incomplete parameterisations of polar cloud microphysics and ice crystal precipitation, however, the general improvement of the GCMs since TAR in terms of resolution, sea-ice modelling and cloud-radiation representation has provided improved simulations (assessed against re-analysis, as observations are sparse).
Part of the discussion about the Polar regions in AR4 relies on the ACIA report (see here , here and here for previous posts) in addition to the MMD results, but there are also some references to RCM studies (none to ESD-based work, although some ESD-analysis is embedded in the ACIA report). There has been done very little work on polar climate extremes and the projected changes to the cryosphere is discussed in AR4 chapter 10.
The models do in general provide a reasonable description of the temperature in the Arctic, with the exception of a 6-8C cold bias in the Barents Sea, due to the over-estimation of the sea-ice extent (the lack of sea-ice in the Barents Sea can be explained by ocean surface currents that are not well represented in GCMs). The MMD models suggest the winter-time NAO/NAM may become increasingly more positive towards the end of the century.
One burning question is whether is the response of the ice sheet will be enhanced calving/ice stream flow/basal melt. More snow will accumulate in Antarctica, as this ‘removes’ water from the oceans that otherwise would contribute to a global sea level rise. The precipitation in Antarctica, and hence snowfall, is projected to increase, thus partly offsetting the sea-level rise.
Small islands.
Most GCMs do not have sufficiently high spatial resolution to represent many of the islands, therefore the GCM projections really describe changes over ocean surfaces rather than land. Very little work has been done in downscaling the GCMs for the individual islands. However, there have been some ESD work for the Caribbean islands (AIACC).
Two sentences stating that ‘The time to reach a discernible signal is relatively short (Table 11.1)’ is a bit confusing as the discussion was referring to the 2080-2099 period (southern Pacific). After having conferred with the supplementary material, I think this means that the clearest climate change signal is seen during the first months of the year. Conversely when stating ‘The time to reach a discernible signal’ for the northern Pacific, probably refers to the last months of the year.
Other challenges involve incomplete understanding of some climatic processes, such as the midsummer drought in the Caribbean and the ocean-atmosphere interaction in the Indian Ocean.
Many of the islands are affected by tropical cyclones, for which the GCMs are unable to resolve and the trends are uncertain – or at least controversial.
Empirical-statistical or Dynamical downscaling?
AR4 chapter 11 makes little reference to empirical-statistical downscaling (ESD) work in the main section concerning the future projections, but puts most of the emphasis on RCMs and GCMs. It is only in Assessment of Regional Climate Projection Methods section (11.10) which puts ESD more into focus.
I would have thought that this lack of balance may not be IPCC’s fault, as it may be an unfortunate fact that there are few ESD studies around, but according to AR4 ‘Research on [E]SD has shown an extensive growth in application…’. If it were really the case that ESD studies were scarce, then it would be somewhat surprising, as ESD is quick and cheap (here, here, and here), and could have been applied to the more recent MMD, as opposed to the RCMs forced with the older generation GCMs.
ESD provides diagnostics (R2-statistics, spatial predictor patterns, etc.) which can be used to assess both the skill of the GCMs and the downscaling. I would also have thought that ESD is an interesting climate research tool for countries with limited computer resources, and it would make sense to apply ESD to for climate research and impact studies to meet growing concerns about local impacts of an AGW.
Comparisons between RCMs and ESD tend to show that they have similar skills, and the third assessment report (TAR) stated that ‘It is concluded that statistical downscaling techniques are a viable complement to process-based dynamical modelling in many cases, and will remain so in the future.’ This is re-phrased in AR4 as ‘The conclusions of the TAR that [E]SD methods and RCMs are comparable for simulating current climate still holds’.
So why were there so few references to ESD work in AR4?
I think that one reason is that ESD often may unjustifiably be seen as inferior to RCMs. What is often forgotten is that the same warnings also go for the parameterisation schemes embedded in the GCMs and RCMs, as they too are statistical models with the same theoretical weaknesses as the ESD models. AR4 does, however, acknowledge this: ‘The main draw backs of dynamical models are … and that in future climates the parameterization schemes they use to represent sub-grid scale processes may be operating outside the range for which they were designed’. However, we may be on a slippery slope with parameterisation in RCMs and GCMs, as the errors feed back to the calculations for the whole system.
Moreover, a common statement heard even among people who do ESD, is that the dynamical downscaling is ‘dynamical consistent’ (should not be confused with ‘coherent’). I question this statement, as there are issues of gravity wave drag schemes and filtering of undesirable wave modes, parameterisation schemes (often not the same in the GCM and the RCM), discretisation of continuous functions, and the conservation associated with time stepping, or lateral and lower boundaries (many RCMs ignore air-sea coupling).
RCMs do for sure have some biases,yet they are also very useful (similar models are used for weather forecasting). The point is that there are uncertainty associated with dynamical downscaling as well as ESD. Therefore it’s so useful to have two completely independent approaches for studying regional and local climate aspects, such as ESD and RCMs. One should not lock onto only one if there are several good approaches. The two approaches should be viewed as two complementary and independent tools for research, and both ought to be used in order to get a better understanding of the uncertainties associated with the regionalisation and more firm estimates on the projected changes.
Thus, the advantage of using different methods has unfortunately not been taken advantage of in chapter 11 of AR4 WGI to the full extent, which would have made the results even stronger. When this points was brought up during the review, the response from the authors of the chapter was:
This subsection focuses on projections of climate change, not on methodologies to derive the projections. ESD results are takan into account in our assessment but most of the available studies are too site- or area-specific for a discussion within the limited space that is available.
So perhaps there should be more coordinated ESD efforts for the future?
On a different note, the fact that the comments and the response are available on-line demonstrates that IPCC process is transparent indeed, showing that, on the whole, the authors have done a very decent job. The IPCC AR4 is the state-of-the-art consensus on climate change. One thing which could improve the process could also be to initiate more real-time dialog and discussion between the reviewers and the authors, in additional to the adopted one-way approach comment feed.
Uncertainties
One section in IPCC AR4 chapter 11 is devoted to a discussion on uncertainties, ranging from how to estimate the probability distributions to the introduction of additional uncertainties through downscaling. For instance, different sets of solutions are obtained for the temperature change statistics, depending on the approach chosen. The AR4 seems to convey the message that approaches based on the performance in reproducing past trends may introduce further uncertainties associated with (a) models not able to reproduce the historical (linear) evolution, and (b) the relationship between the observed and predicted trend rates may change in the future.
Sometimes the uncertainty has been dealt with by weighting different models according to their biases and convergence to the projected ensemble mean. The latter seems to focus more on the ‘mainstream’ runs.
AR4 stresses that multi-model ensembles only explore a limited range of the uncertainty. This is an important reminder for those interpreting the results. Furthermore, it is acknowledged that trends in large-area and grid-box projections are often very different from local trends within the area.
Re 250. Well, George, on the one hand, you have nearly every scientist who does climate research and publishes it in peer-reviewed journals–what scientists are supposed to do. These scientists are very concerned about the changing climate. They have a mature theory of why the climate is changing and all of the causes they cite can be shown to be happening. On the other hand, you have a bunch of “retired scientists”, engineers and people who have never done any climate research and do not publish their theories in peer reviewed journals but rather in the popular press or on websites. They either say that climate is not changing (very few) or that it is changing but they don’t know why, but they’re sure it’s not humans. Oh, and often they suggest that the entire scientific community is trying to take over the world. I leave it to you to decide which group is more credible.
Al Gore did a pretty reasonable job with the science in “An Inconvenient Truth”.
George, look at the the “Hilights” column (right side of page)
— first item is “Al Gore’s Movie”
Look at “Start Here” button at top of page, a good collection
George,
In general, Gore’s movie got it right. You can quibble with some of the details, but the basic idea — human effects on the atmosphere are raising the Earth’s temperature — is correct.
If you want a good popular explanation of how the climate system works, with very little math (except in appendices at the back of the book), try George S. Philander’s “Is the Temperature Rising?” (1998). For global warming in particular, you might try John Houghton’s “Global Warming: The Complete Briefing” (2004).
re 251
“They either say that climate is not changing (very few) or that it is changing but they don’t know why, but they’re sure it’s not humans.”
If they don’t know why, how can they be sure it’s not humans? (Yes, I know, I know. But I had to ask…)
#250, George:
I first read about global warming in a certain UK popular science magazine back in the first half of the 1990’s, when I was still at school. Whilst some people will certainly have heard about global warming through Al Gore, the scientists involved have been looking at it for more than 20 years. Moreover, I do recall newspaper reports long before Gores film came out.
> more than 20 years …
More than that.
35 years ago: http://scienceblogs.com/stoat/2007/08/sawyer_prophetic_or_wot.php
And I posted this excerpt in that thread (from 1946):
” … we didn’t change the Earth’s weather, but its climate. There’d be no point in trying to explain the difference to you, I guess. They stepped up the CO2 content of the atmosphere, producing an increased blanketing effect. At first the equatorial regions were uncomfortably hot as a result; but when the thing stabilized again a lot of the polar caps had melted, and a lot of formerly desert land in the torrid zones, which had been canalized for the purpose, had flooded in consequence. The net result was an increased evaporation surface and, through a lot of steps a little too technical for the present discussion, a shallower temperature drop toward the poles….”
Hal Clement, “Cold Front”
First published in _Astounding_ July 1946
A belated reply (and maybe close-out?) to Jim, 223. I was simply commenting on the psychology and reaction of masses, including mass hysteria. I didn’t imply that this is the only process that causes groups to do stuff. But it is one way, not uncommon, that can cause a “tidal wave of public opinion”, even if contrary to the truth of the matter.
Apologies in advance if this is the wrong forum, but can anyone tell me if the GCMs predict nightime warming as well as daytime warming? I’m curious because Johnathan Lowe’s analysis of Australian temperatures shows the latter occurring, but not the former.
“Driving at high elevations should reduce the drag and increase mileage that way (assuming same wind speeds), but what might the effect of air pressure be on the engine (if any at all?)”
Lower air pressure allows the engine to be run at a higher compression ratio and therefore at a higher combustion efficiency.
I was wondering how the future climate was looking for Paraguay~since Bush Sr. recently purchased 250,000 AC there.
Stratsopheric mean temperatures for 2006-2007 for 65N-25N seem to be running well below the average from ’79 to present, in some cases breaking the minimum values.
http://www.cpc.ncep.noaa.gov/products/stratosphere/temperature/
Yet mean surface temperatures for 45N are running way above normal (28 above normal yesterday, for example)
This region has experienced numerous microbursts in the past year-one particular area had two microbursts (winds in excess of 100 mph that snapped mature 2 foot diameter oaks, three foot diameter pines like toothpicks) within the past 14 months.
Correlation?
Re. #258, Ralph Becket:
Yes of course, they predict greater night time than day time warming – and that is one of the many reasons why the solar forcing cannot be a major factor in current warming, as that would not affect night-time temperatures, whereas GHG forcing does.