Does climate sensitivity depend on the cause of the change?
Can a response to a forcing wait and then bounce up after a period of inertness?
Does the existence of an 11-year time-scale prove the existence of solar forcing?
Why does the amplitude of the secular response drop when a long-term trend is added?
These are perhaps some of the questions that we might hope to see discussed in the sequel to the sequel on solar forcing by Scafetta & West (S&W), a few of which have been discussed before here and here. (I still think those earlier studies were seriously flawed and showed a lack of scientific understanding, by the way).
This time S&W present a set of new arguments and a new set of results which are scattered all over the place. The impression from reading their paper is that the upper range (they call it ‘upper limit’) is probably more representative than the lower estimates for the solar contribution to the global mean temperature.
I think that many of their arguments, on which this impression is built, are shortsighted. For instance, they claim that certain climate reconstructions must be wrong because they give ‘unphysical’ answers. But there is another explanation too that they did not contemplate: their idealistic (one may also argue unphysical) model may also be wrong! Thus, they fail to exclude other explanations.
S&W attach the ACRIM Total Solar Irradiance (TSI) product (not the PMOD product, probably because that does not show any trend) to a TSI reconstruction (Lean 2000 TSI [see Lean, 2004], or Wang et al., 2005) in such a way that the average reconstructed TSI value over 1980-1991 corresponds with the ACRIM mean for the same period – never mind the discrepancies in trend and that such cavalier stitching of data series is one of the deadly sins in climatology (hint: the series is inhomogeneous).
One new aspect of this S&W study is the focus on ‘feedbacks’. They assume the TSI reconstruction is a proxy for the total solar influence and that CO2 is part of a solar ‘feedback’ (isotope ratios suggest the CO2 comes from deep underground reservoirs, but it’s not clear how the sun manages to dig up this carbon from deep below Earth’s surface).
S&W maintain that the climate response is greater for longer time scales (which is reasonable) as illustrated in their figure 4 (reproduced below), and assisted by the simple model illustrated in this figure, they argue that the present warming is a delayed response to past solar changes (presumably before the 1950s). But it is unclear why the temperature then flattened out and even dropped a little between 1940-1970 at the time when it really should have increased fastest. One could argue that something else also happened then, but for an unknown reason, this forcing then seemed to have a shorter relaxation time. Why such an interference would give a quicker response than a solar signal is unexplained (the response to volcanoes is fairly prompt, however).
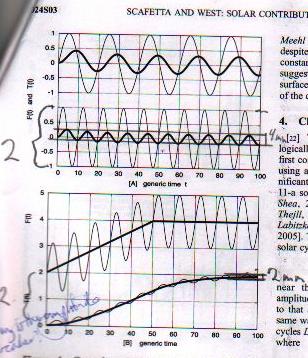
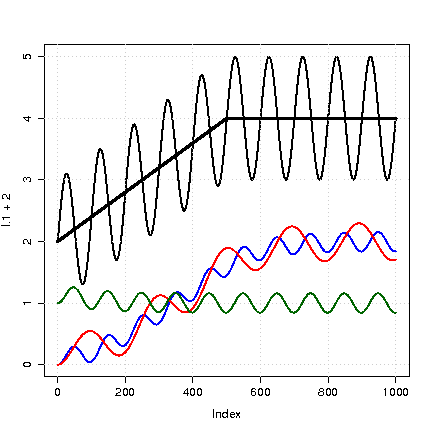
The study by S&W has some suspicious results. When their simple ‘phenomenological thermodynamical model’ (PTM) is forced by a signal with shorter time scales (high-frequency response representing the ~11-year solar cycle), it produces weaker response than if the forcing has longer time scales (or lower frequency) – as expected. But if you add a long-term trend to the former, the amplitude of the high-frequency response diminishes further (their Figure 4, reproduced above): The amplitude of the higher frequency response in their upper panel (4mm measured in the print) had diminished by ~50% in the lower panel (2mm). This is probably because the relaxation time response has been increased between the two panels and is greater than 10 in the lower panel. The presence of a trend should not affect the amplitude of the higher frequency in such a simple linear system (see my reproduction above).
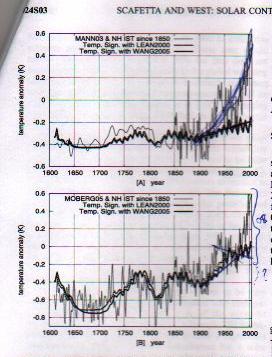
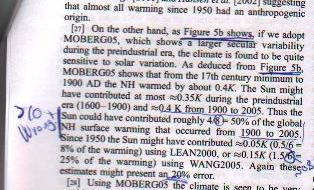
Their figure 5 (below) does not correspond with the discussion in their paper (see scanned part of the text). Again, their analysis is sloppy in the estimate of change, underestimating the observed temperature change (T(obs) in Fig 5a, the total warming is stated to be ~0.8K since 1900, but the figure suggests it is greater than 0.8K) and exaggerating the solar contribution T(sol). This way, the fraction T(sol)/T(obs) gives the impression of a more sensitive response to changes in the Sun. They then proceed to use the lower T(obs) estimate for Mann & Jones (2003) for the total temperature change (claiming 0.8K, although this is too low), but taking a solar contribution estimated from the Moberg et al. (2005) temperature with more pronounced variations (the right estimated warming should exceed 1.0K – not 0.8K as they claim). Hence the fraction of solar signal to total change T(sol)/T(obs) is spuriously inflated.
But what about GHGs if the sensitivity is so high and the relaxation time is so long? We know from laws of physics and lab measurements that the CO2 levels have been increasing and that CO2 absorb infra red radiation. In fact, the Mauna Loa observations done by infra-red gas analysers measure the absorbing properties of air samples – a pure GHG effect on a microscopic scale without feedback effects. The high climate sensitivity and long time delay suggested by S&W would be scary – imagine the GHG warming that is not yet materialised and would be in the pipeline! (Lindzen who doesn’t believe in the lagged response would indeed be surprised if this was the case!).
S&W propose two mechanisms which may amplify the response to solar variations: (i) GCR (here, here, here) or (ii) UV-radiation.
But S&W ignore the issue about the lack of trend in the GCR (Lockwood & Frohlich, 2007; Benestad, 2005), the fact that trends in the diurnal temperature suggest otherwise (IPCC, 2001, 2007), and that there is not a clear trend in the cloud cover. Thus, explanation (i) is not convincing.
The problem with the UV-explanation (ii) is that the stratosphere has been cooling – some of which is due to the ozone depletion. How could they have ignored that?
Finally, the paper oozes of vague but subjective and cherry-picked statements forming the impression that the climate and solar reconstructions of Mann & Jones (2003) and Lean (2000) (why not use more recent reconstructions, by the way?) respectively are less accurate than others. Apparently because these do not give the desired results.
The paper also offers some incorrect references (Kristjansson et al, 2004, do not support the notion that GCR affect the climate). Furthermore, their paper contains little physics, but is little more than a curve-fitting exercise with no cross-validation.
Thus, S&W make a number of unjustified assumptions and sweeping statements which turns it into a mere speculation. In a way, the conclusions are already given when S&W assume that the sun is the predominant cause from the outset. S&W presumes a desired conclusion when arguing that if the TSI variations are small but the temperature variations are pronounced, then this suggests greater climate sensitivity and vice versa. No surprise, their conclusion is that the sensitivity to solar changes is high. Any other conclusion would then be surprising, wouldn’t it?
If they were my students, I’d have flunked their paper.
Ellis @ 242: Shattered? Perhaps, if you hold your monitor upside down. Not only is the thick black line clearly 1C below the holocene maximum
See where there’s an arrow pointing to the left-hand axis (at about 0.4) with the large label “2004”? That’s where the thick black line would be now if the scale permitted it.
The inset graph helps to make this clear.
“Ray of hope: Can the sun save us from global warming?” (5.12.2007)
http://news.independent.co.uk/sci_tech/article3223603.ece
“Could the Sun’s inactivity save us from global warming? David Whitehouse explains why solar disempower may be the key to combating climate change”
Any thoughts?
Ref 241. I am a Canadian. Of course I expect winter. What we dont know is what SORT of a winter we are going to get. I did not expect that it would be apparent so quickly that the “tipping point” of so little ice in the Arctic Ocean, was probably not a “tipping point” at all. Will it be so cold in the arctic this season that there is, say, 1 million sq kms more of ice than the 1979/2000 average next March?
We just recently added our signature to the Kyoto protocol here in the land of Oz. It needed a change of government but it was FINALLY ratified. That just leaves one other country..hmmm, who could that be? In Australia cutting emmisions is no trifling economic task. We depend on agriculture, mining and other exports and these alone make up 20%+ of our greenhouse emissions. Cutting emissions will hurt us but it’s a pain we will have to get collectively used to. I phoned origin energy, one of our energy companies to ask when they will be rolling out sliver cell panels..they said not for another 3-5years. I called them ealier in the year and they said probably in less than 2 years..are we progressing or regressing?
In response to some questions about the coherency or otherwise of scientific reports re: climate change. The use of satellite mapping is helping greatly quantify and qualify the extent of change seen in the world especially ice melt. i.e the ice melt observed by satellite in greenland this year was the fifth worse on record. Even though there has been quite a lot of re-freeze after the artic winter earlier in the year refrozen ice only refects 50-60% of the sun’s rays back into space compared with over 85% for hard-dry pack ice.
It’s the difference between compacted snow-ideal! and just frozen water which will melt as soon as first rays of spring fall on it. What I read in ‘Science daily’ was that antartica ‘s west coast was having the first ever significant melt happening in 2005 and moulins appearing as far as 400kms inland and to an altitude of 500ft.
Ellis, while you are correct that Earth was warmer at the peak of the Holocene (by 6 billion people and dependent on a complex infrastructure. And yes it was ~3 K warmer 140 K years ago. Did you happen to notice on the same graph where ice coverage was?
As to aerosols, a partial issue can be found here:
http://earthobservatory.nasa.gov/Study/GISSTemperature/giss_temperature4.html
You know, you could look this stuff up yourself, too.
Re #252 “I did not expect that it would be apparent so quickly that the “tipping point” of so little ice in the Arctic Ocean, was probably not a “tipping point” at all.”
This only seems to be “apparent” to you. It was predicted on this site that the anomaly, measured by surface area of ice, would quickly decline as winter approached. Whether a “tipping point” has been reached will become evident over the next few years, but the fact that extensive freezing of the ocean surface has occurred is, so far as I am aware, not a surprise to anyone (i.e. it should have been, and indeed was, expected, whether a tipping point has been passed or not). Can you cite any statements from those believing a tipping point has happened or may have happened which suggest otherwise?
Jim Cripwell @252: Will it be so cold in the arctic this season that there is, say, 1 million sq kms more of ice than the 1979/2000 average next March?
No. Next question?
For reference, the 1979/2000 average maximum sea ice area is a little over 14 million square kilometres. The anomaly in 2007, 2006, and 2005 was around a (negative) million square kilometres. The anomaly in 2004 was a little closer to zero. Before that there were 3 or 4 years of maxima around the long-term average. According to my reading of the “tale of the tape”, we haven’t had a maximum well above the long-term average since 1985, and we’ve never had a maximum as high as you suggest.
What sorts of odds would you like? I’ll give you 5:1.
How about one euro per twenty thousand square kilometres either side of the 1979/2000 average maximum sea ice area? To sweeten it, I’ll pay out 2:1.
So if we see a maximum which is 500,000 square kilometres above the average, I’ll pay you 50 euros, but if the maximum is 500,000 square kilometres below the average, you’ll pay me 25 euros.
(I have a side-bet with an office mate that you won’t accept this bet).
Ray,
The sulfur graph at your link is impressive:
http://earthobservatory.nasa.gov/Study/GISSTemperature/giss_temperature4.html
It shows the modern sulfur level is lower than it was in 1900! Is this much reduction in aerosols (reduced over 3x from the 1970s peak) in the climate models?
RE #253
Jim, you said
[I did not expect that it would be apparent so quickly that the “tipping point” of so little ice in the Arctic Ocean, was probably not a “tipping point” at all. Will it be so cold in the arctic this season that there is, say, 1 million sq kms more of ice than the 1979/2000 average next March?]
You seem to be missing the real point of this discussion. It is not about extent. It is about the area of new ice and the diminishing perennial sea ice. Perennial sea ice—which is at least 10 feet thick and remains throught the seasons and through the years—dropped 14 percent from 2004 to 2005.
If you think this winter refreeze is a signal there is as you said [probably not a “tipping point at all] you discount the dynamics of the ease of new ice melting in the summer.
All betting aside, there is observed evidence the new ice on the Western boundary is being affected by wave and wind action NOW. (see the links at # 239)
Dec. 4: http://arctic.atmos.uiuc.edu/cryosphere/IMAGES/ARCHIVE/20071204.jpg
Nov. 27 http://arctic.atmos.uiuc.edu/cryosphere/IMAGES/ARCHIVE/20071127.jpg
How long that weather impact might be continued and repeated throughout the winter is an unknown. What is known is the melt season is just around the corner and it will begin with conditions that could hasten the melt and possibly the extent. Forget the surface area talk and focus on thickness.
‘“tipping point” of so little ice in the Arctic Ocean, was probably not a “tipping point” at all. …’ – Jim Cripwell
How is the winter so far in Ottawa? My brother owns a factory there. I reference winter in South Dakota, which is where we grew up. They appear to be having a balmy winter in the Dakotas. Could that be bad for perennial ice?
Steve,
I am not a climate modeller. However, I would imageine they are included (Note the link is from EOS/GISS). Wouldn’t you include them if you were doing the modeling?
Sulfates vary on fairly short terms. A really big volcanic eruption causes a big spike but levels return to normal within a couple of years. It’s kind of amazing how well the graph follows economic activity for the period up to 1970.
Zelix (#246) wrote:
In 207, I said that he is studying an oscillation — something dynamic — as a means of trying to determine what effects a higher temperature will have upon cloud formation once the climate system reaches equilibrium at that higher temperature — where the equilibrium is something static.
I pointed out that this is roughly equivilent to trying to determine the sensitivity of the climate system’s temperature to solar insolation based upon the difference in temperature between day and night. It wouldn’t work. As such his approach provides us with no basis whatsoever for drawing the conclusion he draws.
As for the GCMs, they don’t assume that clouds are a negative or positive feedback to temperature. They are built upon first principles, physics including radiation transfer theory, thermodynamics, fluid dynamics, etc., and then they crunch numbers. But they are models, and they do not include all the physical processes, and we know that in some cases they don’t model processes that well — which is a sign that there are some things which are missing — and generally gives us clues where to look so that we may improve their fit to reality.
Re #247: [Look at the left side. See the big black arrow labeled “2004″ there? Then look at the little inset square that expands the last few years. See the temperature?]
You know, that graph would be a LOT clearer, at least to non-climate science professionals, if the X axis was flipped so that it followed the standard convention for time series and put the most recent values on the right side. As it is, my first impression was that it’s one of those “made up by denialists” fakes trying to claim that it’s really getting colder.
#246 Zelix: the positive cirrus feedback comes out of the modelling, which is IIUC based on known physics and ought to be valid.
What you are apparently looking for is direct observational evidence for this feedback. Like the Spencer et al 2007 paper, but applied to global warming.
The only way to btain such evidence would be to monitor cirrus formation in the tropics over a large number of years (using stable instrumentation and methodology) during which significant global warming is happening. A tall order, and I suspect the answer is no.
J.C.H writes “How is the winter so far in Ottawa?” Looks like we are all set for an “old fashioned” winter. About 2 feet of snow so far; white Christmas looks good. Snow should keep too much frost from the tulips. The ski hills are all going full blast; I gather the New Zealand ski resorts refer to snow as “white gold”. Temperatures at or a little below normal. We have not had winter come so early for some years, and many of my friends keep hoping for the global warming!!!
Jim Cripwell @ 265: maybe the precipitation you’re seeing is the result of evaporation from the exposed Arctic Ocean earlier in the year ….
Re # 229 Ray, you write “I’m afraid I am a bit of a skeptic “.
Well, “Scepticism is the highest of duties” of every true scientist.
About Ilya Usoskin, please visit his home page at http://cc.oulu.fi/~usoskin/ to see the remarkable amount of studies, e.g.
Usoskin, Ilya G., and Gennady A. Kovaltsov, 2006. Cosmic ray induced ionization in the atmosphere: Full modeling and practical applications. J. Geophys. Res. – Atm., 111, D21206, doi:10.1029/2006JD007150, November 8, 2006, online http://cc.oulu.fi/~usoskin/personal/2006JD007150.pdf
“…Results of the full Monte Carlo simulation are tabulated in a form of the ionization yield function. These tables are given together with a detailed recipe, which allows a user to compute easily the cosmic ray induced ionization for given location, altitude and the spectrum of cosmic rays. This provides a new tool for a quantitative study of the space weather influence upon the Earth’s environment. Some practical applications are discussed.”
For comparison, please notice how badly climate modelers are able to present Solar radiation at TOA from Equator to Poles, e.g.
Raschke, Ehrhard, 2005. How Well do we Compute the Insolation at TOA in Radiation Climatologies and in GCMs? GEWEX News Vol. 15, No 3, p. 1 and 15, August 2005, online http://www.gewex.org/Aug2005.pdf
Further, about modelers’ problems please see
Kiehl, Jeffrey T., 2007. Twentieth century climate model response and climate sensitivity. Geophys. Res. Lett., 34, L22710, doi:10.1029/2007GL031383, November 28, 2007
“…It is found that the total anthropogenic forcing for a wide range of climate models differs by a factor of two and that the total forcing is inversely correlated to climate sensitivity. Much of the uncertainty in total anthropogenic forcing derives from a threefold range of uncertainty in the aerosol forcing used in the simulations.”
Well, Kiehl almost openly admits that the modeling community has tuned the forcings to fit those to temperature variations, and Kielh doesn’t even mention clouds in the Abstract.
Now, back to the Sun. Someone in this discussion has already mentioned my dear fiend Enric Palle, and I’d like to direct attention to the new study
Goode, Philip R. and Enric Pallé, 2007. Shortwave forcing of the Earth’s climate: Modern and historical variations in the Sun’s irradiance and the Earth’s reflectance. Journal of Atmospheric and Solar-Terrestrial Physics Vol. 69, No 13, pp. 1556-1568, September 2007
Abstract
“Changes in the Earth’s radiation budget are driven by changes in the balance between the thermal emission from the top of the atmosphere and the net sunlight absorbed. The shortwave radiation entering the climate system depends on the Sun’s irradiance and the Earth’s reflectance. Often, studies replace the net sunlight by proxy measures of solar irradiance, which is an oversimplification used in efforts to probe the Sun’s role in past climate change. With new helioseismic data and new measures of the Earth’s reflectance, we can usefully separate and constrain the relative roles of the net sunlight’s two components, while probing the degree of their linkage. First, this is possible because helioseismic data provide the most precise measure ever of the solar cycle, which ultimately yields more profound physical limits on past irradiance variations. Since irradiance variations are apparently minimal, changes in the Earth’s climate that seem to be associated with changes in the level of solar activity—the Maunder Minimum and the Little Ice age for example—would then seem to be due to terrestrial responses to more subtle changes in the Sun’s spectrum of radiative output. This leads naturally to a linkage with terrestrial reflectance, the second component of the net sunlight, as the carrier of the terrestrial amplification of the Sun’s varying output. Much progress has also been made in determining this difficult to measure, and not-so-well-known quantity. We review our understanding of these two closely linked, fundamental drivers of climate.”
Ref 266 Touche (with an acute accent over the e)
Ray Ladbury (#255) wrote:
Two small points.
The temperature 140,000 years ago was more like a little over 1.5 K above today’s temperature. He is grabbing his temperatures near the poles — which means polar amplification, roughly by a factor of 2, so you divide by 2 to come up with the difference in global temperatures between the two eras. And the Holocene at least extends back only to 11,500 Before Present.
But yes, it was warmer. However, with a doubling at say 560 ppm we will probably be warmer than we were 140,000 BP once the climate system settles down to equilibrium — by about the same amount.
Bye-bye Holocene, hello Anthropocene…
Not quite the same ring to it, is there?
Ray Ladbury> Wouldn’t you include them if you were doing the modeling?
Of course, and I’m sure aerosols are included at some level, but my question was whether the quantitative reduction in aerosols in the models matches what seems to be a radical 3x reduction since the 1970s.
Re 258 Steve Reynolds
The reduction in sulfates is indeed impressive. But note it represents conditions downwind of Canada and the US where emission have been reduced substantially. These reductions have been offset by vast increases in sulfates from China and India.
#81 Craig Allen: But this new crop [of leaders in Australia] includes some of the most committed, intelligent, environmentally savvy, socially progressive people in the country.
Unfortunately, tenacious wasn’t on the list of attributes…
From http://www.news.com.au/heraldsun/story/0,21985,22883548-662,00.html
Kevin Rudd recoils from climate change pledge
PRIME Minister Kevin Rudd last night did an about-face on deep cuts to greenhouse gas emissions, days after Australia’s delegation backed the plan at the climate talks in Bali.
A government representative at the talks this week said Australia backed a 25-40 per cent cut on 1990 emission levels by 2020.
…
But after warnings it would lead to huge rises in electricity prices, Mr Rudd said the Government would not support the target.
…
Mr Rudd said he supported a longer-term greenhouse emissions cut of 60 per cent of 2000 levels by 2050
Thanks to all for correcting my lying eyes, except of course Ray, who agrees with my lying eyes. Silly me, I was comparing proxy to proxy and not proxy to thermometers. Boy do I have alot to learn about “science”.
Ray, I am not sure that from the graph it is possible to ascertain where the ice coverage was, however, it is interesting that during the last interglacial, where, I guess, we can all agree that it was at least 3C warmer, that there was more ice volume than there is at present. Of course, that is only from eyeballing the graph, but doesn’t higher temperatures usually equal less ice?
As an aside, Ray, I apologize for any inconvieniance that my questions may pose. I guess, rather naively, that in a society it was acceptable to ask questions of others with more knowledge than myself, to further my understanding of an issue. Just think, if I did not ask the question Steve Reynolds would never have known about your link to aerosols. On the other hand, you could probably just not respond, and thereby keep all of your knowledge to yourself.
Anyways, now that I have direction, thanks to Ray and Timothy, I am off to learn about the vagaries of aerosols and their effects on climate.
Ice report:
http://alaskareport.com/news1207/do77862_sea_ice.htm
Thickness and age:
http://pafc.arh.noaa.gov/ice.php?img=ice
The sun was in a period of very high activity for the last 100 years. (The solar large scale magnetic field increased by 2.3 times from about 1890 to around 1970. Solar activity was at its highest level in over 8000 years in the later part of the twentieth century.) Just by simple solar observation the solar period of high activity appears to be over. (See this comment for details concerning solar changes over the last 11,000 years.)
https://www.realclimate.org/index.php/archives/2007/11/a-phenomenological-sequel/#comment-72532
Summary:
Solar changes over last 11000 years. 16% of the time in the last 11000 years the sun was in very low activity. 9% of the time the sun was in very high activity. (See paper link in comment for details.)
How much of the 20th century warming (modulation of clouds, in addition to irradiation changes (TSI & UV)) was due to the high activity of the sun?
What is the time lag for the solar change from high to low activity? How long until the climate changes due to the change for high to low solar activity are observable?
Thoughts?
Mr. Gavin Schmidt,
I am here
Could you please explain your quote,
Within the context of the paper you co-authored, that states,
Was your quote taken out of context? If not, could you please explain further this apparent contradiction.
[Response: No contradiction. My statement concerned the long term trends in aerosols, while the GACP part of that release was discussing very recent changes. Aerosol concentrations are still higher than they were earlier in the century on a global basis. – gavin]
Ellis, you pointed to this chart:
http://en.wikipedia.org/wiki/Image:Holocene_Temperature_Variations.png
What you claim to be seeing doesn’t match the chart.
Ellis (#272) wrote:
It was a little over 1.5 K above current temperatures 140,000 years ago. Polar amplification means you have to divide by 2 — since you are taking your measurements from Greenland and Antarctica — although this is of course an approximation.
Please see:
However, lets say 2 for the sake of simplicity. That means that if we double pre-industrial by going to 560, our new equilibrium will be about 0.7 K above about 140,000 years ago — since we are already at 0.8 K above pre-industrial. In any case, corrections are always appreciated. (As are references, no doubt.) It gives everyone a chance to learn. Not that everyone will take advantage of this, necessarily.
Ellis (#272) wrote:
Actually there would seem to be a fair number of people out there that don’t really think so. Trends regarding glaciers in Greenland (a doubling in the rate of melt and a tripling of the icequakes in a single decade) get discounted sometimes — since they haven’t been going on for that long. Then there are those that will point to the fact that some glaciers are still growing — even though 90% are shrinking.
However, if you at least want to see what happened to the ice by way of proxy, you can check the sea level relative to today:
Image:Phanerozoic Sea Level.png
http://en.wikipedia.org/wiki/Image:Phanerozoic_Sea_Level.png
I just recalled a chart that adds another piece to the puzzle in understanding the Holocene:
FIGURE SPM-1. Changes in Greenhouse Gases from ice-Core and Modern Data
http://www.greenfacts.org/nl/klimaatverandering-ar4/figtableboxes/figure-1.htm
We seem to have been raising levels of CO2, methane, and nitrous oxide for the past 5,000 years, but nothing like what we have done in the past century. Makes sense since we were at roughly 280 ppm for CO2 at the beginning of the Industrial Revolution. In fact the minimum for ppm of CO2 was set around 7,500 BP (before present) at about 265 ppm.
Re 225, 239, 259: John, Wayne
There seems to be a clear reason for the Arctic warming at the beginning of December. On 27-29 November a strong rossby wave was forming over Alaska, followed by a cut-off of the wave and a drift of the cut-off high over the arctic. This brought very warm air throughout the whole troposphere into the arctic. You can follow this event looking at any Northern Hemisphere 500 hPa charts. On 2 december, the 500 hPa level reached until about 5700 m, which is not very far from subtropical highs.
In principal this process of cutting off rossby waves is not unusual. However, I do not know, how unusual such a strong wave with such high temperatures is for mid-winter. This is a question for meteorologists or would need a statistical analysis (e.g. maximum 500 hPa heights North of 70 deg. lat. in december from NCEP over the last 50 years). Of course, if there is a general rise in temperature, one would expect the temperature of cut-off highs to rise. It is much more difficult to estimate, if the chance of occurrence of this process in mid-winter would also rise. As difficult as any question of circulation changes…
William Astley (#274) wrote:
Responding to your last two substantive questions first, you’ve asked, “What is the time lag for the solar change from high to low activity? How long until the climate changes due to the change for high to low solar activity are observable?”
If I may quote from a different paper by several authors, two of whom you may already be familiar with:
Now in response to your first question, “How much of the 20th century warming (modulation of clouds, in addition to irradiation changes (TSI & UV)) was due to the high activity of the sun?”
The authors conclude:
(Hat-tip to John C.)
Re 282 Please see also
Usoskin, Ilya G., M. Schüssler, Sami K. Solanki, and Kalevi Mursula, 2005. Solar activity, cosmic rays and Earth’s temperature: A millennium-scale comparison. J. Geophys. Res. – Space Physics, 110, A10102, doi:10.1029/2004JA010946, October 1, 2005, online http://cc.oulu.fi/~usoskin/personal/2004ja010964.pdf
Re 270
The 3x reduction in sulphate refers to emissions from North America. (Greenland icecores) I guess the European reductions are more or less the same. Asian emissions on the other hand has increased over the same period.
Ellis, I also misread the chart-which really did a piss-poor job of conveying the info it was trying to convey. And asking questions is fine. What I have trouble with is the snide implication that the role of aerosols in the 1940-1970 period was in any way “ad hoc”. My admonition was to suggest that you could avoid such ignorant suggestions if you did a quick search and looked at reputable sources (e.g. NASA, NOAA, IPCC) rather than those from the denialosphere.
William Astley, I’m curious. Just how would you get a delayed response to the types of mechanisms you are positing? And what other forcing would you suggest gets diminished (or negative forcing increased) to compensate for this effect? There is very little wiggle room in the CO2 forcing, so this would still mean that CO2 is the main driver of the current warming. No matter how much you dance around the subject, you will wind up at the same spot–anthropogenic CO2 emissions are driving current climate. That is a very robust conclusion.
276
Thank you for your response Gavin. I just have a couple of follow up questions, When you say earlier in the century do you mean the past hundred years? When you say aerosol concentrations are still higher are you refering to each constituant aerosal (eg. sulfate, nitrate) being higher or do you mean the sum of all aerosals are higher? And when you say higher than earlier in the century, does that mean higher than at any time in the last century?
Having read this paper, I suppose that you use the downward sw solar radiation as evidence of the increased aerosal concentrations over the past 60 years, is this correct?
If so, how does Gerald Stanhill’s comment,
effect this view of downward sw solar radiation as a metric for aerosals?
[Response: I thought my statement was clear. But anyway…. aerosols concentrations are diagnosed directly through measurements of aerosol optical depth, not from solar radiation proxies. Further back, those estimates are sparser and so they are supplemented by ice cores measurements etc. Peaks of aerosol emission in the US and Europe probably occurred in the 1980s, though there is a big black carbon spike from the US in the 1920s-1930s. Overall aerosols have risen over the last century, but they may have stabilised and started to decrease in recent years. – gavin]
In reply to Ray Ladbury:
“And what other forcing would you suggest gets diminished (or negative forcing increased) to compensate for this effect? There is very little wiggle room in the CO2 forcing, so this would still mean that CO2 is the main driver of the current warming. No matter how much you dance around the subject, you will wind up at the same spot–anthropogenic CO2 emissions are driving current climate. That is a very robust conclusion.”
Svensmark asserts that based on his research that an increase in solar modulation of cloud cover is responsible for 0.6C of the 0.7C of the 20th century warming. Other solar researchers have estimates of 75%.
Ray, I agree that it does not seem possible that both groups of scientists can be correct. I do not support your comment, however that the scientific issues are settled.
To me the research associated with the hypothesis, that solar magnetic field changes modulate the earth’s cloud cover seems to be real science.
Can you or someone else in this forum, explain why this could not be possible?
There are mechanisms for example, to explain how solar changes could modulate planetary cloud cover.
https://www.realclimate.org/index.php/archives/2007/11/a-phenomenological-sequel/#comment-71835
Palle’s research supports a reduction in planetary albedo (clouds) in the 20th century which would result in higher temperatures. As measuring planetary albedo is controversial, that explains why the scientific issue concerning solar modulation of cloud cover, is not settled.
Earthshine
http://solar.njit.edu/preprints/palle1266.pdf
I see this RealClimate article (see link below) which asserts that Palle’s measurement of planetary albedo is incorrect. It should be noted however that the solar warming (calculated based on Palle’s albedo measurement) of 7.5 W/m^2 can be reduced and still allow solar changes to be responsible for the majority of the 20th century warming. (I believe the total calculate GWG warming is 1.5 W/m^2.)
https://www.realclimate.org/index.php/archives/2006/02/cloudy-outlook-for-albedo
William Astley (#288) wrote:
Svensmark has produced some really good correlations, hasn’t he?
Here’s how:
… and it gets better.
William Astley (#288) wrote:
We have knowledge of how carbon dioxide and other greenhouse gases render the atmosphere increasingly opaque to thermal radiation as the levels of these gases increase. It comes down to spectra and radiation transfer theory, which is then explained in terms of photon absorption by molecules, quantum states of excitation and their relaxation by photon emission.
Its physics, well-established physics. Whatever might get discovered won’t undo this. And there has been a great deal more discovered than just the physics which all adds up to a coherent scientific view of the world.
*
The sun’s magnetic field may have a non-negligible effect upon the earth’s climate. However, even if I set entirely aside my understanding of the physics involved, the fact that people such as Svensmark have to make recourse to such methods as are detailed in the paper given above tells me at least that such a model is no longer a credible alternative to our mainstream understanding of global warming.
William Astley (#288) wrote:
Hypothesized mechanisms, but no solar trend to drive them. I pointed as much out in 282. Quoting from an earlier paper by two of the authors of one of the better papers you’ve cited — which it would appear wasn’t that good a paper. Try lining up their hypothesized Holocene era solar cycles with the Holocene Thermal Optima, the Medieval Warm Period and the Little Ice Age. And remember, the more sunspots, the hotter the sun.
William Astley (#288) wrote:
It isn’t measuring planetary albedo which is particularly controversial, it is how he chose to measure it — and the fact that far more extensive records provide far more reliable estimates.
William Astley (#288) wrote:
Is the reduction in albedo the result of a non-existent solar trend? Or the result of falling aerosol levels? Or is it the result of falling aerosol levels and their indirect effects upon cloud formation – as aerosols are actually large enough for cloud-droplet nucleation?
But more importantly, what is the net effect of the clouds? Cooling by means of their albedo effect or warming by means of their greenhouse effect? The cooling and warming effects are roughly equal in strength, with the net effect and even its sign depending upon the characteristics of the cloud.
However, you would appear to be considering only the albedo, not the opacity to thermal radiation. Even if Palle’s highly inflated measurements of albedo had actually been right, it is quite possible that the net effect of diminishing clouds would have been to cool the earth due to diminished greenhouse effect rather than warm it due to diminished albedo.
Svensmark might have certain strengths, but evidence and math clearly aren’t among them. Palle might too, but obviously these do not include math or logic. What is it about the views of such people that in contrast to mainstream science you find so compelling?
William Astley,
You persist in the incorrect belief that global climate models are just a fit to account for the observed warming, and that if you just find some other large forcing, the whole problem will go away. The reality is that the forcings in the models are determined independently of current temperature trends. Different forcings have different uncertainties, and greenhouse gasses are among the best known. It is fine to look at other forcings, but in trying to use them to argue that greenhouse forcing is less significant, you are arguing against physics. And in positing GCR modulation, you are arguing against physics with a nonphysical alternative. There is no evidence that such a mechanism is operative. There is no model (i.e. hypothesis yielding quantitative predictions) that has been proposed. It is not clear that the proposed model would even yield the correct trend (unless you can figure out how to make it work during the day, but not at night. And even if we found that your suggested forcing was operative, it would not affect greenhouse forcing, but would most likely affect estimates some less certain forcing (aerosols, other cloud formation processes, etc.).
You have spent a great deal of time learning about dubious forcings. I would suggest that you take a tiny fraction of that prodigious investment and learn a little bit about GCMs.
William, with regard to Svensmark, I would suggest checking out:
Pattern of Strange Errors Plagues Solar Activity and Terrestrial Climate Data
Paul E. Damon, Peter Laut
Eos,Vol. 85, No. 39, 28 September 2004
http://stephenschneider.stanford.edu/Publications/PDF_Papers/DamonLaut2004.pdf
It doesn’t deal exclusively with him, but it will give you a good indication of how he gets his correlations. I would also suggest keeping in mind the fact that clouds have both an greenhouse effect and an albedo effect. They warm as well as cool, and the two effects largely cancel one-another. And aerosols have what is called an “indirect effect” where they promote the formation of clouds by acting as nuclei for water droplet formation.
*
Finally, as Ray Ladbury points out, the trends in greenhouse gases, aerosols and solar irradiance which the models make use of are based upon empirical data independently of the models, and the formula which the models make use of are based on physics — not mere correlations.
With regard to the opacity of greenhouse gases to thermal radiation, it comes down to their absorption spectra and distribution in the atmospheric column. The absorption spectra are are subject to precise measurements in laboratories and are well-understood in terms their excitation states and quantum mechanics.
Their distribution in the atmospheric column is also well-known, although not as preciesly as their spectra. Likewise, we can measure the effect rather precisely throughout the atmospheric column at a large number of altitudes for each gas now that we have satellites capable of taking measurements on over 2000 different channels.
*
Nothing that we might discover regarding magnetic fields or the like will change what we already know by means of well-established science. And the models do a rather good job of fitting the observed behavior of the climate. The fact that they do so even though they are independent of such observed behavior suggests that the models work well.
Likewise, the fact that they fit what we know regarding the paleoclimate suggests that they do well. And the fact that they do well both with regard to current and past climates suggests that whatever additional forcings might possibly be discovered will not be of central importance.
#281 Urs, Yes makes sense, there were strong upper winds, distinct wind and temperature laminas and strange irregular profiles. But it was all part of a slow warming starting at end of November.
#252 Bee, Surely inactive compared to 2001-04 , but I am quite sure I’ve seen some sun spots during the last five months, will double check my archives…
August 24-27 single spot near the sun’s equator… Will check September October on Monday…
Re 292
Check here: http://www.dxlc.com/solar/
#293 Phil, But of course there is SOHO. So much for “no sunspots for months” comment. There is something about the sun which drives people including scientists to speculate, its probably because its a big thing to understand. But the very recent record, the data of substance, indicates no Maunder minimum devoid of sunspots, at least for now.
You can keep track of daily sunspot observations here.
Yet today denialaists take the snow carried from the steaming Arctic Ocean and falling in the middle of the ‘States as a sign that the AGW story is wrong… They’re delightedly holding a stick, yet it’s the elephant’s tail, eh!
Several posts refer magnetic indices and their use as proxy data for studies of solar influnence on terrestrial temperature. The index data set derived at the Finnish Meteorological Institute has been mentioned too. Here I would like to make a contribution to that thema.
As a comment on geomagnetic activity indices (e.g., aa, ak etc) referred here (#105, 116, and 150) I would like to clarify some basic definitions. Geomagnetic activity indices are connected with the transient variations of the geomagnetic field usually in the time frame from a few hours to daily variations. Indices are discrete numbers connected with the maximum amplitude or deviation of the magnetic field in the time interval in question. All regular variations (both internal and external) have been removed from the magnetic data from which the indices have been derived. Thus, the time series of activity indices reflect the disturbed magnetic conditions in the Earth’s ionosphere and magnetosphere ultimately due to variations in solar activity.
Activity indices are usually derived from the continuous magnetic recordings of permanent magnetic observatories. Indices calculated from data produced at a single observatory reflect magnetic activity conditions of regional scale. A set of observatories with global extension can be used for production of indices for global scale. Depending on which observatories have been used in the index derivation, different symbols have been attached on the activity values series. Usually three-hour index of a single observatory is labeled as K-index, and the daily index based on eight K-values is ak or Ak. On the planetary scale there are 3-hour Kp and daily Ap (see, e.g., http://www.gfz-potsdam.de/pb2/pb23/niemegk/kp_index/description.html)
In studies of long-term geomagnetic variations (space climate), say from years to decades and more, activity index series give important data source. The longest available index series is called aa and it is based on two antipodal observatories in UK and Australia. The aa-series started in 1868 giving thus about 140 years of continuous magnetic information. The aa-index series have been utilized e.g. for determining long-term trend in the solar magnetic field stretched into the interplanetary space with the solar wind (e.g., Lockwood et al., 1999).
The aa-series was extended by using magnetic data from Helsinki (Finland) observatory that covers the interval 1844-1897. The magnetic observations were compiled from the original notebooks and analyzed by the Magnetic unit of the Finnish Meteorological Institute (e.g., Nevanlinna 2004). This extended series is thus the longest one based on magnetic observations. The data is available here: http://www.ava.fmi.fi/MAGN/magn.
Currently the Magnetic unit is dealing with historical observatory data from 5 observatories from the 19th century giving more confidence of the existence data series. Preliminary data are here: http://www.ava.fmi.fi/~hakkinen/pietari/
In studies dealing with possible solar signatures in terrestrial temperatures, aa-index and its extension and other similar data series have been widely used as proxies of suspected solar fingerprint in the atmospheric temperature variations. There are certain inhomogeneties in the long-term index series like in aa , thus any correlation found between T and solar variation must be carefully checked with independent data series (if available).