Readers might remember a minor kerfuffle in EOS (the AGU house journal) in February this year in which Gerald Stanhill claimed to find a paradox in the contemporaneous effects of global warming and global dimming (a long term reduction of surface solar radiation, mainly due to aerosols and clouds). The article attracted attention mainly because the paradox was claimed to “pose [a challenge] to the consensus explanation of climate change”.
Rather than point out the subtle confusions (between surface and tropospheric forcing, and local and global signals) here, I and two co-authors wrote a comment to the journal. After a number of avoidable and unavoidable delays, this comment (along with another one and a reply) have all now appeared in EOS (Nov 6 edition). By now of course, the original piece has been long forgotten and so the point in having the correspondence printed is unclear, but still…
For those that care, I’ll link our comment once it’s been posted on the GISS website (now available here), but the bottom line is clearly seen in the following figure:
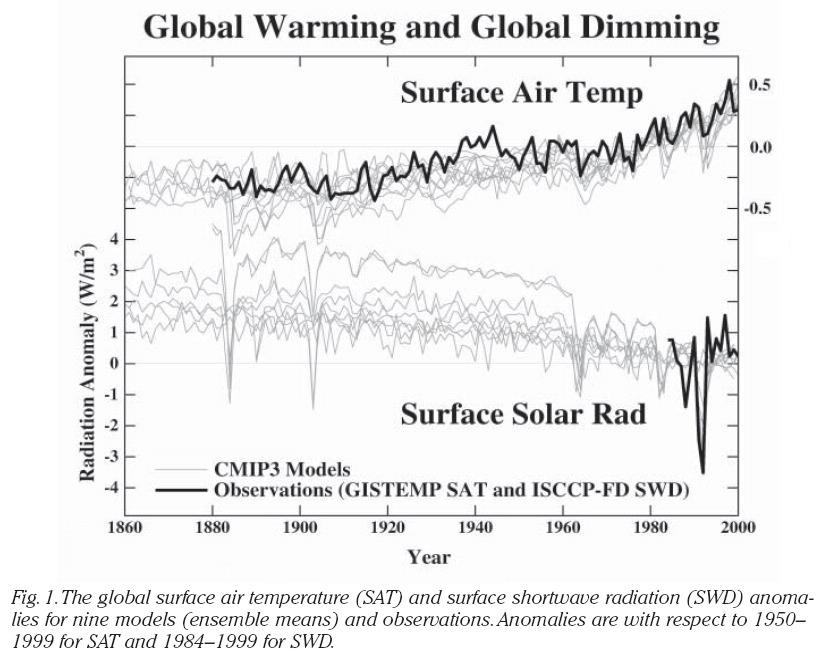
That is, if you take all of the IPCC AR4 models (now called the CMIP3 ensemble), then over the twentieth century all of them show varying degrees of global warming, while at the same time they show significant global dimming. An earlier paper of ours had pointed to the aerosols (unsurprisingly) being the dominant cause for long term changes in dimming, but that changes in clouds on a decadal basis were responsible for much of the shorter term variability. Thus there doesn’t appear to be much ‘paradox’ left to worry about – both dimming and warming are seen in models and in observations.
Apologies for appearing to push my own papers here (not something we like to do particularly), but the published comment would have been better done as a blog post in February. There may be a lesson there….
Hi — I’m a little confused. Are the signs reversed on the scale for the surface air temp (right axis)? As they are now, they indicate surface cooling over the 20th c. I’m pretty certain that is not the case, given the mass of data accumulated saying otherwise, and also this post, which points out that warming is seen in observations and predicted in models. Thanks.
[Response: ooops! My bad. I’ve now corrected the figure here, but unfortunately it will be incorrect in EOS. I have no idea why that happened (It was my fault though, not EOS)…. – gavin]
Gavin — No apologies are required. You often mention other work as well, I believe.
Anyway, the graph is worth it…
Thanks Gavin, I read these articles today with interest. The big delay is strange. The failure of the original author (Stanhill) to have any substance to counter the two commentaries noting that we are experiencing, not a brightening but a dimming is illustrative in itself. The response of Leipert and others notes a 1961-1990 data set that showed declining trends of 7watts/m2, 12 wats/m2 in populated areas. Is there a graph of this data and how does it fit with the graph in this note and in your EOS post?
Don’t take this as being too annoying, and agree no big deal on the axis “typo”. However I don’t understand how that would not be caught in the peer review or fact checking parts of these complex papers. How much of the peer review process simply assumes (reasonably) that you know your stuff and therefore a thorough read is not required? (I’m still digesting the paper – very interesting, and critical to the common and unfair claim by many skeptics that cooling factors confound the conclusion of AGW.)
[Response: Correspondence in EOS is not peer-reviewed, but I should have caught this in proofs. – gavin]
For those who are unfamiliar with Eos, the AGU’s description of it is often helpful:
“Eos is a newspaper, not a research journal.”
Some items are peer-reviewed, though certainly not all.
In theory, “Eos does not publish original research results”, though their consistent application of that principle seems to be lacking.
Of course Gavin has just publicly let slip a clue that the entire of climate science is a conspiracy to show the globe is warming, when in fact it has been cooling for a century.
If the media catches this, that guy that melts the Arctic Ice with a hairdryer every summer is going to be out of a job.
Reminds me a little of the classic showing Napoleon’s march and retreat on Russia (with location and number of troops conveyed) which I ran into again earlier today at a coffee shop.
Here is a version:
http://library.thinkquest.org/C0110901/imagesAll/map/attackRussia.gif
… and something more recent:
http://www.cs.cmu.edu/~sage/Papers/HCI-journal-96/HCI-journal.html#section4.1
Troop size, location, date, latitude, longitude, temperature… It is a real art getting so much information into such a small space. Your chart does much the same, conveying temperature and insolation anomalies, both measured and as modeled. Obviously the surface solar radiation is after taking out the effects of reflective aerosols.
It might be nice to see estimates of the individual forcings (solar insolation and reflective aerosols broken out, for example, and perhaps surface air temperatures for Northern and Southern hemispheres) for the mean of the runs of the Nasa model as well. In this way you could perhaps better convey the causes of dimming and warming and why they are able to take place at the same time — rather than just the fact that they do both in reality and in the models.
Either way though, surface radiation appears to have more or less leveled off since the late seventies but for Pinatubo.
As Timothy says, that chart does convey a lot of info. Any reason for it stopping in 2000?
gavin> …but the published comment would have been better done as a blog post in February. There may be a lesson there….
Yes, that method seems successful for the Climate Audit blog (if I am allow to mention it) that just won the best science blog Weblog award.
No matter what and where science comes from, if it be USA, or from Europe, or wherever from across the globe, there will always be these sceptics who continue to ridicule the findings, such as the man who warms up the arctic ice every summer with an hairdryer, I mean such comments would be laughted at in kindergarden, as they are laughted at here on this HYS site. I know that many of you say things like this with a “tongue in cheek” attitude, but there are unfortunately millions upon millions of dimwits out there who believe such claptrap.
Re Timothy Chase @ 7: Yes. Anyone who has to convey numerical information clearly should be familiar with the books of Edward Tufte.
This includes all scientists and engineers, most business people, and a lot of journalists too. It should be required reading.
Seriously, if you haven’t read “The Visual Display of Quantitative Information” then run, don’t walk, to EdwardTufte.com, and pick up a copy.
I think that the general quality of quantitative graphics has improved considerably since that book’s first publication; I don’t know how much credit for that is due to Tufte.
I fail to see how you can state that solar surface radiation has declined based on this data. During the very short observation period there is very little trend and if anything it is upwards. To say solar surface radiation has declined you need to rely on model data. However, the model data and observational data do not match very well, the difference is often more than 1 w/m2. The models are clearly not very good, but without them there is no evidence of a decline in solar surface radiation.
[Response: There is substantially more in siitu data though this is limited in spatial extent. Most of the long term changes are based on that. See our posts on Global Dimming in the index. – gavin]
#6 Stuart, Actually I use photocopy toner – my boss is about to find out why we get through tons of it. ;-)
#8 Steve, “Climate Audit.. ..won the best science blog Weblog award.” And any kudos associated with that award disperses.
Wild et al “Impact of global dimming and brightening on global warming” is available here: http://www.iac.ethz.ch/people/wild/2006GL028031.pdf As I don’t get why Stanhill references that but still sees a problem it seems likely I need to consider deeper than my half hour lunchbreak allows.
Wild et al (above) is of interest in terms of diurnal range changes as a finger-print of CO2 driven warming.
Climate Audit won best science blog?
What is this world coming to?
A general comment: I used to think it’s global brightening (GB) 1990-2002 rathe than global dimming of the previous decades that poses a challenge to climate models detection-attribution for the recent significatve warming 1977-2006.
This brings at least three questions :
– did Earth really experience a 12 or 15 yrs of increasing insolation on surface (that is: is GB a reality or an artifact of poor climatologies)?
– if so, what was the amount of energy imbalance for the period and could this have influenced the temperature records, specifically the temperature trends of the 1990s and early 2000s?
– finally, do AR4 climate models reproduce the trend (the graph above is not clear for the most recent period)?
I’m not sure what you all are saying & I don’t have time to delve. Is it this: someone pointed out that due to the aerosol effect there has been some global dimming & this contradicts the global warming theory???? Which we all know is fasle since the climate scientists have been taking this aeosol effect into account….and actually only when they do take it into account does the actual data make sense.
And no mention of how global dimming may be masking a truly alarming global warming….once the aerosol effect goes away (which it would, at least due to the fact that the aeosols only last a short time in the atmosphere, while CO2 lasts a long long time). And that the actual sensitivity of warming-to-GHGs might be perhaps higher than figured, due to this aerosol effect?
Is that it, or am I missing something.
The reason I ask is that there are some people who are at a much lower stage of scientific savvy on this entire issue of GW, who might like to understand this site.
Surly you’re mistaken.
Where did you get your belief? Why do you trust your source?
Do you know how to look this up for yourself?
http://www.thaindian.com/newsportal/health/india-getting-five-percent-less-sunlight-now-than-in-1980-due-to-industrial-pollution_1005239.html
November 15th, 2007
“…Padma Kumari and her colleagues at the Indian Institute of Tropical Meteorology in Pune reckon that the country is getting about five per cent less sunlight than it did 20 years ago.
The researchers studied data from the India Meteorological Department, and measured differences in solar radiation at 12 stations across the country between 1981 and 2004….”
http://weblogawards.proboards85.com/index.cgi?board=2007pollchanges
http://www.tellinya.com/read/2007/11/09/science-blogs-2007-anatomy-of-a-break-in/
Comment by Steve Reynolds —
“As Timothy says, that chart does convey a lot of info. Any reason for it stopping in 2000?”
Second try –
Also, can you think of any reason why the same averaging periods are not used for both?
Could these charts be updated, showing current temps and rad, with a 30-year averaging period ending in 2000?
[Response: The averaging period for the dimming is so that it is lined up with the satellite obs, and for the SAT it was for graphical convenience. In each case the different trends are apparent in the early part of the record. The models only go up to 2000 with observed forcings and that is why they are truncated then. The satellite data have not yet been processed (AFAIK) for the 2000+ period. – gavin]
There was a Nova episode (PBS) regarding the Global Dimming. People were clued in when they looked at the pan evaporation rates and saw it did not jive with temperature record. Good episode and it was what brought me here to this site to learn more of the underlying science. So thanks, Y’all. Though I am curious too where would we be without the global dimming, which has essentially masked global warming, from what I understand.
#12 CORRECTION
My ref to Wild et al – I quoted the wrong paper!
What I link to may still be useful in the context of this issue, but it is not cited by Stanhill.
In Stanhill’s paper is he really right to implicitly equate the TOA defined radiative forcing change with a change in surface insolation (2.4 vs 20 watts/m2)? Or is my understanding flawed?
#14, Charles Muller
Read the paper I refer to in #12 (section 3) re temperature impacts. Increased insolation is suggested to have caused the reduction in diurnal trend to desist – more surface insolation raised daytime warming rates.
I for one am happy to see people (including Gavin) discuss their papers here – as an amateur it’s hard to keep a view of how much significance to research without comment to guide that. And as a penniless amateur I rely upon what researchers put in their publications pages. More guests please – Figen Mekik’s involvement in her thread was very useful.
Hank, if you’re referring to me in #16, I did google the topic and apparently Bad Astronomy and Climate Audit tied for first place although it looks as if there was a bit of skullduggery at play in the vote . . .
good stuff. I seen the two other responses in EOS. Silliness.
“Yes, that method seems successful for the Climate Audit blog (if I am allow to mention it) that just won the best science blog Weblog award.”
They are voted on by the public and not scientific entities…and you may place a vote every 24 hours.
One report I read stated that most Americans don’t even know the defintion for “area” and think that creationism is more likely than evolution…so “if it sounds real, duh, it must be real.”
http://2007.weblogawards.org/news/voting-rules.php
Somewhat OT, but I’m very interested to hear thoughts:
Climate change worse than predicted
Climate Audit tied with Bad Astronomy, both with exactly 20,000 votes. Not sure what the deal was there.
A quick comment on the Australian story posted earlier. I know skepticism is usually derided on this blog but it’s stories like this that make me think a little skepticism is warranted.
The newspaper treats the Climate Institute as an independent scientific body, but if you look at the Institute’s website you find this reason for its founding:
“The impetus for this was simple: a belief that the extreme urgency of the situation requires decisive commitment and action from government and industry on a grand scale.”
So it’s an advocacy group. There’s nothing wrong with that of course, but I wouldn’t call it objective science either. That the media goes along with the charade is more than enough reason to be skeptical.
For what it’s worth I think the planet has been warming and that people are partly responsible. But almost everything other than these two points is very complex: the extent of the warming and our influence, the ramifications, economic and societal costs (and benefits) etc.
So the crowing about consensus and the sneering at “denialists” comes across as simplistic and rather juvenile.
>Climate Audit tied with Bad Astronomy, both with exactly 20,000 votes. Not sure what the deal was there.
Clear explanation here:
“Some of you have been understandably a little puzzled and seeking to interpret the matter. Here’s a bit of the background.”
http://www.climateaudit.org/?p=2347
Jim Galasyn (#25) wrote:
Well, there is the difference between the destructive effects of the warming (which are looking like they will be worse than what the IPCC expected, judging from the rate of loss on Artic sea-ice, acceleration of Greenland, the West Antarctic Peninsula, the weakening of the carbon sinks, the extreme weather which we are already seeing, etc.), the rise in greenhouse gases (which is worse than what the IPCC projected), and the rise in temperatures themselves. Different timescales.
The effects of accelerating CO2 emissions?
We aren’t seeing them yet, nor should we be. The effects of carbon dioxide are cummulative, and seven years aren’t much time to accumulate those effects. Remember, what we do now won’t change things much at all for the next thirty or forty years. We will just be paying for our past sins, at least as far as CO2 is concerned. But by the end of the century, what we do from here on out will be the difference between temperatures rising by 7 F and 15 F in some parts.
re: #10 Nick
And a really great way to do it is to check Tufte’s website for his course schedule and sign up – you get all 4 books as part of the package, which is about 50% of the total cost, leaving only the price of about 4 tanks of gasoline. Very well worth it. All the books are good for insight, but the newer ones are truly beautiful.
What about evaporation then? There are claims, that (potential) evaporation actually decreased within the last decades… Increased diffuse radiation decreases evaporative demand more than do increased air temps.?
More here: http://www.science.org.au/natcoms/pan-evap.pdf
Gavin
Re your response to my comment 11#. I had a look at the global dimming posts
“most of the data are from the Northern Hemisphere and all are taken on land……. a reduction of about 4% in three decades. Since the late 1980s a recovery seems to be occurring but the studies demonstrating this are not yet published.”
Which suggests that the data are regional at best and with the recovery reported, show no overall trend in the observational record. So I come back to my original point that there is no overall trend in the observational data and the argument relies heavily on models, which are a poor match for observational data.
Not sure if anyone has done any regional studies comparing local emissions to “dimming”, but global sulfur dioxide emissions peaked in the late ’80s and have since fallen to about 1970 levels.
[Response: Only true for US (definitely) and Europe (possibly). Definitely not true for China and India, and therefore unlikely to be true for the globe. – gavin]
Thanks to Steve for explanation on the vote. Fun with online polls never stops…
I fully agre with Paul Gosling (#11 and #32) that the observational data in the given plot do not show any dimming, but on the contrary rather a brightening, if you omit the Pinatubo caused negative spike. I really would like to see observational data confirming the hypothesized dimming for both NH and SH. My own solar measurements done in Luxembourg show an increase in solar energy and in sunshine duration since 1998 (sure, this is a local trend, so I do not claim global valididy). See here
Except for the fact that the scientific consensus in no way depends on advocacy groups, making your statement a bit of a strawman.
I’m going to ask an off topic question here, mostly to settle a debate with some denialists.
At this point the earth’s current tilt is about 23.5 degrees, does this angle put more radiation in the NH? Could this contribute at all to NH warming? Thanks for any input.
Adam (37) — Orbital forcing, by not only precession but the strictly orbital parameters as well, is well understood. According to orbital forcing theory, the climate should have been slowly cooling for the last several thousand years and continue to do so for the next 20,000 years.
Adam have you considered that the earth rotates around the Sun? The tilt of the earth means that the NH gets more radiation in half the orbit, and the SH gets more radiation in the other half. We call the result ‘seasons’.
[Response: Be nice. It’s conceivable that Adam is really talking about the precession – which does make a difference to NH summers. However, we are currently at almost the least favorable position for NH summer warmth – it was much more favorable 9000 years ago… – gavin]
Thanks, David. Is there a link were I can learn more?
Adam posts:
[[I’m going to ask an off topic question here, mostly to settle a debate with some denialists.
At this point the earth’s current tilt is about 23.5 degrees, does this angle put more radiation in the NH? Could this contribute at all to NH warming? Thanks for any input.]]
Only for half the year. The other half, it contributes to SH warming. The Earth’s rotational axis is fixed with respect to the stars, not the sun.
Adam (40) — Here is one place to get started:
http://www.aip.org/history/climate/cycles.htm
Adam (40) — Some analysis of orbital forcing:
http://tamino.wordpress.com/2007/02/16/by-request/
Adam posts:
[[I’m going to ask an off topic question here, mostly to settle a debate with some denialists.
At this point the earth’s current tilt is about 23.5 degrees, does this angle put more radiation in the NH? Could this contribute at all to NH warming? Thanks for any input.]]
The basic idea, as far as I understand it (others feel free to jump in), is that the obliquity (tilt) is about 1/2 way now between its two extremes and is decreasing the warming effect on the NH -The current tilt is 23.5° and it is decreasing by about 0.00013″ per year.
Obliquity controls the seasonal variations. As the axial tilt decreases, the differences between seasons decrease.
In general, these combined three long-term Milankovitch forcings are heading us into an ice age (in perhaps another 15,000 years or so)…as we have been doing for the ~last 6000 years…
until we humans started changing this cycle (about 1750), by burning fossil fuels and adding greenhouse gases and making the Earth’s average surface temps warmer and the stratosphere and mesosphere colder (our new human-caused geologic age is sometimes named the “Anthropocene”)…
I understand that all three Milankovitch cycles are presently about in the middles of their forcings.
This has helped create a strangely calm last ~10,000 years (Holocene), The last time the Earth was this calm apparently was about 400,000 years ago during a similar Milankovitch “cycle get-together”.
Usually the Earth is in the “long grass” state or in a near chaotic climate situation which changed the equivalent local climates of Georgia to Boston and back again within ten years or less in continous lurching, sharp climate changes. Fun, fun, fun under the sun.
Some peer-review publishing scientists are apparently questioning if we humans are perhaps pushing the Earth’s systems back toward the chaotic “long grass” by adding greenhouse gasses and pushing the climate toward “tipping points”.
I have read that now we humans are now making a permanent geological rock formation of a layer of (now) clay on the ocean floor caused by global warming…Wow, I wonder what our ancestors will say about that?-errr deep.
The following is from Wikipedia and “The Science of Global Warming” by Frances Drake (I like a lot of his insights).
Obliquity (tilt)
“Currently the Earth is tilted at 23.44 degrees from its orbital plane, roughly half way between its extreme values. The tilt is in the decreasing phase of its cycle, and will reach its minimum value around the year 10,000 AD.”-Wikipedia
“Eccentricity-(orbital shape around the Sun)
Orbital mechanics require that the length of the seasons be proportional to the areas of the seasonal quadrants, so when the eccentricity is extreme, the seasons on the far side of the orbit can be substantially longer in duration.” Wikipedia
“When autumn and winter occur at closest approach, as is the case currently in the northern hemisphere, the earth is moving at its maximum velocity and therefore autumn and winter are slightly shorter than spring and summer. Thus, summer in the northern hemisphere is 4.66 days longer than winter and spring is 2.9 days longer than autumn.
The Earth’s orbit has an eccentricity which varies between zero and 0.06, but it varies in an unorderly manner. The extreme values of any one oscillation differ from the next. The period of oscillation is also variable, averaging 96,000 years.
Perihelion is the point of closest approach to the Sun and currently occurs in the northern hemisphere winter: 2-3 January. Aphelion is the summer: 5-6 July. The nearer the Earth is to the Sun, the faster it moves, so northern hemisphere winter is shorter than the summer by about 7 days at the present time. The reverse is true in the sorthern hemisphere. Therefore the eccentricity hsa the effect of varying the difference in the amount of solar radiation between aphelion and perihelion. At present, with an eccentricity of .0017, the differnece is 7 percent.
The solar radiation received in January is 3.5 percent stronger more than average and correspondingly less in July. Nothern hemisphere winters are not warmer (and summers cooler) than their northern hemisphere counterparts because the difference in land mass between the two hemisphere balances the differences in radiation receipt. When the orbit is the most elliptical, the seasonal range in solar beam reaching the Earth is about 2.5 per cent between aphelio and perihelion _Rogers, 1993).”
Part of this from “The Science of Global Warming” by Frances Drake
“http://en.wikipedia.org/wiki/Milankovitch_cycles.
http://members.aol.com/gregbenson/iceage.htm
http://www.sciencemag.org/cgi/content/abstract/292/5515/274
J Imbrie, J Z Imbrie (1980). “Modeling the Climatic Response to
Orbital Variations”. Science 207 (1980/02/29): 943-953.
^ Berger A, Loutre MF (2002). “Climate: An exceptionally long
interglacial ahead?”. Science 297 (5585): 1287-
#33 response: I would think that the dimming diminished significantly in Eastern Europe and the FSU after 1990. First from a depression and then because the rebuilt economy was a lot cleaner.
RE #17 & “Padma Kumari and her colleagues at the Indian Institute of Tropical Meteorology in Pune reckon that the country is getting about five per cent less sunlight than it did 20 years ago”
Could part of this be due to the wars in the Middle East? I went to India the summer after the 1st Gulf War (1993?), after a bunch of oil wells had been set afire, plus all that carnage and fire power used during the war. There was a noticible dimming to the naked eye. Reminded me of a dimming I experienced in the U.S. some years back. Everything looked somewhat darker on a sunny day without clouds & I thought my cataracts were really getting bad….then I found out it was an eclipse of some sort.
Also I think there is a lot more pollution as India industrializes, and more people buy cars. And many still burn wood and cow cakes for cooking fuel. OTOH I think that all or most of the coal-powered trains have been replaced by diesel and electric. I’m not sure though.
Bangledesh Cyclone 1600 plus dead….probably closer to 2600. It’s difficult to comprehend this if one is not there. Welcome to the new age of climate change.
Thanks to Tim in 29 for the succinct reply.
PaulM.
new age of climate change? 1991 Bangledesh cyclone. 138,000 dead.
Don’t trivialize the death of people by slapping an AGW label on every catastrophe.
Send money. I have. Work to keep communities from living in disaster prone areas.
Re: Sulfur
Global sulfur emissions were falling until at least 2000. AR4 cites Stern, whose data can be found here http://www.rpi.edu/~sternd/Sulfur.html
He breaks it down by region and country. Data after 2000 is spotty.