France has a per capita carbon emission of 1.64 tonnes, compared to 2.67 tonnes for the U.K and 5.61 tonnes for the US. So, if anybody has earned the right to rest on their laurels and pontificate to the rest of the developed world about what they should be doing, you’d think it would be France. Far from it, under the leadership of Nicolas Sarkozy, France has embarked on an ambitious program of deeper carbon reductions. In introducing the measures, Sarkozy said "The guiding principle is that the cost to the climate — the carbon cost — will be integrated into planning of all major public projects, and into all deliberations affecting the public." These measures include: a commitment that all new buildings would be net energy producers by 2020, incandescent lighting would be banned by 2010, buyers of efficient vehicles would be subsidized, drivers of inefficient vehicles would be penalized, and road construction would be severely curtailed in favor of expanded rail travel using state-of-the-art French TGV technology. A carbon tax is also being seriously contemplated. These proposals are the result of an intensive months-long series of discussions with scientists and stakeholders such as environmental nongovernmental organizations, industry representatives, and labor union representatives. The process, known as Le Grenelle de l’Environnement, was described here by Nature (subscription required) and a summary of some of Sarkozy’s proposed actions was reported in the press here.
All the same, there has been some pushback from a vocal pair of highly decorated French academicians, Claude Allègre being the most prominent and noisiest of the two. In recent years, Vincent Courtillot has emerged as a reliable sidekick to Allègre — a Dupont to his Dupond — helping to propagate Allègre’s claims and adding a few of his own. Both are members of the Académie des Sciences, and Allègre has been awarded both the Crafoord Prize and Bowie Medal. Allègre has an impressive list of publications relating to the Earth’s interior, and besides that was Minister for Education, Research and Technology in the Jospin government. Courtillot — currently director of the Institut de Physique du Globe de Paris (IPGP) — has had a distinguished record of research on fundamental aspects of geomagnetism and is currently President of the Geomagnetism and Paleomagnetism Section of the American Geophysical Union. Their views were amply (some would say more than amply) represented at a symposium on the IPCC report, held last Spring at the Academie (See the issue "Evolution des Climats" of La Lettre de l’Académie des sciences, and press reports in Le Figaro, Le Monde, and Liberation). What does all this mean? Are the opinions of Allègre and Courtillot founded on some special profound insight that has escaped the notice of the community of scientists who have devoted entire careers to studying climate? Let’s take a look.
[NDT : les passages en italique sont en français dans le texte original]
Les émissions de carbone en France s’élèvent à 1,64 tonne par personne, contre 2,67 tonnes au Royaume Uni et 5,61 tonnes aux Etats Unis. Si un pays peut se targuer d’être vertueux, et faire la leçon aux autres pays développés, vous pourriez penser que ce serait la France. Loin de là, sous l’impulsion de Nicolas Sarkozy, la France s’est lancée dans un programme ambitieux de réduction des émissions de carbone. En présentant ces mesures, M. Sarkozy a déclaré : « Premier principe : tous les grands projets publics, toutes les décisions publiques seront désormais arbitrées en intégrant leur coût pour le climat, leur ‘coût en carbone’. » Ces mesures comprennent : l’engagement que tous les bâtiments construits en 2020 soient des producteurs nets d’énergie, l’interdiction des ampoules à incandescence à partir de 2010, des aides pour les acheteurs de véhicules les moins polluants, les conducteurs de véhicules les plus polluants étant au contraire taxés, et la construction de routes sera limitée pour favoriser les transports ferroviaires avec la technologie de pointe française du TGV ! Une taxe carbone est également envisagée. Ces propositions sont le fruit d’une intense série de discussions entre scientifiques et représentants de la société civile, dont des représentants d’organisations non-gouvernementales écologistes, d’organisations patronales et de syndicats. Ce processus, connu sous le nom de Grenelle de l’Environnement, a été décrit brièvement dans Nature ici (accès avec souscription), et un résumé par la presse des propositions d’actions de Sarkozy est ici.
Cependant, il y a une certaine résistance de la part d’un tandem bruyant de deux membres très décorés de l’Académie des Sciences française, Claude Allègre étant le plus médiatisé et tapageur des deux. Au cours des dernières années, Vincent Courtillot est apparu comme le fidèle compère d’Allègre –le Dupont de Dupond–, l’aidant à diffuser ses thèses, et en ajoutant aussi des personnelles. Tous deux sont membres de l’Académie des Sciences, et Allègre a reçu à la fois le prix Crafoord et la médaille Bowie. Allègre a une liste impressionnante d’articles ayant sujet à la Terre interne, et fut de plus le Ministre de l’Education Nationale, de la Recherche et de la Technologie sous le gouvernement Jospin. Courtillot –actuellement directeur de l’Institut de Physique du Globe de Paris (IPGP)– a un passé reconnu en recherche fondamentale sur le géomagnétisme, et est actuellement le président de la Section de Géomagnétisme et Paléomagnétisme de l’American Geophysical Union. Leurs opinions ont été largement (certains diraient même plus que largement) exprimées lors d’un colloque sur le rapport du GIEC tenu au printemps dernier à l’Académie (voir le numéro spécial “Evolution des Climats” de la Lettre de l’Académie des Sciences, ainsi que les rapports du Figaro, du Monde et de Libération). Qu’est-ce-que tout cela signifie ? Est-ce que les opinions d’Allègre et Courtillot sont fondées sur une profonde clairvoyance qui aurait échappé à la communauté de scientifiques qui ont consacré leur carrière entière à étudier le climat ? Voyons cela.
When an active scientist of the distinction of Allègre or Courtillot speaks out, the voice has a special claim on our attention, no matter how implausible the claims may seem. It would be a mistake, however, to accept the proclamations of such luminaries on the basis of authority; one must examine the arguments on their merits. Allègre does not publish his arguments on climate in the peer-reviewed scientific literature, so we have to turn to his popular writings and public statements to get a glimpse of what these arguments are. A treasure trove of Allegrisms (Allegrories? Allegrations?) can be conveniently found in a little opus humbly entitled Ma vérité sur la planète (Plon/Fayard:Paris 2007). Many of the things said here merely parrot standard discredited skeptics’ arguments without adding anything new: For example, Allègre at several junctures repeats the old fallacy of confusing unpredictability of weather with the problem of determining how climate responds to changes in radiative forcing: "I have difficulty believing that one could predict with precision the temperatures that will occur a century from now, when we can’t even predict what they will be one week from now." (p.89) He also repeats the fallacy that the lead-lag relation between CO2 and temperature in Antarctic ice cores proves that temperature causes CO2 variations rather than vice-versa — a tired and thoroughly discredited argument (look here for a summary of the rebuttals) . There is little more to say about such arguments, save that Allègre’s willingness to repeat them shows either a remarkable gullibility or a disturbing lack of scientific integrity.
Elsewhere, though, Allègre breaks new ground with regard to passing off nonsense as scientific argument. Here are a few examples.
- Allègre claims that the disappearance of the glaciers on Kilimanjaro is due to moisture supply changes arising from tectonic uplift, and has nothing to do with global warming. This claim appeared over a year ago in Allègre’s column in L’Express, and was discussed in an earlier RealClimate post on Allègre. Essentially, Allègre failed to understand that the tectonic events referred to in the Science paper he cited affected the African climate millions of years ago, whereas the present Kilimanjaro glacier didn’t even come into existence until around 10,000 years ago. The erroneous claim about Kilimanjaro is repeated in Ma vérité sur la planète (p.120), despite ample time and opportunity to correct the mistake. So much for vérité ("his" or otherwise).
- Allègre says that "common sense" casts doubt on the idea that CO2 could have such a controlling effect on climate, because its concentration is only 300 parts per million (p.104). This "common sense" flies in the face of over a century of meticulous physics going back to the time of Tyndall, which shows precisely why certain trace gases have such a strong influence on infrared absorption by the Earth’s atmosphere.
- Allègre says we "know nothing" (p.109) about the Dansgaard-Oeschger events and other form of millennial variability appearing in the ice-core record. From this statement, I think you are supposed to infer that since we "know nothing" about the events it could well be that the current warming is just the latest warm phase of such a thing. To be sure, there’s a great deal still to be learned about millennial variability, but the phenomenon has been the subject of several hundred peer-reviewed scientific papers, dozens of conferences, and a major study by the US National Academy of Sciences. We know enough about the pattern of such events and the mechanisms involved to essentially rule out the possibility that the recent warming is a related form of natural variability. We also know enough to worry about the possibility that climate change due to greenhouse gas increases could trigger massive ocean circulation shifts of the sort that were involved in past millennial variability.
- Allègre says that under an increase of CO2 there would be no warming at the equator, whereas the predicted warming at the equator is in fact only somewhat below the global mean warming. He states correctly that the warming is strongest at the poles, but states without support that a 10ºC warming would be no big deal (p.122). This is quite a startling statement, given that a much more moderate warming has already caused substantial loss of Arctic sea ice. Part of his misconception may come from the fact that he thinks that the temperatures at "the poles" range from "-30 to -60ºC." (p.122) If that were really true, there would be no open water in the Arctic at the time of the sea ice minimum. It is easily verified that this is not the case, and indeed the Arctic commonly gets up to 0ºC in the summer, and sometimes more.
- Ignoring the numerous independent studies of the instrumental record of the past century, he says the Phil Jones analysis of this data has been "put seriously in doubt" (p.100). And by what means? A comparison of Jones’ global mean data with an unpublished analysis of the average of a limited number of hand-picked European stations — presented as the epitome of the Geophysicists’ incomparable expertise at time-series analysis! More on this when we come to discuss Courtillot.
- Helpfully, Allègre advises modellers that "It is necessary to avoid basing predictions of future climate on a global mean whose status is vague." (p.106) Evidently he is unaware that general circulation models have been simulating geographical variations of future wind and temperature changes at least since the 1970’s, and that maps of such changes have been included in every IPCC report going back to the very first. Oh, but I forget. Elsewhere Allègre states that "nobody reads" the IPCC reports (p.115). Evidently, this statement applies to at least one person.
- Continuing his display of ignorance of the modelling enterprise, Allègre wonders why modellers put CO2 in their models, and concludes that it is only because they happen to know how it has varied over the centuries. Could a century of meticulous laboratory and field work documenting the radiative effect of CO2 perhaps have something to do with modellers’ preoccupation with this gas? Evidently not in Allègre’s universe. But there’s more: "Because one doesn’t well understand how clouds form, one neglects them! Because one has not mastered the role of aerosols and dust, one neglects them!" (p.104) This is not at all true. Clouds, aerosols and dust (as well as solar irradiance variations and volcanic eruptions) are all included in modern models. Models that leave out the influence of the CO2 rise fail to reproduce the warming of the past 30 years, and it is precisely for this reason that CO2 is confirmed as the prime culprit in global warming.
- Allègre makes a number of false or misleading statements concerning the contents of the IPCC Fourth Assessment report. He claims that this report (contrary to French media coverage) "considerably toned down" its conclusions compared to previous reports (p.119). By way of evidence, Allègre states "For a doubling of CO2 emissions the temperature of the globe will rise between 2 and 4.5ºC in a century. The previous report said between 1.5 and 6ºC." (p.119) First of all, the IPCC statements on climate sensitivity refer to a doubling of CO2 concentration, not CO2 emissions, but let’s give Allègre the benefit of the doubt and assume this is just another instance of sloppy writing rather than true misunderstanding. Even so, Allègre is mixing up his apples with his pommes de terre in this statement. Though the climate sensitivity range narrowed from 1.5-4.5ºC previously to 2-4.5ºC now, reducing the likelihood of low climate sensitivity, the range of predictions for 2100 remain largely unchanged (and are moreover not strictly comparable between the reports given changes in the way "likelihood" is estimated). In a similar vein, Allègre claims that the IPCC reduced its forecast of sea level rise, which is not the case.
- And there’s more. He says that IPCC has "modified, though not completely abandoned, its argument concerning 20th century temperature rise." (p.119) This evidently refers to Allègre’s belief that one of IPCC’s main arguments has been that CO2 must be responsible for temperature rise because (ben voilà!) they both go up! It’s hard for IPCC to abandon an argument it never made, and in any event the Fourth Assessment Report probably devotes more space to discussing the twentieth century temperature record, using more techniques, than any earlier report. And yes it does (pan to shot of Galileo here, speaking through clenched teeth as he bows before the inquisition) still go up (and by essentially the same amount as previously estimated). Continuing the theme of abandonment, Allègre says that the IPCC has "abandoned" its argument regarding the implications of ice-core CO2 and temperature variations. Actually, not. There is no change in the way IPCC interpreted the Vostok isotope and CO2 curve, which appears both in the 2001 and 2007 reports (the latter with Epica extensions into earlier times). The discussion appears in Chapter 6 of the Fourth Assessment Report (p 444 fig 6.3), but how could Allègre be expected to know that? Nobody reads the IPCC reports, right?
Misconceptions and misrepresentations of the sort given above are liberally supplemented with the usual arsenal of innuendo and quote-mining. Because Christopher Landsea (extravagantly compared to Galileo!) chose to make a scene by resigning from the IPCC, the whole process is deemed to not allow dissent — conveniently ignoring that Lindzen happily stayed on the IPCC Third Assessment Report. An entirely reasonable and uncontroversial statement by Dennis Hartmann on modelling uncertainties is twisted to imply that modellers think we can’t simulate anything with sufficient precision to draw conclusions about future warming (p.105). Quotes on the possible necessity of adaptation measures from MIT’s Ron Prinn and Columbia’s Wally Broecker are used to imply that these two notables favor adaptation over CO2 emissions reduction (p.126). And on the subject of adaptation vs. mitigation, some of Allègre’s statements are downright bizarre: He says that we have nothing to fear from global warming. After all, we adapted to the ozone hole, didn’t we? We adapted to acid rain, didn’t we? (p.127) Well, no actually, we did nothing of the sort. We "adapted" to the ozone hole by passing the Montreal Protocol to control CFC emissions. We "adapted" to acid rain by passing pollution control measures which reduced sulfate emissions. If this is "adaptation," I guess I can just say: ‘d’accord!’ Let’s just "adapt" to global warming by reducing CO2 emissions!
What is to be said of such claims? I couldn’t put it better than Allègre himself: "… une imposture intellectuelle, une escroquerie!" (p.107)
Whatever agenda Allègre is pursuing in his public pronouncements on global warming, it would seem to be very little informed by his scientific expertise. Through his litany of errors, misconceptions and misrepresentations, he has abdicated any claim to be taken seriously as a scientist when he speaks about climate change. And lest Lomborg and similar eco-Pollyannas draw too much comfort from Allègre’s support, let us note that, at the end of the day, Allègre still calls for a 20% reduction in CO2 emissions over the next 20 years. Many of us who wouldn’t touch Allègre’s arguments with a 10 foot baguette would be quite happy if such a plan were enacted in the United States, at least as a first step towards ultimate deeper reductions.
So much for Allègre. Now what of M. Courtilllot? Fortunately, we need not go into nearly so much detail, since almost all of the arguments presented in the Academie debate (see his article in La Lettre de l’Académie des sciences) mirror those given in Allègre’s book. Still, the man manages to add a few wrinkles of his own. For example he confidently declares that the glacial-interglacial CO2 variations are "simply" explained by the effects of temperature on CO2 solubility. He is evidently unaware that this simple mechanism was in fact quite simply evaluated years ago by Wally Broecker — like Allègre, a Crafoord prize winner — and found to be woefully insufficient (see Martin, Archer and Lea, Paleoceanography 2005, for a recent treatment of the subject).
Remember the graph of European temperature in Ma vérité which was supposed to put Phil Jones’ analysis of the instrumental record "seriously in doubt?" Well, it reappears in Courtillot amply decorated with a lot of new verbiage: climate scientists spend all their time modelling and hardly any looking at data; geophysicists are uniquely qualified to look at time series because they do it all the time and anyway they invented most of this stuff in the first place; nobody ever cross-checks or verifies Phil Jones’ work. And patati, and patata, none of which holds a glimmer of truth. But, having declared all this the brave geophysicists of the IPGP decide to take a look for themselves by averaging together a few tens of European weather stations (with a few distant ones from the Urals thrown in for good measure) and ben voilà, how Courtillot is "astonished" that the curve doesn’t look at all like what they were taught it should look like! (Courtillot is evidently a man easily astonished, and equally easily surprised, since these words appear with stunning regularity in his article.)
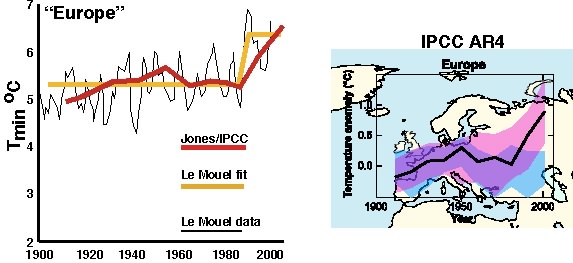
The analysis which evidently shocked Courtillot like a coup de foudre was presented at the Academie debate by Le Mouël (himself an Academician, and holder of the Fleming Medal). A video of his talk is here. Dear reader, I urge you to take a look at this video for yourself and see if you can make any more sense of it than I could, amidst all the mislabeled graphs, bizarre choices of what to compare to what, and missing information about crucial aspects of the data handling. I have done my best to convey what I think is the essence of the argument Le Mouël is trying to make, but it isn’t easy. In the left panel below I reproduce the only graph in which Le Mouël attempts a direct comparison between his data and the Phil Jones analysis which appeared in the IPCC report; it was redrawn by tracing over a freeze-frame of Le Mouël’s presentation. The graph is labeled "European Average" in the presentation, but the data (thin black line) which Le Mouël compares to Jones’ European analysis (red line) is actually from Denmark. Moreover, Le Mouël’s data seems to be monthly (or maybe daily) minima. Why one would want to compare Danish temperature minima with all-Europe temperature means is beyond me, but in the end what Le Mouël is making a big noise about is his claim that the yellow curve fit describes the data better than Phil Jones’ curve. Given the variability, there is really no objective reason to prefer one over the other, but the distinction between the two fits is largely immaterial. What you can take home from Le Mouël’s analysis is that, in Europe, a marked temperature rise does not set in until the 1980’s. Sound familiar? It should, because that is more or less what the IPCC says, pointing out further that natural variability cannot explain the recent warming. This can be seen well in the right panel, taken from the Fourth Assessment report. The blue shaded region is the ensemble of simulations forced by natural variabiity, while the pink shaded region includes anthropogenic forcing. Only the latter reproduces the rise at the end of the record.
The point of a lot of this fiddling with temperature curves is that the Sun must be doing something to control all these fluctuations. That brings us to radiative forcing, and Courtillot and company have had some problems with this issue, since they have a hard time making it look like CO2 is a small forcing and solar variability is a big forcing. One botched attempt at this was to claim that cloud fluctuations swamp CO2; Courtillot claims that clouds cause 80 Watts per square meter of radiative forcing, so that a mere 3% change in cloud cover would cause 2.4 Watts per square meter radiative forcing, which would be comparable to greenhouse gas forcing changes to date. To get this figure, though, Courtillot evidently assumed that all the Earth’s albedo is due to clouds, and moreover neglected the cloud greenhouse effect. When properly calculated, the net cloud radiative forcing is more like 20 Watts per square meter, so a 3% change gives you only 0.6 Watts per square meter, well below the greenhouse gas radiative forcing to date, to say nothing of what is in store for the future.
This flub is nothing compared to the trouble Courtillot’s collaborator Le Mouël got into during the debates, when he was trying to show that the 1 Watt per square meter variation in the Solar irradiance over the solar cycle is fully half the greenhouse gas forcing. Well, there is the little matter that Le Mouël forgot to take into account the sphericity of the Earth (which means divide the solar irradiance by 4) or its reflectivity (which means take 70% of the result). As the Le Monde reporter archly noted, Le Mouël’s calculation assumes a black flat Earth, but, "Hélas! La Terre est ronde" (zut alors!). Le Mouël seems eager to follow in Allègre’s geometrically-challenged footsteps: In a 1988 book (12 clés pour la géologie, Belin:Paris), Allègre confidently stated that the pole to equator temperature gradient was due to snow albedo and atmospheric absorption, making no mention of the role of the Earth’s spherical geometry, which is far and away the dominant factor (and the reason there’s ice at the poles to make a high albedo). Messieurs, here’s a little hint: What does the "G" stand for in "IPGP?"
The round Earth having robbed him of his 1 Watt per square meter –which in any event is mostly averaged out over the relatively short solar cycle leaving a miniscule tenth of a Watt variation between cycles — Courtillot grasps at the possibility some unknown and unquantified nonlinear mechanism for turning the very high frequency solar variability into a century scale trend.
There is also a bit of nattering about Moberg’s take on the Hockey stick, the supposed considerable warmth of the Medieval Warm Period, and some supposed millennial solar variability which supposedly accounts for why the present warming sort of looks like Moberg’s take on the Medieval Warm. Even leaving aside evidence that Moberg’s method exaggerates variability (see Mann, Rutherford, Wahl and Ammann 2005, available here), the "blame the Sun" mantra falls apart because neither the Sun nor cosmic rays have been exhibiting any trend that could conceivably account for the recent warming, as we have discussed in many places on RealClimate (most recently here).
With regard to climate, Courtillot’s main claim to fame is not found in his article in La Lettre. For that we have to look to a paper recently published in EPSL, which claims that climate variations are closely tied to the geomagnetic field. How convincing is this work? That will be the subject of Part II.
Quand un scientifique actif aussi distingué qu’Allègre ou Courtillot s’exprime, sa parole capte notre attention, quelle que soit sa pertinence. Ce serait néanmoins une erreur d’accepter les affirmations de tels phares uniquement à cause de leur renommée; on doit contrôler les arguments sur leurs mérites. Allègre ne publie pas ses idées sur le climat dans la littérature scientifique, de sorte que nous devons nous contenter de ses écrits de vulgarisation et déclarations publiques afin d’avoir un aperçu de ces arguments. Un trésor de ces allègreries (allègritudes ?, allègrations ?) est facilement accessible dans un petit ouvrage humblement intitulé Ma vérité sur la planète (Plon/Fayard, Paris, 2007). Beaucoup de choses que l’on y trouve ne sont que rabâchage d’arguments standard de sceptiques, arguments complétement discrédités auxquels il n’apporte rien de neuf. Par exemple : il répète à plusieurs endroits l’erreur classique de confondre le caractère imprévisible de la météorologie avec la détermination de la réponse du climat au forçage radiatif : « J’ai peine à croire qu’on puisse prédire avec précision le temps qu’il fera dans un siècle alors qu’on ne peut pas prévoir celui qu’il fera dans une semaine » (p.89). Il répète également le raisonnement faux que les relations de phase entre CO2 et température mesurés dans les carottes de glace de l’Antarctique prouvent que c’est la température qui est responsable des variations de CO2 plutôt que l’inverse – un raisonnement éculé et largement discrédité (lire ici un résumé des contre-arguments). Il y a peu de choses à ajouter sur ces arguments, sauf que la capacité d’Allègre à les répéter indique soit une remaquable crédulité, soit un inquiétant manque d’intégrité scientifique.
Ailleurs, pourtant, Allègre excelle dans l’art de servir des balivernes comme arguments scientifiques. En voici quelques exemples.
- Allègre affirme que la disparition des glaciers du Kilimandjaro est due à un changement des apports de vapeur d’eau causé par le soulèvement tectonique, et n’a rien à voir avec le réchauffement global. Cette affirmation est apparue il y a un peu plus d’un an dans la chronique d’Allègre dans l’Express, et a été discutée dans un article précédent de RealClimate au sujet d’Allègre. Pour l’essentiel, Allègre passe à côté du fait que les événements tectoniques dontil est question dans l’article cité de Science ont modifié le climat africain il y a plusieurs millions d’années, alors même que le glacier actuel du kilimandjaro est apparu il y a seulement 10 000 ans. Cette affirmation erronée au sujet du Kilimandjaro est répétée dans Ma vérité sur la planète (p.120), bien qu’il ait eu suffisamment de temps et d’opportunités pour corriger cette erreur. Autant pour la ‘vérité‘ (la sienne ou une autre).
- Allègre soutient que le ‘bon sens’ permet de mettre en doute l’idée que le CO2 puisse autant contrôler le climat parce que sa concentration est seulement de 300 parties par million (p.104). Ce ‘bon sens’ bouscule plus d’un siècle de physique méticuleuse qui remonte à l’époque de Tyndall et qui montre précisément pourquoi certains gaz à l’état de trace influencent si fortement l’absorption des infra-rouges par l’atmosphère.
- Allègre dit qu’on ne « sait rien » (p.109) sur les événements de Dansgaard-Oeschger et autre type de variabilité millénaire existant dans les carottes de glace. De cette affirmation, je suppose que nous sommes censés déduire que, comme on ne « sait rien » sur ces événements, il se pourrait bien que le réchauffement actuel soit juste la dernière phase de l’un d’eux. Bien sûr, il y a encore beaucoup de choses à apprendre sur la variabilité millénaire, mais ce phénomène a fait l’objet de plusieurs centaines de publications scientifiques, douzaines de conférences, ainsi qu’une synthèse majeure par l’Académie des Sciences américaine. Nous en savons assez sur la structure de ces événements et leurs mécanismes pour tout écarter la possibilité que le réchauffement récent provienne simplement de ce type de variabilité naturelle. Nous en savons également assez pour nous inquiéter de la possibilité que le changement climatique dû à l’augmentation des gaz à effet de serre puisse déclencher un de ces changements majeurs de la circulation océanique qui ont participé à la variabilité millénaire dans le passé.
- Allègre annonce qu’avec une augmentation du CO2 il ne devrait pas y avoir de réchauffement à l’équateur, alors que le réchauffement prédit à l’équateur n’est que légèrement inférieur à la moyenne globale. Il affirme correctement que le réchauffement est plus fort aux pôles, mais aussi, et sans justification, qu’un réchauffement de 10ºC serait sans importance (p.122). C’est une affirmation plutôt surprenante puisqu’un réchauffement bien plus faible est déjà responsable d’une disparition notable de la glace de mer en Arctique. Cette conception erronée pourrait provenir en partie du fait qu’il pense que la température « aux pôles » varie entre « -30 et -60ºC » (p.122). Si c’était vrai, il n’y aurait pas d’eau libre en Arctique pendant le minimum de couverture de glace de mer. Il est facile de vérifier que ce n’est pas le cas, et en fait l’Arctique monte souvent jusqu’à 0ºC, et parfois au-delà.
- Ignorant les nombreuses études indépendantes des mesures sur le dernier siècle, il soutient que l’analyse de Phil Jones de ces données a été « fortement mise en doute » (p.100). Et par quel moyen ? Par une comparaison entre les données globales de Phil Jones et une analyse non publiée des moyennes d’un petit nombre de stations européennes – présentée comme l’archétype de l’expertise incomparable des Géophysiciens en analyse de séries temporelles ! Nous y reviendrons à propos de Courtillot.
- Très obligeamment, Allègre conseille aux modélisateurs : « Il faut donc éviter de fonder les prédictions du climat futur sur une moyenne mondiale dont la situation est floue. » (p.106). Visiblement il n’est pas au courant que, depuis au moins les années 70, les modèles de circulation générale simulent des champs spatialisés des prévisions de vent et de température, et que des cartes de ces changements ont été incluses dans tous les rapports du GIEC depuis le premier. Oh, mais j’oubliais. Ailleurs, Allègre assène que « personne ne lit » (p.115) les rapports du GIEC. Visiblement, cette déclaration s’applique au moins à une personne.
- Continuant d’étaler son ignorance de la modélisation, Allègre se demande pourquoi les modélisateurs ont inclus le CO2 dans leurs modèles, et en conclut que c’est uniquement parce qu’ils connaissent ses variations sur les derniers siècles. Est-ce-qu’un siècle de travail méticuleux en laboratoire et sur le terrain passé à documenter l’effet radiatif du CO2 aurait peut-être à voir avec l’attrait des modélisateurs pour ce gaz ? Visiblement pas dans l’univers d’Allègre. Mais il y a mieux : « Comme on ne sait pas bien comment se forment les nuages, on les néglige ! Comme on maîtrise mal le rôle des aérosols et des poussières, on les néglige ! » (p.104) C’est complètement faux. Nuages, aérosols et poussières (comme variations de l’irradiance solaire et éruptions volcaniques) sont tous pris en compte par les modèles actuels. Les modèles qui négligent l’influence de l’augmentation du CO2 n’arrivent pas à reproduire le réchauffement des derniers trente ans, et c’est précisément pour cette raison que le CO2 a été confirmé comme le responsable principal du réchauffement global.
- Allègre fait un certain nombre de déclarations fausses ou fallacieuses sur le contenu du Quatrième Rapport d’Evaluation du GIEC. Il assure, contrairement aux médias français, que ce rapport « est beaucoup plus modéré que les précédents. » (p.119) Ainsi, Allègre assure que « Pour un doublement des émissions de CO2 , la température du globe augmenterait de 2 à 4,5ºC en un siècle. Le précédent rapport disait entre 1,5 et 6ºC. » (p.119) En premier lieu, les déclarations du GIEC sur la sensibilité climatique font référence à un doublement de la concentration en CO2, pas de ses émissions, mais laissons à Allègre le bénéfice du doute et supposons qu’il ne s’agit que d’une autre coquille et pas d’une véritable incompréhension. Tout de même, Allègre mélange ici des pommes et des frites. Même si la fourchette de la sensibilité climatique a été réduite, passant de 1,5 – 4,5ºC à 2 – 4,5ºC, ce qui diminue ainsi la probabilité d’une faible sensibilité, la fourchette des prévisions pour l’année 2100 n’a presque pas changé (de plus la définition probabiliste de cette fourchette a varié entre les rapports, elles ne sont donc pas directement comparables). Dans la même veine, Allègre assure que le GIEC a réduit ses prévisions de hausse du niveau marin, ce qui n’est pas le cas (voir ici).
- Mais il y a mieux. Il dit que le GIEC « modère sans encore l’abandonner l’argument d’évolution de la température depuis le XIXe siècle. » (p.119) Ceci correspond évidemment à la croyance d’Allègre que l’un des principaux arguments du GIEC est que le CO2 doit être responsable de l’augmentation de température parce que (ben voilà !) tous deux augmentent ! Il est difficile au GIEC d’abandonner un argument qui n’a jamais été le sien, et en tout cas le Quatrième Rapport d’Evaluation fait probablement plus de place à la discussion des enregistrements de température sur le 20e siècle, en utilisant plus de techniques, qu’aucun des rapports précédents. Et pourtant (on pense ici à Galilée, parlant en serrant les dents tout en s’inclinant devant l’Inquisition) elle augmente bien (et en suivant pratiquement les prévisions). Poursuivant sur le thème du renoncement supposé du GIEC, Allègre assure que celui-ci a « abandonné » son argumentation basée sur les variations de CO2 et de température enregistrées par les glace. Rien de tout cela. Il n’y a pas eu de changement d’interprétation par le GIEC des courbes isotopiques et du CO2 de Vostok, interprétation qui apparait dans les deux rapports de 2001 et 2007 (avec, dans ce dernier, l’extension d’EPICA à des périodes plus anciennes). Cette discussion se trouve au chapitre 6 du Quatrième Rapport d’Evaluation (p.444, figure 6.3), mais comment pourrait-on s’attendre à ce qu’Allègre sache cela, puisque personne ne lit le rapport du GIEC, n’est-ce-pas ?
De telles idées fausses et déformations de la réalité comme celles exposées ci-dessus sont généreusement accompagnées de l’arsenal habituel d’insinuations et de citations abusives. Parce que Christopher Landsea (comparé de manière extravagante à Galilée !) a choisi de faire toute une scène de sa démission du GIEC, le processus dans son ensemble est jugé opposé à toute dissidence – ignorant de manière opportune que Lindzen lui est resté tranquillement tout au long du Troisième Rapport d’Evaluation du GIEC. Une affirmation de Dennis Hartmann, tout à fait justifiée et incontestable, sur les incertitudes de la modélisation est détournée afin d’insinuer que les modélisateurs ne croient pas possible d’obtenir suffisamment de précision pour tirer des conclusions sur le réchauffement futur (p.105). Des citations sur la possible nécessité de mesures d’adaptation, venant de Ron Prinn du MIT et de Wally Broecker de Columbia, sont utilisées afin d’insinuer que ces deux célébrités favorisent l’adaptation sur la réduction des émissions de CO2 (p.126). Et sur le sujet de l’adaptation par rapport à l’atténuation, certaines affirmations d’Allègre sont franchement saugrenues : il soutient que nous n’avons rien à craindre du réchauffement global. Après tout, nous nous sommes adaptés au trou d’ozone, n’est-ce pas ? Nous nous sommes adaptés aux pluies acides, n’est-ce pas ? (p.127) Et bien, non en fait, nous n’avons rien fait de tout cela. Nous nous sommes ‘adaptés’ au trou d’ozone en adoptant le protocole de Montréal pour contrôler les émissions de CFC. Nous nous sommes ‘adaptés’ aux pluies acides en adoptant des mesures de contrôle des rejets soufrés. Si c’est ça ‘s’adapter’, je pense que je peux juste dire : « D’accord ! ‘Adaptons’-nous au réchauffement global en réduisant les émissions de CO2 ! »
Que peut-on dire de toutes ces affirmations ? Je ne pourrais le faire mieux qu’Allègre lui-même : «…une imposture intellectuelle, une escroquerie ! » (p.107)
Quel que soit le plan d’Allègre dans ses annonces publiques, celles-ci semblent peu fondées sur son expertise scientifique. Avec sa litanie d’erreurs, d’idées fausses et de déformations de la réalité, il a renoncé à toute prétention d’être considéré sérieusement en tant que scientifique lorsqu’il parle du changement climatique. Et si même Lomborg et autres éco-polyannas bénéficient trop du soutien d’Allègre, notons que, au final, Allègre appelle quand même à une réduction de 20% des émissions de CO2 sur les vingt prochaines années. Nombre d’entre nous qui se refuseraient à toucher aux arguments d’Allègre, même avec un bâton de 3 m, seraient très heureux si un tel plan était mis en oeuvre aux Etats Unis, au moins comme un premier pas vers des réductions plus drastiques.
Voici donc pour Allègre. Maintenant que dire au sujet de M. Courtillot ? Heureusement il ne nous est pas nécessaire d’aller si loin dans les détails, car pratiquement tous les arguments présentés au débat à l’Académie (voir son article dans La Lettre de l’Académie des sciences) reflètent ceux du livre d’Allègre. Pourtant, notre homme parvient à ajouter quelques marques de son cru. Par exemple il déclare, sûr de lui, que les variations glaciaires-interglaciaires du CO2 sont « tout simplement » dues à l’effet de la température sur la solubilité du CO2. Il n’est donc pas au courant que ce mécanisme de base a été évalué il y a bien des années par Wally Broecker –comme Allègre, un détenteur du prix Crafoord– et a été estimé vraiment insuffisant (voir Martin, Archer et Lea, Paleoceanography 2005, pour un récent bilan sur ce sujet).
Vous vous souvenez du graphe de la température européenne dans Ma Vérité, qui devait remettre « fortement en doute » l’analyse de Phil Jones des enregistrements de température ? Et bien il réapparait avec Courtillot très enrichi par de nouveaux verbiages : les scientifiques du climat passent tout leur temps à modéliser et pratiquement pas à observer; les géophysiciens sont les seuls qualifiés à étudier les séries temporelles car ils le font sans arrêt et de toute façon ils ont pratiquement tout inventé en premier dans ce domaine; personne n’a jamais contrôlé ou vérifié le travail de Phil Jones. Et patati, et patata, rien de tout cela n’ayant une once de vérité. Mais, après avoir déclaré tout cela, les braves géophysiciens de l’IPGP décidèrent de regarder par eux-mêmes en moyennant quelques dizaines de stations météorologiques européennes (additionnées de quelques stations éloignées en Oural pour faire bonne mesure), et ben voilà, Courtillot est “étonné” que la courbe ne ressemble pas à ce qu’on leur avait appris ! (Courtillot est visiblement quelqu’un de facilement étonné, et autant surpris, car ces mots apparaissent avec une régularité stupéfiante dans son article).
Cette analyse, qui frappa Courtillot d’un vrai ‘coup de foudre‘, fut présentée lors du débat à l’Académie par Le Mouël (lui-même académicien, et détenteur de la médaille Fleming). Une vidéo de cette présentation se trouve ici. Cher lecteur, je vous presse de regarder cette vidéo afin de voir si vous pouvez en tirer plus de sens que je ne l’ai pu, parmi tous les graphes mal annotés, les choix étranges des comparaisons, et les informations qui manquent sur certains aspects cruciaux du traitement des données. J’ai fait de mon mieux pour présenter ce que je pense être l’essence de l’argumentation de Le Mouël, mais ce n’est pas facile. Sur la partie gauche de l’image ci-dessous j’ai reproduit le seul graphe dans lequel Le Mouël tente une comparaison directe entre ses données et l’analyse de Phil Jones parue dans le rapport du GIEC; ce graphe a été décalqué sur un des plans de la vidéo de la présentation. Le graphe est titré “Moyenne de l’Europe” dans la présentation, mais les données (courbe noire) que Le Mouël compare à l’analyse européenne de Phil Jones (trait rouge) sont en fait celles du Danemark. De plus, les données de Le Mouël semblent correspondre à des minima mensuels (ou journaliers peut-être). Pourquoi voudrait-on comparer les minima de température au Danemark avec la moyenne de température de toute l’Europe, cela me dépasse, mais finalement ce dont Le Mouël fait grand bruit c’est l’affirmation que la courbe jaune est une meilleure approximation des données que la courbe de Phil Jones. En considérant la variabilité, il n’y a vraiment pas de raison objective de préférer l’une à l’autre, la distinction entre les deux approximations est complètement irréelle. Le message de l’analyse de Le Mouël est qu’en Europe une augmentation marquée de la température n’apparaît pas avant les années 80. Déjà entendu quelque part ? Vous devriez, car ceci correspond plus ou moins à ce que dit le GIEC, qui conclut de plus que la variabilité naturelle ne peut expliquer le réchauffement récent. Ceci est bien visible sur le graphe de droite tiré du Quatrième Rapport d’Evaluation du GIEC. La zone ombrée en bleu correspond à un ensemble de simulations forcées par la variabilité naturelle, tandis que celle en rose inclut aussi le forçage anthropique. Seule cette dernière reproduit l’augmentation de la fin de l’enregistrement. Bien loin de bousculer les conventions, Le Mouël a en fait montré qu’une simple moyenne d’un jeu limité de données confirme largement l’analyse de Phil Jones – une ‘prouesse’, si l’on réalise qu’en considérant une région aussi petite que l’Europe, la tendance anthropogénique est bien plus difficile à distinguer de la variabilité naturelle due à la circulation.
Le but de tout ce trafic avec les courbes de température est que le soleil doit en être pour quelque chose dans ces fluctuations. Ce qui nous amène au forçage radiatif, où Courtillot et consorts ont eu quelques problèmes sur ce point, car il leur a été très difficile de faire passer le CO2 pour un forçage mineur et la variabilité solaire pour un forçage majeur. Un essai baclé dans ce sens a été de prétendre que les variations des nuages surpassaient le CO2 : Courtillot prétend que les nuages sont responsables d’un forçage radiatif de 80 watts par mètre carré, de sorte qu’un changement aussi faible que 3% de la couverture nuageuse induirait un forçage radiatif de 2,4 watts par mètre carré, comparable à celui actuel des gaz à effet de serre. Mais pour obtenir ce chiffre, Courtillot a évidemment supposé que l’albédo terrestre est entièrement dû aux nuages, et de plus il a négligé l’effet de serre des nuages. Calculé correctement, le forçage radiatif net des nuages est plutôt de 20 watts par mètre carré, de sorte qu’une variation de 3% donne seulement 0,6 watts par mètre carré, très inférieur au forçage radiatif actuel des gaz à effet de serre, sans même parler de celui qui nous attend.
Cette gaffe n’est rien en comparaison de la difficulté éprouvée pendant les débats par Le Mouël, qui collabore avec Courtillot, lorsqu’il essaya de montrer que la variation de 1 watt par mètre carré de l’irradiance solaire au cours d’un cycle solaire représente vraiment la moitié du forçage des gaz à effet de serre. Bon, il y a un détail que Le Mouël oublie de prendre en compte, c’est la sphéricité de la Terre (ce qui implique de diviser l’irradiance solaire par 4) ou sa réflectance (ce qui implique de prendre 70% du résultat). Comme le reporter du Monde le soulignait malicieusement, le calcul de Le Mouël suppose une Terre noire et plate, mais “Hélas! La Terre est ronde” (zut alors !). Le Mouël semble ainsi suivre avec ferveur Allègre dans ses mauvais pas en géométrie : dans un livre de 1988 (12 clés pour la géologie, Belin/Paris), Allègre affirme sûr de lui que le gradient de température entre les pôles et l’équateur est dû à l’albédo de la neige et à l’absorption de l’atmosphère, ne faisant aucune mention du rôle de la géométrie sphérique de la Terre, qui est de loin le facteur dominant (et la raison de la présence aux pôles de glace avec un albédo élevé). Messieurs, voici un indice : que veut dire le ‘G’ de ‘IPGP’ ?
La rotondité de la Terre l’ayant privé de son 1 watt par mètre carré –qui de toute façon est pratiquement moyenné au cours d’un cycle solaire et ne laisse qu’un dixième de watt par mètre carré entre les cycles– Courtillot se raccrocha à la possibilité d’un mécanisme non linéaire, inconnu et non quantifié, pour transformer la variabilité solaire haute fréquence en une tendance sur un siècle.
Il y a également quelques bavardages sur la position de Moberg sur la ‘crosse de hockey’, la prétendue période très chaude de l’Optimum Médiéval, et une supposée variabilité solaire millénaire qui devrait expliquer pourquoi le réchauffement récent correspond plus ou moins à l’explication de Moberg de l’Optimum Médiéval. Mises à part quelques indications que la méthode utilisée par Moberg surestime la variabilité (voir Mann, Rutherford, Wahl et Ammann 2005, disponible ici), le mantra du “C’est la faute au soleil” s’effondre puisque ni le soleil ni les rayons cosmiques ne montrent de tendance pouvant expliquer le réchauffement des dernières décennies, comme nous en avons discuté à plusieurs reprises sur RealClimate (le plus récemment ici).
Pour ce qui est du climat, les faits de gloire de Courtillot ne se trouvent pas dans son article de La Lettre de l’Académie. Pour cela nous devons nous tourner vers un article récemment publié dans EPSL, article qui prétend que les changements climatiques sont étroitement liés au champ géomagnétique. Ce travail est-il convaincant ? Ce sera le sujet de la seconde partie.
#149 Nick Gotts: Energy derived from carbon-intensive sources has to become much more expensive – at a rate at least matching the rate at which efficicency improves.
Terrapass today is selling carbon credits for about $10/ton. It costs $80 to offset a year of driving a Hummer. At $100/ton, it would cost $800. Still not causing pain to a driver dropping $3500 a year on gas. At $1000/ton, CO2 offsets would cost twice what gas for the car cost.
Perpaphs that is starting to hurt at that point.
Industry has to buy quota, they of course pass on the cost to their customers – when you buy most goods, you don’t have to pay GHG credits, because their cost is embedded in the price.
But what target are you hoping to acheive? If we need to reduce per-capita CO2 output to under 1T/person to account for the rest of the world coming on line, the even France is looking at needing a 90% reduction.
If we’re relying on fossil fuel, then reducing our fuel consumption by 90% will be impossible and taxing won’t make that pill any easier to swallow.
If instead we’re relying on some alt energy that doesn’t produce CO2 and is “just” 20-30% more expensive than fossil fuel today, then taxing isn’t required because we have all the energy we need for just 20-30% more. And in 10-20 years, as improvements come and scale kicks in, then alt energy is likely cheaper than fossil fuel. At that point, there is little incentive to save. Drive your electric car wherever you want. Leave lights on all night. If you have the money, you can get the energy.
And yes, you can bet there will still be massive electric SUVs…
Staying on fossil fuels is really the only path that requires extreme conservation in the long term. The alt energy path, once solved, means everyone consumes more than ever before.
[Response: This comment brings out the important point that a carbon tax of any likely magnitude would have only minimal effects on driving habits. The main impact of a carbon tax would be on coal, and that’s perhaps as it should be. –raypierre]
Jim Cripwell, If you have a physical system with both positive and negative feedback, it is possible that it may be relatively immune to small perturbations. However, if you push beyond a certain amount, the positive feedback kicks in with a vengeance–a tipping point.
Climate has both positive and negative feedbacks, and albedo effects due to polar ice, emission of ghg from peat bogs, etc. are among them. The fact that you don’t believe in “tipping points” is irrelevant. They exist and they are important.
Re the Accumulated Cyclone Energy index, iirc there was a recent study out of MIT’s Earth and Planetary Sciences department that showed a strong upward trend in the ACE curve over the last few decades.
I’m a bit confused on how GHG’s actually warm our atmosphere. I am fairly educated in thermodynamics and have a decent understanding of radiation, the confusion lies in the amount of GHG’s compared to total mass of the atmosphere. Perhaps someone here can help make things clear.
A few givens. CO2 in our atmosphere has a mass of about 750 billion tons. Water vapor at any given moment is about 13,000 billion tons, and the whole atmosphere’s mass is about 5,000,000 billion tons.
How do GHG’s warm the air surrounding them? How can 750 billion tons of CO2 have so much influence on 5,000,000 billion tons of N2 and O2?
I have heard that without CO2 and Water vapor our atmosphere would be 30 C cooler. Is this true and how? It does not make sense that a fraction of a percent of the atmosphere has so much influence.
Regards,
Steve
Barton Paul Levenson wrote: “And a small pill will provide all the nutrition of a full meal.”
I am reminded of the Mystery Science Theater 3000 episode in which the crew of the Satellite of Love encountered “advanced” space aliens who boasted that they no longer needed to consume food, having developed a pill that provides perfect nutrition.
Wow, exclaim the SOL crew — so you can just take one little pill instead of eating three meals a day?
Are you crazy? You’d starve that way! reply the aliens — as we see them holding big overflowing bowls from which they are shoveling hundreds of pills into their mouths.
A lot of proposed silver bullet techno-solutions to global warming remind me of this.
Re #154: [It does not make sense that a fraction of a percent of the atmosphere has so much influence.]
Do you perhaps have low-E windows on your house? That coating is a tiny fraction of the mass of the glass, but changes the energy balance dramatically.
GHGs act somewhat like that coating. They let in visible light from the sun, but block infrared. The visible light hits the ground, warms it up, and the energy’s re-radiated in the infrared. But the GHGs don’t let the infrared out, so it gets warmer. Think of it as wrapping the planet in one of those lightweight space blankets.
Steve, You can find a good treatment here:
https://www.realclimate.org/index.php/archives/2007/06/a-saturated-gassy-argument-part-ii/
However, to summarize, once a CO2 molecule absorbs an IR photon, it is much more likely to relax collisionally than radiatively. You have energy that stays in the atmosphere, so Earth must warm until its temperature rises sufficiently to radiate away enough energy to reach equilibrium again.
Re # 156 James “Think of it as wrapping the planet in one of those lightweight space blankets.”
Plese correct me if I’m wrong, but I’m pretty sure space blankets work by reflecting IR body heat back to the body – they don’t let solar (or terrestrial longwave) IR in.
Re 153
Regardless of teh trend over the last two decades, the last two seasons were extremely quiet on the ACE front. 2005 was extremely strong. 2006 was predicted to be above average and wasn’t. 2007 was predicted to be above average and was a dud. only 1977 was lower than 2007. This again says something about the ability to model the strength of a season.
As for number of storms, there’s a serious discussion ongoing about just how accurately storms were counted in the past. The number of storms that have made landfall is unchanged. but more non-landfalling storms exist now (which could be due to better tracking capabilities and not an increase in storms).
Looking at this year’s list of storms, i have serious doubts about whether the first storm would have been included in previous years. it was classified at the time as a sub-tropical storm (a cold front that’s moved off land and strengthend a bit), but was given a name. In years past, when the number of storms had no political implications whatsoever, i doubt that would have happened. But people now have an investment in having as many storms as possible.
[Response: Where is the evidence for such a ridiculous claim? Storm names are assigned by NHC and I think that they would take great offense at being accused of doing it for any non-scientific reason. – gavin]
[Response: This is off topic, and mostly nonsense. Take it elsewhere. – mike]
Re #151 (Matt) “If we’re relying on fossil fuel, then reducing our fuel consumption by 90% will be impossible and taxing won’t make that pill any easier to swallow.”
We need to combine reducing consumption with building up low-carbon energy sources. Neither on its own will be enough; both just might be.
“Staying on fossil fuels is really the only path that requires extreme conservation in the long term. The alt energy path, once solved, means everyone consumes more than ever before.”
I agree it will be nice when we have an unlimited source of energy with no adverse environmental consequences – but I’m not holding my breath.
James, Ray,
So is it only IR radiation being trapped that causes the temps to rise? I ask because CO2 only makes up 750 billion tons of the 5,000,000 billion tons of atmosphere.
That seems like a very small amount of mass that “traps” IR radiation and then warms the mass around it. It takes huge amounts of energy to raise 5,000,000 billion tons of N2 and O2 one degree, that amount of energy cannot come from such a small amount of CO2 unless the temp of the CO2 is millions of degrees.
We know this is not the case. How is 5,000,000 billion tons of N2 and O2 warmed? Does radiation striking the molecules create kinetic energy that is transferred into heat energy? Do GHG gasses simply add to that energy?
I’m not asking these questions because I am clueless, the coatings on windows act more like aerosols than CO2 reflecting energy not trapping it.
I’d like to know how 5,000,000 billion tons of N2 and O2 is warmed by 750 billion tons of CO2.
Regards,
Steve
[Response: The atmosphere is warm because of all the IR absorbers (incl CO2, but also water vapour, clouds, aerosols, ozone and CH4). Your premise that small things can’t have big effects is a fallacy as has been pointed out. – gavin]
“However, to summarize, once a CO2 molecule absorbs an IR photon, it is much more likely to relax collisionally than radiatively. You have energy that stays in the atmosphere, so Earth must warm until its temperature rises sufficiently to radiate away enough energy to reach equilibrium again.”
Just to clarify Ray’s comment what he describes is what happens near the surface, the higher up in the atmosphere the CO2 is, the higher the probability that it will radiate rather than collisionally transfer. In the upper Stratosphere mostly radiation takes place which is why the upper stratosphere has cooled as [CO2] has increased.
If the skeptics were right, how would we know?
Is there a generally accepted 95% or 90% lower bound on warming over the next 20 years?
If I wanted to make a wager with somebody as to whether or not the current global warming consensus is correct, and I wanted payment to occur on a 20 year time frame, what set of numbers could I use?
Gavin,
Fallacy? Can you tell me why or point me to a source of information? No need to dumb down for me, I have a decent understanding of physics and will be able to understand your response or papers that reflect your argument.
Okay, so how does ~750 billion tons of CO2, ~13,000 billion tons of Water vapor, and less than 15 billion tons of CH4 warm 5,000,000 billion tons of N2 and O2?
Ozone cannot play a significant part in warming the troposphere in such small quantities and it’s half life is severely degraded in the presence of water vapor.
Even in the Stratosphere, where the top layers approach 0 C, the amount of energy “trapped” by O3 is quite low due to very low amounts of mass to absorb it.
Regards,
Steve
[Response: The comment boxes are not a good place to make up for the deficiencies in your education. For one thing, it’s hard to put in the needed equations and figures. If you are sincere about learning this basic material, buy a copy of Dave Archer’s book (if you want the non-calculus version of the explanation) or read the online draft of my own book (follow the ClimateBook link on my home page; look at Chapters 3 and 4). This is all very well established stuff, explained adequately in readily accessible textbooks. –raypierre]
Hi Nick: I’ll put money on the 2008 minimum being lower than any previous record [2007 is excluded].
OK, there is enough variability that I think this is a good bet and I’ll take it at 50 euros. I do want to make it clear I’m not doing this to challenge the virtual certainty of GW and high probability of AGW, rather I think most here at RC exaggerate the implications of measurements to think we are at tipping points and are approaching catastrophic conditions that are not suggested by the data. I apologize to Dave for being so snippy above but it’s frustrating when you suggested I was a troll who does not follow up, only to hopelessly misquote the paper you cited for me to check out. Bets like this are a *great way* to see what people really believe. Dave – I’ve got another 50 euros to bet you as well.
I think there are escrow things for this, though I’m also willing to do a virtual “handshake” here in public with you with the bet to be settled next year as soon as the data is in.
Re # 162
Phil,
The Stratosphere has cooled not because of increased CO2 but rather decreased O3.
Regards,
Steve
[Response: You are wrong. Changes in O3 have played a role, but so has increase of CO2. The relative roles of the two depend on which altitude you are looking at.–raypierre]
#159 & (re hurricanes) “Regardless of the trend over the last two decades, the last two seasons were extremely quiet”
I’m no meteorologist or climate scientist, but my understanding has it this way: warm waters are a necessary, but not sufficient cause for hurricanes, and likewise warmer waters are a necessary condition for greater hurricane intensity. It is accepted that global warming is warming the oceans, so the conditions (necessary causes) for hurricanes and more intense hurricanes are increasing. Now, if the other factors that would amount to sufficient causes are not present (and I frankly don’t know about these very much), then a hurricane will not happen. GW is just making them more likely to happen and to become more intense, assuming the other (sufficient causal) factors kick in beyond this necessary cause of warm water. I know it’s a lot more complex than this….
Another way I look at it is that there are 2 forms of energy — kinetic and heat — and hurricanes sort of take that heat energy and turn it into kinetic energy. You might expect under some conditions that heat from the ocean could be translated into the action of hurricanes (I guess that’s also the principle of our internal combustion engines).
RE # 156 & 158, I say we keep the space blanket analogy, not for the daytime when the sun is shining, but for the nighttime. We could call it the “blanket effect.” And I think that’s why the nights are warming somewhat faster than the days (please correct me if I’m wrong on this). Also this is why heat deaths tend to soar up during heat waves — people are not able to recouperate from that day’s heat during the nights as much anymore, since they are not as cool as they used to be. That’s what I read somewhere. And are winters (when there’s less sunshine) warming somewhat faster than summers??? I’m not sure.
[Response: The space blanket analogy is no good for two reasons. The first is that space blankets block both infrared and visible. To get a greenhouse effect you need something that lets most of the sunlight in but affects the rate at which infrared is going out. The second problem with the space blanket is that it works (insofar as it works at all) by reflecting infrared whereas greenhouse gases work by absorbing and re-emitting. For that matter, it’s never been all that clear to me that the infrared reflective aspect of space blankets is all that important in typical survival conditions. That’s because evaporative and turbulent sensible heat loss is the main energy loss for a person on the surface of the Earth. The space blanket does nothing for sensible heat loss since its temperature is more or less the same as the body. The space blanket eliminates evaporation, but a plain sheet of saran wrap would do that as well. I suppose a space blanket could be useful on a cold, very calm night out in the desert, where IR loss is a bigger part of the total.
On the other hand, if the only point of the example is to answer Mr. Steve’s query about how a very small proportion of mass can strongly affect infrared, either the space blanket or low-E window example does nicely. If an individual atom has a sufficiently high cross-section for infrared absorption, an infrared photon only has to encounter two or three molecules on its way out through the whole depth of the atmosphere in order to be strongly effected. ]
“Re # 162
Phil,
The Stratosphere has cooled not because of increased CO2 but rather decreased O3.
Regards,
Steve
[Response: You are wrong. Changes in O3 have played a role, but so has increase of CO2. The relative roles of the two depend on which altitude you are looking at.–raypierre]
Thanks raypierre, I specifically said ‘upper stratosphere’ for that reason.
Re #161 and Steve’s incredulity:
A molecule of CO2 absorbing a single ~15micron photon will be rovibronically excited by ~1×10^-20 J, or about 6 kJ/mole. That excited molecule will undergo about 7 collisions with N2 & O2 per nanosec and so very rapidly be quenched and be able to absorb another photon (lets say 10ns). Consequently a single mole of CO2 (44 grams) has the capability of pumping a huge amount of energy into the atmosphere without being excited beyond the first vibrational level.
Joe Duck @165. Right then, we’re on. If Cryosphere Today reports a 2008 minimum area of more than 4.01 million square kilometres, I’ll pay you 50 euros. If Cryosphere Today reports a 2008 minimum area of less than 4.01 million square kilometres, you’ll pay me 50 euros.
>handshake
Nick re: sea ice wager:
A bet is a bet and I’ll stick to it but you were tricky here as we are not going to be measuring the very questionable “tipping point” hypothesis at all. 2007 ice was so low that the 2008 extent is very likely to be below 2005 as well. Not because of any “tipping points”, but simply because the refreeze this winter is expected to be low following the record thaw. Tipping points are discussed often here very speculatively – it would be nice to have some testable hypotheses.
re:bets
http://www.longbets.org/ is a good site to check out, although they do have a minimum of 2 years [which is a rather short long bet].
Brain Schmidt http://backseatdriving.blogspot.com/, has several pages devoted to bets on global warming, and a long lsit of people he’s challenged to bet.
I’ve several times challenged people to well-crafted bets for around 2020, particularly those who think that the next sun cycle will make it all go away, even chasing people across several blogs … and somehow, the bet never happens, but the beliefs remain…
Re #63: Is there a generally accepted 95% or 90% lower bound on warming over the next 20 years?
The 90% or 95% lower bound would be roughly the trend warming we’ve had from 1970 to 2007, assuming business as usual emissions. The bounds are placed in the IPCC report and it explains it in far more detail. The upper bound is also pretty tight.
However, for the skeptics to be right (about their claim that humans are not effecting climate), not only could there not be any further warning, but the temperature would have to return to near pre-industrial levels. There’s a 10% chance that the 90% bound will be passed. There’s a far lesser chance that we will see pre-industrial climate in our lifetimes.
PS: There’s also a 10% chance that the other 90% bound will be exceeded and that we will get warming far worse than we expect. The bounds work both ways.
Steve, Re:161,164. You seem to be ignoring that CO2 is a gift that keeps on giving. It absorbs heat now, and every moment for several hundred to a few thousand years. And, since energy can leave the climate system only by LWIR radiation, there’s nowhere for that energy to go. It stays in the system. So, yes, a small amount of gas can warm the entire atmosphere by continually absorbing IR and transferring that energy collisionally to the rest of the molecules.
Re #164: [Okay, so how does ~750 billion tons of CO2, ~13,000 billion tons of Water vapor, and less than 15 billion tons of CH4 warm 5,000,000 billion tons of N2 and O2?]
Just like the low-E & space blanket analogies I tried to use. The CO2 warms the Earth by trapping more of the sun’s heat.
The point of the analogies, of course, was not that they use exactly the same mechanism. It was to illustrate how a relatively small amount of material can produce large effects by selectively blocking energy from another source. Though I suppose one could design a space blanket-like film that would act much as CO2 does in the atmosphere…
[Response: Indeed, back when I was working on scattering greenhouse effect by dry-ice clouds on Early Mars, some terraforming types got in touch with me about how to use designer clouds to go nature one better. Metallic conductors are really good reflectors, and to make them wavelength selective, you just need to use the same principle that allows you to build radio-telescopes with chicken wire. Designer-cloud particles made of bits of conducting screen with a mesh size of 10 microns would reflect infrared very well, but let a great deal of shortwave solar spectrum light through. For warming a planet, the scattering greenhouse effect has some advantages over the conventional emission-absorption greenhouse effect. But I digress… –raypierre]
Re 7,29, 84 and doubtless many others that I missed: hear, hear, a brilliantly written as well as an eminently educative (for us non-scientists)contributution.
For real Panglossian ‘deniers’, these must be bad times….
[Response: For those who may not know what we are talking about, the required reading is Voltaire’s “Candide.” (perhaps read in conjunction with the earlier “Zadig”). It would be an interesting literary exercise to write a sequel to Candide in which Pangloss takes on global warming. –raypierrre]
According to the Google, this is not the first website on which “Natural GW Steve” has spouted this sort of gibberish while ignoring corrections. It seems to me that enough effort has been expended on educational attempts. Raypierre (as usual) got it right by pointing to some basic texts and refusing to engage further.
[Response: Thanks. While I think that “Natural GW Steve” has reached the point where he should put up or shut up, by actually reading the references I gave him, I do think that having one-paragraph answers to common-sense questions like “how can something with such low concentration have such a big effect on climate” is worthwhile. Not everybody will have the time or inclination to read Dave Archer’s book, still less mine. Finding a way to communicate some kind of understanding to such honestly curious folks is worthwhile. I notice that part of the problem with the way many lay people approach this problem is that they tend to confuse transient response issues — the notion that the little bit of CO2 has to “heat up” all the rest of the mass of the atmosphere — with equilibrium. All this (admittedly interesting) discussion of just how CO2 transfers its heat to the rest of the atmosphere is largely irrelevant. The CO2 doesn’t have to “heat up” the atmosphere. It just has to impede the leakage of energy to space sufficiently that the atmosphere and surface need to warm significantly in order to radiate away the energy imbalance. From there, it’s just a matter of noting that even a monomolecular layer can absorb everything trying to get out, provided each individual molecule is good at capturing infrared light. CO2 isn’t quite that good, but it’s good enough, especially when bolstered by water vapor feedback. The issue of how long it takes absorption by CO2 to warm up the rest of the atmosphere is quite distinct from the question of equilibrium warming, but for the record, the real delay in the system isn’t the atmosphere (which only takes ten days to a month to reach equilibrium) but the ocean (a decade to centuries, depending on the depth involved). –raypierre]
Natural GW Steve:
You mean quotes like this, S. Molnar? Modern physics is like alchemy, in this person’s mind?
Wow.
Raypierre, please look at:
http://www.wmconnolley.org.uk/sci/fourier_1827/dscn0916.jpg.
At the bottom of the page, I believe it states “1824” not “1827” vis a vis your Nature report.
I have read in several different sources over the years, if I am not mistaken, that Fourier did indeed just republish his 1824 work in a later 1827 work,
…so he first published in 1824 in the Annales de Chimie et de Physique titled “MEMOIRE sur les temperatures du globe terrestre et des espaces planetaires. ?
and republished it later in 1827 in:
Mémoires de l’Académie Royale des Sciences de l’Institut de France VII. 570-604 (1827)?
http://geosci.uchicago.edu/~rtp1/papers/NatureFourier.pdf
[Response: Yes, I was aware of the earlier version but I focused on the 1827 publication because that was more widely available and seems to have gotten more attention. It’s also the version that appears in Fourier’s collected works. Still, I wouldn’t object if people preferred to say that the work on planetary energy balance goes back to 1824 rather than 1827. The translation I did, and my essay, was based on the 1827 document. –raypierre]
NGWSteve
If you have a pump, it can’t hold much water.
But it can transfer a whole lot of water.
Greenhouse gases can absorb photons and turn the energy into vibration and motion.
Greenhouse gases can’t hold heat as vibration or motion above that of the surrounding atmosphere long — they bump into nitrogen or oxygen and transfer the heat.
At very high elevations, greenhouse gases don’t bump into surrounding molecules as often, and with that extra time, can more often turn the vibration back into infrared photons that shoot out in random directions. Some of those exit the planet, removing energy.
At those high elevations, there isn’t much water, because water condenses and falls out as rain or snow, so it’s mostly CO2 and chlorofluorocarbons at the upper edge of the atmosphere that can emit infrared photons, some of which go out to space.
Add more greenhouse gases to the atmosphere, that’s like you’ve added more bumpers and paddles to your pinball machine — the heat energy stays in play longer — goes back and forth and round and round longer — before some of it gets to the edge of the atmosphere and leaves the planet. While it’s here the planet warms.
Raypierre can correct me (grin) if I’ve oversimplified a bit.
[Response: I appreciate the help, but I think that you’ve made it all more complicated than it really is. There may be some sense in which phrases like “heat stays in play longer” have some bearing on what’s going on, but if so it’s a pretty complicated way to look at it. The warming due to CO2 is really just a matter of planetary insulation. You put on a blanket, and that allows the planet to stay warmer with the same input of (solar) energy. The only problem with the blanket analogy is that for warm-blooded creatures, putting on a blanket doesn’t actually make you warmer, but reduces the metabolic energy needed to maintain a fixed body temperature. We’ve been through that a few times before in comments elsewhere. –raypierre]
[Response: By the way, the pumpkin pies just came out of the oven, and the cranberry sauce just went into the refrigerator. Time to bid goodnight and Happy Thanksgiving to all. I’ll be back with Part II sometime next week. –raypierre]
@raypierre (your comment on 177). I sometimes explain it like this: Imagine it’s getting hotter and hotter in your house. You’re looking for the cause and a scientist tells you this is caused by the mouse that lives in your house. That sounds pretty weird: how could such a small animal produce so much heat? It would, if the mouse had to do this with his body heat. But actually, the mouse is gnawing at the wire that connects your thermostat to the heating boiler.
Joe Duck @171: I’ve never proposed a bet about tipping points.
I proposed a bet with Jim Cripwell at 85, because of his expressed belief that the recent re-freeze shows that arctic sea ice will recover in 2008, which I find very unlikely. That makes him and myself a good match for betting on 2008 sea ice.
As I said @144, on the subject of tipping points, if you come up with a reasonable bet at even odds, I’ll consider it. You said @165 that you’d take 50 euros of the bet I proposed with Jim Cripwell, and that’s how come we’ve ended up in this bet.
I don’t think I’ve expressed an opinion on tipping points in this thread, although as it happens I suspect the years 2005-2007 have been a tipping point in arctic sea ice.
If you’d like to also bet on tipping points, then come up with a reasonable bet at even odds and I will consider it. It’s bound to be a longer-term matter. We could base it on the projections of sea ice decline which were made in 2004/5/6 (which I vaguely recall were suggesting we might see an ice-free summer arctic by 2050 or so): perhaps if the five years 2008-2012 show a decline steeper than the projections. I’ll leave it to you to come up with some numbers.
Whilst I agree with the views put forth in this article, I only wish you’d written it from a less biased stand-point. This whole debate is becoming increasingly us-and-them, and I don’t think good things can come of that.
Steve writes:
[[How do GHG’s warm the air surrounding them? How can 750 billion tons of CO2 have so much influence on 5,000,000 billion tons of N2 and O2?]]
When the greenhouse gases absorb infrared light, they heat up, which means their molecules move faster. Collisions with other molecules transfers most of the energy, so after a while the atmosphere, at least locally, is at a uniform temperature.
[[I have heard that without CO2 and Water vapor our atmosphere would be 30 C cooler. Is this true and how?]]
Yes. The Earth’s emission temperature, the temperature as seen at some distance from the planet, is about 255 degrees Kelvin, but the surface averages 288 degrees Kelvin. That 33 K difference is caused by the greenhouse effect. With greenhouse gases in the atmosphere, the surface would also be at 255 K. (Actually, it’s a bit more complicated than that, but that gives the essential point.)
[[It does not make sense that a fraction of a percent of the atmosphere has so much influence.]]
It doesn’t seem to, but note that that 384 parts per million by volume amounts to almost six kilograms of CO2 over every square meter of the Earth’s surface. That’s more than enough to affect the transfer of different wavelengths of light.
I’m dieing for part 2 over here! Loosing sleep and just started to eat build a script for updating RC…. ;)
> When the greenhouse gases absorb infrared light, they heat up,
> which means their molecules move faster. Collisions with other
> molecules transfers most of the energy, so after a while the
> atmosphere, at least locally, is at a uniform temperature.
That’s what I was trying for, when I overcomplicated it.
The greenhouse gases don’t just hold the heat in themselves, in their relatively few molecules; the hold it for the whole atmosphere.
Since my posts seem to get lost between the “post” button and the blog, I’m going to try again…
First, in response to the note on 159, many people here use the number of hurricanes as an indicator of the strength of the season. This is patently misleading when comparing current seasons to past seasons because the NHC has changed the criteria for what gets to be a named storm. Specifically, in 2002 the NHC started including sub-tropical storms in the list of things that get names. that will lead to an increase in “named storms” over previous years. While i’ll apologize for implying that the NHC did it for political claims (that’s not what i meant to say), I will not back away from the position that the numbers are being used for political purposes because they are. Even Gavin used the number of storms as an indicator of season strength. As a specific example of this happening, the first storm this year never exhibited tropical characteristics and in years past, it never would have been given a name. In all, 3 storms this year started out as sub-tropical in nature (which adds to the “number of storm days” metric many people like to use to describe the seasonal strength). Again, great care must be used when comparing these numbers to past years.
Second, on solar forcing. THere is no question whatsoever that we are near the peak of solar forcing when compared to the last 400 years. While the forcing function has backed off from the peak in the 1950s, we are still well above the 400 year average. There are two currently accepted proxies for solar forcing: the number of sunspots and tracking Carbon-14. Both of these proxies show that we’re living during a period of strong solar activity. If you look at the Carbon-14 record over the last 1000 years, the maximum forcing function was in the last 50 years.
http://en.wikipedia.org/wiki/Image:Sunspot_Numbers.png
Those points are not debatable. They are simply facts.
now to the debateable items:
one post said that GW should result in an increase in the number of storms. But there’s been no significant increase in the numbers, so would that then mean that there’s no GW?
On solar forcing, do we know that the climate has actually equalized from the forcing of the first half of the century? think of it as an oven, but instead of being controlled by a thermostat, it’s controlled by a timer. every 11 years the “heating element” turns on. Eventually the oven will stabilize at a new temperature, but what is that temperature and how long will it take to get there? I don’t know the answers to that but understanding that is critical to understanding how the sun affects the climate.
RE Steve @ 183 – It became us-vs-them a long time ago, and it wasn’t scientists who’s work deals with climate change who did that.
Ref 167 Lynn writes “Now, if the other factors that would amount to sufficient causes are not present (and I frankly don’t know about these very much), then a hurricane will not happen. GW is just making them more likely to happen and to become more intense,”. You are absolutely correct, but you have left out an important letter; A. We are arguing about AGW, not GW. I claim the data shows that, while the earth warmed up at the end of the 20th century, this warming has ceased. Hurricanes are merely one aspect of this, as arctic sea ice will be in the future. While CO2, according to the IPCC, has continued to increase at unprecedented levels, hurricanes have not increased in intensity in the last 2 years. The key is, what will happen in the future. The proponents of AGW need to pray to whatever gods they believe in, that sometime in the very near future, the signs of GW are going to reappear. If they dont, the whole case for AGW is going to fall apart.
[Response: Let me try and understand your point: despite more evidence of global warming happening – clearer trends in sea ice, snow cover, temperatures, water vapour etc. , a track record of decades of successful predictions, and multiple lines of direct physical evidence that GHGs are causing the warming – it is the proponents of AGW who need to be praying for more evidence? This is offensive on multiple levels. It is an offense to basic logic, it is an offense to the scientific method, and it’s offensive personally as if people who have concluded the AGW is happening actually want more hurricanes or more droughts or more heatwaves. The whole point of science in this is precisely to prevent things getting worse. Enough. – gavin]
The IPCC released some report last week that was all over the media (at least now they’re reporting on it).
Could you do a report on that report. Is there anything new, or is it simply a summary of the AR4?
[Response: Basically the latter. –mike]
Do you have a source for this? I’m not finding anything to back it up using Google…
” you look at the Carbon-14 record over the last 1000 years, the maximum forcing function was in the last 50 years.
http://en.wikipedia.org/wiki/Image:Sunspot_Numbers.png
Those points are not debatable. They are simply facts.”
Actually this one is not a fact and certainly is debatable!
The graph of C-14 you link to shows no data after 1890, by which time it was already being contaminated by combustion of fossil fuels and therefore becoming useless as a proxy for solar activity. C-14 did peak within the last 50 years but not because of solar effects (and not shown on your graph) but due to atmospheric testing of nuclear weapons!
http://en.wikipedia.org/wiki/Image:Radiocarbon_bomb_spike.svg
Re dean @ 187, Solar forcing has been discussed here many, many times in numerous posts and comment threads. See here:
https://www.realclimate.org/index.php/archives/category/climate-science/sun-earth-connections/langswitch_lang/sp
Re Jim Cripwell @ 189: “While CO2, according to the IPCC, has continued to increase at unprecedented levels, hurricanes have not increased in intensity in the last 2 years.”
Oh really? Perhaps you might want to check on the world-wide tropical storm records, including those for the Pacific and Indian Ocean basins and not just those for the North Atlantic, Caribbean and Gulf of Mexico basins, and then get back to us.
See:
http://en.wikipedia.org/wiki/2005_Pacific_typhoon_season
http://en.wikipedia.org/wiki/2006_Pacific_typhoon_season
http://en.wikipedia.org/wiki/2007_Pacific_typhoon_season
http://en.wikipedia.org/wiki/2005_North_Indian_Ocean_cyclone_season
http://en.wikipedia.org/wiki/2006_North_Indian_Ocean_cyclone_season
http://en.wikipedia.org/wiki/2007_North_Indian_Ocean_cyclone_season
http://en.wikipedia.org/wiki/2005_Atlantic_hurricane_season
http://en.wikipedia.org/wiki/2006_Atlantic_hurricane_season
http://en.wikipedia.org/wiki/2007_Atlantic_hurricane_season
Re Jim Cripwell’s observation in 189, “hurricanes have not increased in intensity in the last 2 years,” please see the following FAQ by Kerry Emanuel:
Anthropogenic Effects on Tropical Cyclone Activity
In particular, examine the graph of upward trend in both SST and PDI. PDI is the “power dissipation index”, and its trend is clearly upward and highly correlated with sea surface temperature.
Two years of flat or declining measurements will not reverse this trend.
How to deal with curious people who may or not be contrarians (like #177) is a tough issue. Taking some time to engage them is a good idea but don’t get too caught up. Lots of fence-sitters have heard much of the contrarian talking points and aren’t sure what to think.
I recall a year or two ago seeing on an environmental group blog where environmentalists commented that they were 100% for reducing emissions even though they expressed more uncertainty about the science than was warranted.
I have not seen more of that type of doubt within the environmental community. As for debate within the scientific community read Dr. Andrew Dressler’s post on gristmill.
http://gristmill.grist.org/story/2007/11/21/11591/198
Many thanks for the comments. We will see.
Joseph O’Sullivan: “How to deal with curious people who may or not be contrarians (like #177) is a tough issue. Taking some time to engage them is a good idea but don’t get too caught up.”
It’s one thing for someone to honestly and in good faith ask a “commonsense” question, or even a question that arises from having been exposed to deliberately misleading climate change denial propaganda, and it is generous and helpful of the RealClimate moderators and other knowledgeable commenters to answer their questions.
But commenters who repeat blatant falsehoods even when they have been repeatedly and patiently shown that their statements are wrong, probably know very well what they are doing and have no other purpose in posting here than to impress themselves with their ability to waste people’s time.
RE reply to #168: Well, I don’t even know what a space blanket is, but is it true that night temperatures are warming somewhat faster than day temperatures?
I think I read that somewhere. At least it makes sense with more GHGs in the atmosphere — which I’m imagining would be letting out less of Earth’s reflective heat during both the day and night, than previously, when there were less GHGs in the atmosphere (while, of course, light waves would not be striking the earth during the night — or that portion of the earth turned away from the sun, so there wouldn’t be incoming light/heat). Or is this too simplistic, or just wrong an idea.
Or does the whole GHG effect shut down altogether at night, bec we’re talking light waves, not heat. I’m thinking infrared waves (which is what I think are being reflected from earth??) are heat waves, but, of course they are also light waves. I obviously don’t know much, just trying to understand.
Re #171 (Joe Duck): It’s not at all established that Arctic sea ice is likely to set a new minimum in 2008. In fact, RC co-author (and sea ice modeler) William Connolley is taking bets that it won’t. While on some level whether it does or doesn’t set a record is just weather, if it does we will want to see to what extent the unusual atmospheric conditions that assisted the 2007 record melt repeated themselves in 2008. If they do, nobody will be surprised at a new record, but a question will be raised about the extent to which the sea ice reduction might be linked to those conditions. If they don’t and a new record happens anyway, that will mean that retained heat in the Arctic Ocean is starting to drive the sea ice reduction. If so, that probably would meet the definition of a tipping point since absent other factors (big assumption there) we would expect such a feedback to lead to an ice-free summer rather quickly. All of that said, while the modelers may hope for unambiguous results from the 2008 melt season, they are unlikely to get them.
I should mention that William’s stated reason for offering the bet is the undisputed fact that even in the context of a sharp trend climate records don’t tend to happen in consecutive years. I’m well aware of that, but took the bet because 1) we have an increasing long-term trend that the modelers admit they don’t yet have a handle on, 2) there was a record set in 2005 and 2006 would have set a new one were it not for a last-minute cold snap, so there’s a bit more to look at then just a single year record. Anyway, such a bet is by definition just for fun, although since the bet is in pounds for William versus U.S. dollars for me the relative pain of the payout is starting to look pretty imbalanced.