This article continues the critique of writings on climate change by Allègre and Courtillot, started in Part I . If you would like to read either post in French, please click on the flag icon beside the post title above.
Prelude: It’s the physics, stupid
…which of course is a paraphrase of Bill Clinton’s famous quote regarding the economy. We put the last word in small letters since we’ve learned that it is not a good debating technique to imply (even inadvertently) that those who are having trouble seeing the force of our arguments might be stupid. What we wish to emphasize by this paraphrase is the simple fact that the expectation of a causal link between increasing long-lived greenhouse gases (like CO2) and increasing temperature does not rest on some vague, unexplained correlation between 20th century temperature and 20th century greenhouse gas concentration.
The anticipated increase in temperature was predicted long before it was detectable in the atmosphere, indeed long before it was known that atmospheric CO2 really was increasing; it was first predicted by Arrhenius in 1896 using extremely simple radiation balance ideas, and was reproduced using modern radiation physics by Manabe and co-workers in the 1960’s. Neither of these predictions rests on general circulation models, which came in during subsequent decades and made more detailed forecasts possible.
Still, the basic prediction of warming is founded on very fundamental physical principles relating to infrared absorption by greenhouse gases, theory of blackbody radiation, and atmospheric moist thermodynamics. All these individual elements have been verified to high accuracy in laboratory experiments and field observations. For a time, there was some remaining uncertainty about whether water vapor feedback would amplify warming in the way hypothesized in the early energy balance models, but a decade or two of additional observational and theoretical work has shown that there is no real reason to doubt the way in which general circulation models calculate the feedback. When modified by inclusion of the cooling effect of anthropogenic aerosols, the theory gives a satisfactory account of the pattern of 20th and 21st century temperature change.
No other theory based on quantified physical principles has been able to do the same. If somebody comes along and has the bright idea that, say, global warming is caused by phlogiston raining down from the Moon, that does not make everything we know about thermodynamics, infrared absorption, energy balance, and temperature suddenly go away. Rather, it is the job of the phlogiston advocate to quantify the effects of phlogiston on energy balance, and incorporate them in a consistent way beside the existing climate forcings. Virtually all of the attempts to poke holes in the anthropogenic greenhouse theory lose sight of this simple and unassailable principle.
In a paper entitled "Are there connections between the Earth’s magnetic field and climate?" published recently in Earth and Planetary Science Letters, Courtillot and co-authors attempt to cast doubt on carbon dioxide as a primary driver of recent (and presumably future) climate change; he argues instead that fluctuations in the Earth’s magnetic field (partly driven by solar variability) have an important and neglected role. Like most work of this genre, it is carried out in an intellectual void — as if everything we know currently about physics of climate had to be set aside in order to make way for one new (or in fact not-so-new) idea. But the problems don’t end there. With the help of a Comment published by Bard and Delaygue (available here at EPSL or here as pdf) , we’ll expose a pattern of suspicious errors and omissions that pervades Courtillot’s paper. Sloppiness and ignorance is by far the most charitable interpretation that can be placed on this pattern.
Let’s set the stage by noting that, as a significant competitor to anthropogenic greenhouse forcing of recent climate change, the direct radiative forcing by solar irradiance variations is dead on arrival. The solar output has been monitored by accurate satellite instruments since 1978. Measured peak to trough over the 11 year solar cycle, averaging over the Earth’s surface and allowing for albedo, the radiative forcing amplitude is under 0.2 W/m2. The trend left after averaging over the solar cycle is even smaller. This pales by comparison with over 2 W/m2 of radiative forcing arising from long-lived greenhouse gases that have accumulated in the atmosphere since 1750; it pales yet more by comparison with the forcing to come in the future if action is not taken to control emissions. There is nothing in climate physics to suggest that the sensitivity of climate to solar irradiance variation differs substantially from the sensitivity to infrared radiative forcing arising from greenhouse gas changes. As far as the climate cares, a Watt is (for the most part) a Watt, regardless of whether it comes from changes in the incoming solar energy or greenhouse-induced changes in the infrared radiation loss.
To get a bigger bang out of solar variability, one needs to invoke something else about the way the Sun affects climate. Something exotic, like magnetic field variations. Since there is no quantified physical mechanism linking field variations to climate, Courtillot must fall back on showing us a few supposed correlations between temperature variations and magnetic field variations. To make matters worse, Courtillot can’t always make up his mind even about whether an increasing field index should warm the climate or cool it, making it unclear just what correlations one is looking for. The lack of a physical model makes it impossible to treat the various forcings on an equal footing and make a reliable attribution of causes. This is particularly fatal when the various forcings are strongly correlated with each other. For example, on time scales of years to centuries, the magnetic field variability, cosmic rays and solar irradiance vary nearly in lock-step, so if there is a correlation with temperature (or cloud cover) one cannot tell whether it means that climate is responding with high sensitivity directly to luminosity changes, or whether something more exotic is going on. Over a period when temperature, greenhouse gas forcing, and some magnetic field index are all going up, a statistical attribution technique which ignores greenhouse gases and considers only the magnetic field index will of course find that the magnetic field "explains." the signal. If we knew nothing about how CO2 affects climate, this would put the magnetic field on an equal footing with CO2 as a candidate explanation but this is not the case. We know a great deal about how CO2 affects climate and no amount of additional fiddling with cosmic rays or magnetic fields can make this physics go away. One can get even more confused by forgetting about the important role of anthropogenic aerosols in the past century, as Courtillot all too often does.
The confidence with which Courtillot casts doubt on the generally accepted role of anthropogenic forcing in climate change of the past century is surprising, in view of the essential limitations of any argument from correlation alone. But it’s worse than just that: as Bard and Delaygue show, most of the correlations upon which Courtillot et al. rest their flimsy case are in fact bogus.
Solar variability and climate: The Good, the Bad, and the Ugly
Work on the influence of solar variability (and on its close cousin, the influence of the Earth’s magnetic field) tends to fall into one of three categories. There is the Good, in which careful scientists do their objective best to unravel a complex and probably small (but nonetheless important) signal. As examples of work in this category, I would mention Judith Lean’s tireless efforts on relating luminosity to sunspot number, the work of Bard and colleagues on developing isotopic solar proxies like 10Be, Shindell’s work on response to solar ultraviolet variability, and the work of Foukal et al on factors governing solar irradiance variations. I would also include the recent work by Camp and Tung diagnosing the amplitude of the solar cycle in temperature in the "Good" category; that it is an easy paper for greenhouse skeptics to misquote takes away nothing from the quality of the science. In fact, I’d say most work on climate and solar variability falls into the Good category. That’s rather nice. In fact, scientists have long recognized the importance of solar variability as one of the factors governing climate (see the very scholarly review of the subject by Bard and Frank, available here at EPSL or here as pdf) An understanding of solar variability needs to be (and is) taken into account in attribution of climate change of the past century, and in attempts to estimate climate sensitivity from recent climate variations. Further, the Little Ice Age demands an explanation, and solar variability at present provides the only viable possibility. (It’s less clear that the Medieval Warm period is a sufficiently coherent phenomenon to require an explanation).
Then, there is the Bad, exemplified by two papers by Scafetta and West that have been discussed on RealClimate here and here. This is just normally bad science, in the sense that there is something wrong in the approach taken by the authors which leads to erroneous conclusions. Perhaps some of this work should never have made it through peer review, but as long as the methods are well documented and honestly described, subsequent investigators will be able to identify the errors and either salvage or discard the results.
And then … there is the Ugly. These papers cross the line from the merely erroneous into the actively deceptive. Papers in this category commit what Damon and Laut judiciously call a "Pattern of strange errors.". Papers in this category often use questionable (and often hidden and undocumented) data manipulations to manufacture correlations where none exist. The work by the Danish solar boosters, discussed extensively by Damon and Laut, typifies the Ugly category. We’ll leave it to the reader to decide, after the discussion to follow, whether Courtillot’s paper is merely Bad, or has crossed over into the Ugly.
Spin vs. Scholarship
The general style of discourse in Courtillot et al. has more in common with the kind of one-sided polemic one finds in Lomborg or the Robinson et al. fake PNAS article distributed with the original Global Warming Petition Project than it does with scholarship whose intent is to get at the truth. It quotes papers uncritically and selectively if they can be made to appear to support the authors’ thesis (e.g. the uncritical use of the aforementioned single-factor Scafetta and West paper to support a large attribution of twentieth century climate change to solar variability). There is also a lot of general spin here; for example, greenhouse gases are listed last in a laundry-list of things that can affect climate, without any indication as to the relative magnitudes of the various forcings. Other problems include the following:
- Courtillot exaggerates the cloud radiative forcing by a factor of four, because he attributes virtually all the Earth’s albedo to clouds and fails to take into account the cloud greenhouse effect.
- He says that "Cooling from 1940 to 1970 is often disregarded as being part of the noise" whereas in fact it was intensive study of this period that lead scientists to appreciate the importance of the anthropogenic aerosol effect, at the time of the IPCC Second Assessment Report. Again ignoring the well-documented importance of anthropogenic aerosols, he says later: "Note that the leveling or drop in temperature from 1940 to 1970 matches solar and magnetic series, and not the monotonous accelerated rise in CO2" Not only is this a Crichton-esque obfuscation of a well-understood phenomenon, but as we’ll see later the supposed "match" is an artifact of questionable data manipulations.
- Courtillot points to an energy-balance model study by Crowley as support for his thesis that there is some missing physics left out of models, which affects response to solar forcing. Specifically, Courtillot points to a model/data mismatch in the early 20th century. However, Crowley did not include the indirect aerosol effect, and the energy balance model has no geography and therefore can’t be expected to model things like continental vs. ocean seasonal cycles or ice and snow cover with complete fidelity. General circulation models forced with a combination of natural (including solar) and anthropogenic (aerosol and greenhouse gas) forcing have no problem reproducing early 20th century climate. Further, Crowley’s model accurately matches the observed response to solar forcing earlier in the millennium, so it is hard to see why the "missing physics" should suddenly kick in at 1850. It is always suspicious when selective quotes are used to draw a conclusion exactly opposite to what the paper’s own author concludes. For the record, here is what Crowley himself says in the paper about his own results:
- There are therefore two independent lines of evidence pointing to the unusual nature of late-20th-century temperatures. First, the warming over the past century is unprecedented in the past 1000 years. Second, the same climate model that can successfully explain much of the variability in Northern Hemisphere temperature over the interval 1000–1850 indicates that only about 25% of the 20th-century temperature increase can be attributed to natural variability. The bulk of the 20th-century warming is consistent with that predicted from GHG increases. These twin lines of evidence provide further support for the idea that the greenhouse effect is already here.
- Courtillot also cites an atmosphere-ocean model simulation by Zorita et al. (2004) as support for his claim that models fail to represent the 20th century response to solar or magnetic variability. However, as discussed here and in the peer-reviewed references cited therein, this simulation suffers from an inappropriate initialization which leads to a spurious cooling in parts of the run, and a large climate drift requiring detrending of the output before analysis. Besides that, the model explicitly neglects anthropogenic aerosol forcing, so how could one expect it to get 20th century climate right?
- Courtillot claims that the correlation between geomagnetic "jerks" and Alpine glacier advances supports a solar-magnetic influence on climate. As Bard and Delaygue emphasize, this requires an exactly opposite sign of response to magnetic field variations as claimed by Marsh and Svensmark (2000), and as assumed elsewhere in Courtillot’s paper. Courtillot cooks up an ad hoc explanation for why this might be the case, but this leads him even farther afield from anything that can be justified by known, quantified physics. One can find all sorts of correlations if one allows oneself the liberty to change the sign of the sought-for relation whenever convenient, and without any constraint by physics.
- There is hardly anything more embarrassing to a theory than success in explaining a phenomenon that turns out not to exist. Courtillot makes much of the fact that the millennial cycle of hematite-stained ice rafted debris in Gerard Bond’s data set — taken at the time to be a proxy for North Atlantic temperature — lines up nicely with geomagnetic variations. However, as Bard and Delaygue note, later work with better chronology, more cores and better time resolution show that Bond’s record does not represent a temperature index for the entire northern Atlantic region. The more complete record exhibits little or no relation to geomagnetic variations.
…and now for the really ugly part
Bard and Delaygue uncovered a number of errors of a more troubling nature. Courtillot et al. commit the "flat Earth" error from which our article draws its name: they give a misleading impression of the comparison of forcing by solar variability relative to greenhouse gas forcing by failing to take into account the Earth’s spherical geometry and albedo. After the very public humiliation suffered by Le Mouel on this point at the Academie debates (see Part I), in his article in La Lettre Courtillot took pains to show that he indeed understood the consequences of the Earth being round. However, this new understanding did not result in any sign of a corrigendum being sent to EPSL, so one can only conclude that the deception is deliberate. Further in their Fig. 1 Courtillot et al. show geochemical data from a Central Alpine stalagmite which purports to establish a highly tight correlation between climate variations and a solar activity proxy; as Bard and Delaygue note, Courtillot and co-workers have concealed the fact that the correlation is so good precisely because the chronology of the two series being compared has been finely tuned to expressly maximize the correlation. The original untuned data does not show nearly so tight a correlation.
The piece de resistance of Courtillot et al., is the following graph, which purports to show that for almost all of the past century, temperature correlates tightly with solar activity and magnetic field variability. The three curves on the graph are, according to the paper, Phil Jones’ global mean temperature record (Tglobe, in red circles) , a total solar irradiance reconstruction (S(t), in pink triangle; Courtillot cites Solanki’s reconstruction in the text), the magnetic field variability index at a site in Scotland (ESK, blue) and at Sitka Alaska (SIT, green). All the curves have been centered to have the same mean and standard deviation over the length of record, so as to make them more comparable. Note that the S(t) curve spans a shorter time than the others; this turns out to be important.
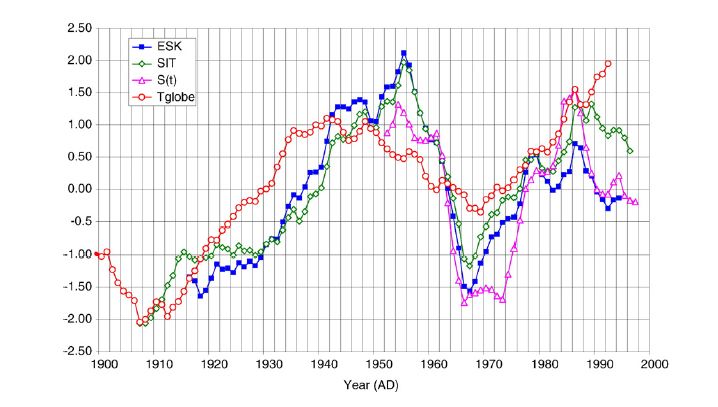
Looks pretty good, eh? Well it would, except for the minor details that "S(t)" is not actually the solar output, "Tglobe" is not actually the Jones global mean temperature it is claimed to be and neither "ESK" nor "SIT" look much like broader-based magnetic variability indices that provide more reliable indicators of solar activity. Bard and Delaygue thought it curious that Courtillot would use just the final snippet of the Solanki record when the full century was available. They checked what the curve would look like if it were normalized using the full length of the record. That’s the thick grey curve in Bard and Delaygue corrected version of the figure below; for comparison, the purple curve with triangles shows the results of using Solanki’s reconstruction truncated to the period Courtillot chose.

Get the picture? By snipping out just the last bit of the curve and normalizing to unit standard deviation, Courtillot inflates the variability and makes the fit look better than it would be if the full data set were used. As a bit of deceptive data manipulation, this has to go down in history with the selective smoothing used on some of the solar records that Damon and Laut discuss in their critique of the Danish solar work. Now, in his response to Bard and Delaygue (there’s always a response to Comments) Courtillot digs himself even deeper into a hole. He states that the reason he used a truncated solar series is that the data came not from Solanki (as implied in the paper), but rather from Tobiska’s SOLAR2000 model product. Tobiska’s paper is not even cited by Courtillot et al. (2007), whereas Solanki (2002) is cited there as well as in the authors’ earlier papers on related subjects. There is no legitimate reason for using SOLAR2000 in a study of the sort Courtillot et al. are attempting since, as noted by Bard and Delaygue, the SOLAR2000 model is restricted to the ultraviolet portion of the solar spectrum, making it the wrong choice unless one is explicitly investigating phenomena linked to ultraviolet forcing (see Lean (2002) ). One could guess that Courtillot et al.pulled this convenient rabbit out of the nearest available hat, because it was the first curve they found that gave them some excuse to truncate the record in a way that gave the desired result.
Bard and Delaygue noticed another strange thing. Courtillot’s "Tglobe" curve did not look much like the curve published by Jones. Jones’ curve, plotted from his actual data files, is shown in Bard and Delaygue’s corrected version of the figure; they also show the NASA reconstruction for comparison. These two curves are in agreement, but neither shows the sharp rise/dip pattern between 1940 and 1970 which is seen in Courtillot’s figure. So if Courtillot’s data is not Jones’ global mean temperature, what is it that Courtillot plotted? We may never know. In his response to Bard and Delaygue, Courtillot claims the data came from a file called: monthly_land_and_ocean_90S_90N_df_1901-2001mean_dat.txt. Bard and Delaygue point out, however, that Jones has no record of any such file in his dataset, and does not recognize the purported "Tglobe" curve as any version of a global mean temperature curve his own group has ever produced.
Whatever the source of the purported "Tglobe" data given in Courtillot et al., there is no legitimate reason — in a paper published in 2007 — for truncating the temperature record at 1992 as they did. There is, however, a very good illegitimate reason, in that truncating the curve in this way helps to conceal the strength of the trend from the reader, and shortens the period in which the most glaring mismatch between solar activity and temperature occurs.
In the corrected graph, Bard and Delaygue also plot the "aa" geomagnetic index. This is an index based on two stations at antipodal points, which has been found to correlate well with the overall geomagnetic variability based on a larger network of stations. One could argue that if one is looking at global mean temperature data, the aa index provides a more appropriate basis for comparison than the single-station high Northern latitude records that Courtillot uses. Note that the aa index tracks Solanki’s solar irradiance well, whereas the single-station measurements do not.
In the corrected graph, Tglobe, aa and S(t) track each other upward from 1900 to 1940, but note that greenhouse gases also go up monotonically in this period, as they do later. A purely statistical attribution could ascribe nearly all the changes from 1900-1940 to solar or magnetic variability, but a similar statistical attribution could do the same for greenhouse gases. Only physics can divvy up the blame. Since 1940, however, there is not even the appearance of correlation between Tglobe and either S(t) or any of the geomagnetic indices. There is a hump in both the solar and aa index around 1950, during which time the temperature is flat or decreasing. Courtillot’s erroneous analysis defers the decorrelation until 1985.
Between the embarrassing showing at the Academie debates and the travesty of science exposed by Bard and Delaygue in the case of the EPSL paper, You’d think that Courtillot would want to fine the nearest hole and go hide in it. Far from it, he was recently spotted giving a talk called "What global warming?" at this prestigious event gathering several famous physicists and chemists. Some people have no shame.
Postlude: Of silk purses and sow’s ears
Bard and Delaygue conclude with a figure, reproduced below, which nicely illustrates something we’ve been saying for years at RealClimate. On this figure they plot the Jones global mean temperature together with a global magnetic index (the aa index), a cosmic ray flux index (Climax) and the PMOD composite satellite record of solar irradiance. These curves are less smoothed than those shown in the preceding graph. The inter-annual temperature variability is linked to natural effects such as major volcanic eruptions, ENSO events and solar variability. However, only the Tglobe curve is characterized by a very significant upward trend — a trend which cannot be explained by these natural causes.

Say it three times every night before going to sleep: Temperature goes up. Solar stuff goes up and down and up and down and up and down. You can no more make a trend out of that than you can make a silk purse out of a sow’s ear.
A note added in proof, concerning the "Note Added in Proof"
The above discussion was based on the version of Bard and Delaygue’s comment and Courtillot’s response which was available on the Elsevier web site through December 15. Since the time of writing, some strange changes have occurred under the direction of the responsible editor, Robert van der Hilst of MIT. He deleted the "Note added in Proof" from the final version of Bard and Delaygue’s comment. Bard and Delaygue only found out about this when they received the proofs of their Comment. What is even more disturbing is that van der Hilst allowed Courtillot to change the text of his Response based on what Bard and Delaygue wrote in the now-deleted "Note added in Proof." Bard and Delaygue were given no opportunity to see or comment on these changes. I have left the above discussion as it is, in order that the reader will have a better appreciation of the strange history of this comment/response cycle.
In the revised "Response" Courtillot now admits that the temperature record called "Tglobe" is not from any of Phil Jones’ datasets at all. Courtillot now claims that the data came from a study by Briffa et al. (2001), giving the address of a file stored at NCDC. As specified in this study and in the head of this file, these data have been "recalibrated to obtain estimates of April-September mean temperatures from all land regions north of 20N". Thus, the temperature dataset used by Courtillot is definitely not Tglobe, does not represent the full hemisphere, and moreover is not even an annual mean.
Rob van der Hilst — recently a Visiting Professor at IPGP (Courtillot’s institution) — claims that these changes were made in the interests of scientific communication. I leave it to the reader to judge whether these actions were appropriate, or whether they were just an attempt to protect Courtillot from embarrassment.. In the interests of scientific communication, I append below the full text of the "Note added in Proof" which was stripped from Bard and Delaygue’s Comment:
Note added in proof:
In their Response to our Comment, Courtillot et al. state that for the total irradiance curve S(t) they had used the SOLAR2000 model product by Tobiska (2001) instead of the century-long record by Solanki (2002) cited in their original paper (Courtillot et al. 2007). However, the SOLAR2000 model is restricted to the UV component and their total solar irradiance is severely flawed as pointed out by Lean (2002).
For the global temperature Tglobe curve cited from Jones et al. (1999) in Courtillot et al. (2007), these authors now state in their response that they had used the following data file: monthly_land_and_ocean_90S_90N_df_1901-2001mean_dat.txt We were unable to find this file even by contacting its putative author who specifically stated to us that it is not one of his files (Dr. Philip D. Jones, written communication dated Oct. 23, 2007).
Tobiska, W. K. 2001, Validating the solar EUV proxy, E10.7, J. Geophys. Res. 106, 29,969- 29,978.
Lean, J.L., 2002. Comment on ”Validating the solar EUV proxy, E10.7” by W. K. Tobiska. J. Geophys. Res. 107, (A2), 1027, 10.1029/2001JA000137.
Prélude : C’est de la physique, idiot
…c’est bien sûr une paraphrase de la célèbre citation de Bill Clinton au sujet de l’économie. Le dernier mot est en petits caractères car nous avons appris que ce n’est pas une bonne technique de débat d’insinuer (même par inadvertance) que ceux qui ont du mal à voir la force de l’argumentation pourraient être idiots. Ce que nous souhaitons souligner par cette paraphrase est le simple fait que le lien de cause à effet attendu entre l’augmentation des gaz à effet de serre à longue vie (comme le CO2) et l’augmentation de température ne repose pas sur une vague corrélation inexpliquée entre la température et la concentration des gaz à effet de serre au cours du 20e siècle.
L’augmentation présumée de la température a été prédite bien avant d’être détectable dans l’atmosphère, en fait bien avant de savoir que le CO2 était vraiment en train d’augmenter. Ceci a été prédit pour la première fois par Arrhenius en 1896 à partir d’idées extrêmement simples sur l’équilibre radiatif, puis fut reproduit en utilisant de la physique moderne des rayonnements par Manabe et collaborateurs dans les années 60. Aucune de ces prédictions ne reposait sur des modèles de circulation générale, qui sont apparus dans les décennies suivantes et ont permis des prévisions plus détaillées. Mais la prédiction de base du réchauffement est fondée sur des principes de physique vraiment fondamentaux ayant trait à l’absorption des infrarouges par les gaz à effet de serre, à la théorie radiative du corps noir, et à la thermodynamique de l’atmosphère saturée. Chacun de ces éléments a été vérifié avec une très bonne précision par des expériences de laboratoire et des observations de terrain.
Pendant un temps, une incertitude persistait sur le fait de savoir si la vapeur d’eau allait amplifier le réchauffement avec l’amplitude simulée par les premiers modèles d’équilibre radiatif, mais une ou deux décennies de travail supplémentaire à la fois d’observation et de théorie ont montré qu’il n’y a pas vraiment de raison de douter du calcul de cette rétroaction par les modèles de circulation générale. Modifiée en introduisant l’effet refroidissant des aérosols anthropiques, la théorie rend compte de façon satisfaisante de l’allure de la variation de température des 20e et 21e siècles.
Aucune autre théorie basée sur des principes physiques quantifiables n’a pu faire de même. Si quelqu’un arrivait avec la brillante idée que, disons, le réchauffement global est dû à la pluie de Phlogistique tombant de la Lune, cela n’effacerait pas d’un coup tout ce que l’on sait sur la thermodynamique, sur l’absorption des infrarouges, l’équilibre radiatif, et la température. Au contraire, c’est le boulot de l’avocat du Phlogistique de quantifier les effets du Phlogistique sur l’équilibre radiatif, et de les ajouter de manière cohérente aux forçages climatiques existants. Quasiment toutes les tentatives d’enfoncer la théorie de l’effet de serre anthropique ont perdu de vue ce principe simple mais incontournable.
Dans un article intitulé "Are there connections between the Earth’s magnetic field and climate?" publié récemment dans le journal Earth and Planetary Science Letters, Courtillot et ses co-auteurs tentent de jeter le doute sur la responsabilité principale du CO2 dans le changement climatique récent (et probablement futur); avançant au contraire que les fluctuations du champ magnétique terrestre (en partie dues à la variabilité solaire) jouent un rôle important et négligé. Comme la plupart des travaux du genre, celui-ci est construit sur un vide intellectuel –comme si tout ce que nous savions déjà en physique du climat devait être mis au rebut pour une idée nouvelle (et en fait pas si nouvelle). Mais les problèmes ne s’arrêtent pas là. Avec l’aide d’un Commentaire publié par Bard et Delaygue (disponible ici dans EPSL ou ici comme fichier PDF), nous exposerons un ensemble d’erreurs suspectes et d’omissions qui remplissent le papier de Courtillot. Je-m’en-foutisme et ignorance, est l’interprétation de loin la plus charitable que l’on puisse apporter à cet ensemble.
Commençons par noter que, comme concurrent significatif au forçage par les gaz à effet de serre anthropiques des changements climatiques récents, le forçage radiatif directement par les variations de l’irradiance solaire arrive bon dernier. Le flux d’énergie solaire a été suivi précisément par des instruments satellitaires depuis 1978. Mesurée entre les maxima et minima des cycles solaires de 11 ans, en la moyennant sur la surface de la Terre et en prenant en compte l’albédo, l’amplitude du forçage radiatif est plus petite que 0,2 W/m2. La tendance que l’on obtient en moyennant sur plusieurs cycles solaires est encore plus faible. Ceci fait pâle figure à côté des plus de 2 W/m2 de forçage radiatif dû aux gaz à effet de serre à longue durée de vie qui se sont accumulés dans l’atmosphère depuis 1750, et encore plus par rapport au forçage qui nous attend si aucune action n’est prise pour contrôler les émissions. Rien dans la physique du climat ne suggère que la sensibilité du climat aux variations d’irradiance solaire diffère de façon substantielle de la sensibilité au forçage des infrarouges dû aux variations des gaz à effet de serre. Pour ce qui concerne le climat, un watt est (pour l’essentiel) un watt, peu importe qu’il provienne du changement de l’énergie solaire incidente ou de l’émission infrarouge due aux gaz à effet de serre.
Pour faire plus de bruit avec la variabilité solaire, il faut invoquer quelque chose d’autre pour l’impact du soleil sur le climat. Quelque chose d’exotique, comme des variations du champ magnétique. Comme il n’y a pas de mécanisme physique quantifié reliant les variations du champ au climat, Courtillot doit se rattraper en nous montrant quelques supposées corrélations entre les variations de température et du champ magnétique. Pour ne rien arranger, Courtillot n’arrive pas à décider si une augmentation du champ devrait réchauffer le climat ou le refroidir, ce qui fait qu’on ne sait même pas quelle corrélation rechercher. L’absence d’un modèle physique ne permet pas de traiter les différents forçages sur un pied d’égalité ni d’attribuer de manière fiable les causes des changements climatiques. C’est particulièrement néfaste dans le cas où les différents forçages sont fortement corrélés entre eux. Par exemple à l’échelle de l’année au siècle, la variabilité du champ magnétique, des rayons cosmiques, et de l’irradiance solaire varient pratiquement en parallèle, et donc s’il y a une corrélation avec la température (ou la couverture nuageuse) on ne peut pas dire si c’est parce que le climat répond avec une grande sensibilité directement aux variations d’irradiance, ou si quelque chose de plus exotique est en cause. Sur une période pendant laquelle la température, le forçage des gaz à effet de serre, et un quelconque index du champ magnétique augmentent tous, une technique statistique d’attribution qui ignorerait les gaz à effet de serre pour ne considérer que l’index du champ magnétique trouverait bien sûr que le champ magnétique "explique" le signal. Si nous ne connaissions rien sur l’impact climatique du CO2, ceci mettrait le champ magnétique sur un même pied d’égalité que le CO2 comme explication, mais ce n’est pas le cas. Nous en savons beaucoup sur l’impact climatique du CO2, et aucune combine avec les rayons cosmiques ou le champ magnétique ne peut faire disparaître cette physique. Ca peut même devenir encore plus confus si on oublie le rôle important des aérosols anthropiques sur le dernier siècle, comme Courtillot le fait bien trop souvent.
La confiance avec laquelle Courtillot met en doute le rôle, accepté de façon générale, du forçage anthropique sur les changements climatiques du dernier siècle est surprenante, au vu des limites fondamentales de tout argument basé seulement sur une corrélation. Mais c’est encore pire que ça : comme le montre Bard et Delaygue, la plupart des corrélations sur lesquelles reposent les pauvres cas de Courtillot et al. sont en fait bidons.
Variabilité solaire et climat : du bon, de la brute, et du truand
Les travaux sur l’influence de la variabilité solaire (et de sa proche cousine, l’influence du champ magnétique terrestre) peuvent être rangés en trois catégories. Il y a du bon, dans lequel des scientifiques consciencieux essayent de débrouiller avec leur meilleure objectivité un signal complexe et probablement faible (mais cependant important). Comme exemples de travaux de cette catégorie, je citerais les efforts inlassables de Judith Lean pour relier l’irradiance au nombre de taches solaires; les travaux de Bard et ses collègues sur le développement d’indicateurs isotopiques du soleil comme le 10Be; les travaux de Shindell sur la réponse à la variabilité des ultraviolets; et les travaux de Foukal et al. sur les facteurs de variation de l’irradiance solaire. J’ajouterais aussi le travail récent de Camp et Tung de diagnostic de l’amplitude du cycle solaire dans la température dans la catégorie du "bon" – que ce soit un papier facile à détourner par les sceptiques de l’effet de serre n’enlève rien à sa qualité scientifique. En fait, je dirais que la plupart des travaux sur le sujet du climat et de la variabilité solaire relèvent de la catégorie du bon. C’est plutôt bien. En fait, les scientifiques ont depuis longtemps reconnu l’importance de la variabilité solaire comme l’un des facteurs gouvernant le climat (voir la synthèse très académique sur ce sujet de Bard et Frank, accessible ici à EPSL et ici en PDF). La connaissance de la variabilité solaire doit être (et elle l’est) prise en compte pour expliquer le changement du climat du dernier siècle, et pour tenter d’estimer la sensibilité climatique à partir des variations récentes du climat. De plus, le Petit Age Glaciaire nécessite une explication, et la variabilité solaire représente actuellement la seule possibilité fiable (il est moins clair que l’Optimum Médiéval soit un phénomène suffisamment cohérent pour nécessiter une telle explication).
Et puis, il y a de la brute, avec comme exemples typiques deux papiers de Scaffetta et West discutés sur RealClimate ici et ici. C’est juste de la science ‘normalement’ mauvaise, dans le sens que l’approche suivie par les auteurs est erronée quelque part, ce qui aboutit à des conclusions fausses. Peut-être qu’une partie de ce travail n’aurait jamais dû passer à travers la critique des pairs, mais du moment que les méthodes sont bien expliquées et honnêtement décrites, les investigateurs suivants seront capables d’identifier les erreurs et donc de confirmer ou d’infirmer les résultats.
Et puis… il y a du truand. Ces papiers franchissent la ligne séparant l’erreur simple de la tromperie active. Les papiers de cette catégorie commettent ce que Damon et Laut nomment judicieusement un "ensemble d’étranges erreurs". Les papiers de cette catégorie utilisent souvent des manipulations de données criticables (et souvent cachées et non expliquées) pour fabriquer des corrélations quand elles n’existent pas. Les travaux des fanatiques danois du soleil, largement discutés par Damon et Laut, sont des exemples typiques de cette catégorie de truand. Nous laissons au lecteur le soin de décider, après la discussion qui suit, si le papier de Courtillot est simplement du brut, ou s’il a versé dans le truand.
Manipulation contre académisme
Le style général du discours de Courtillot et al. a plus à voir avec le genre polémique et partial que l’on trouve chez Lomborg ou dans l’article simulant un PNAS de Robinson et al., distribué avec le projet original de pétition contre le réchauffement global, qu’il a à voir avec le genre académique qui essaye d’approcher la vérité. Il cite des papiers sans aucun sens critique et seulement s’ils peuvent étayer la thèse de l’auteur (comme par exemple l’utilisation non critique du papier biaisé de Scafetta et West cité précédemment pour appuyer une attribution importante du changement climatique du 20e siècle à la variabilité solaire). Il y a aussi pas mal de pagaille, par exemple les gaz à effet de serre sont listés en derniers parmi d’autres causes de changement climatique, sans indication de l’amplitude relative des différents forçages. Entr’autres problèmes on peut citer :
- Courtillot exagère le forçage radiatif des nuages d’un facteur quatre, car il attribue pratiquement tout l’albédo terrestre aux nuages et oublie de prendre en compte l’effet de serre des nuages.
- Il dit que "le refroidissement entre 1940 et 1970 est souvent négligé comme faisant partie du bruit" alors qu’en fait c’est l’étude approfondie de cette période qui amena les scientifiques à reconnaître l’importance de l’effet des aérosols anthropiques, à l’époque du second rapport d’évaluation du GIEC. En ignorant encore une fois l’importance bien documentée des aérosols anthropiques, il dit plus loin : "Notons que la stabilisation ou diminution de la température entre 1940 et 1970 correspond bien aux séries solaire et magnétiques, au contraire de l’accélération monotone de la hausse du CO2". Non seulement, c’est une dissimulation à la Crichton d’un phénomène bien connu, mais comme nous le verrons plus loin la supposée "correspondance" est le résultat d’une manipulation discutable des données.
- Courtillot indique une étude de Crowley utilisant un modèle d’équilibre énergétique pour étayer sa thèse qu’il manquerait de la physique dans ces modèles, ce qui affecterait la réponse au forçage solaire. Précisément, Courtillot pointe un désaccord entre modèles et données au début du 20e siècle. Toutefois, Crowley n’a pas inclus l’effet indirect des aérosols, et un modèle d’équilibre énergétique n’a pas de géographie et on ne peut donc s’attendre à ce qu’il simule fidèlement des caractéristiques comme la différence du cycle saisonnier entre continent et océan ou la couverture de glace et de neige. Les modèles de circulation générale forcés avec une combinaison de forçages naturels (y compris le solaire) et anthropiques (gaz à effet de serre et aérosols) n’ont aucun problème pour reproduire le climat du début du 20e siècle. De plus, le modèle utilisé par Crowley simule précisément la réponse climatique au forçage solaire plus tôt dans le millénaire, il est donc difficile de voir pourquoi la "physique manquante" devrait seulement se faire sentir en 1850. Il est toujours suspect lorsque des citations isolées sont utilisées pour tirer une conclusion exactement opposée à celle de l’auteur même du papier. Pour rappel , voici ce que Crowley lui-même dit dans ce papier de ses propres résultats :
- Il y a ainsi deux arguments indépendants de la nature anormale des températures de la fin du 20e siècle. Premièrement, le réchauffement du dernier siècle est sans précédent sur le dernier millénaire. Deuxièmement, ce modèle capable de simuler une bonne partie de la variabilité de la température de l’hémisphère nord sur la période 1000-1850 indique que seulement 25% environ du réchauffement du 20e siècle peuvent être attribués à la variabilité naturelle. L’essentiel du réchauffement du 20e siècle est cohérent avec celui prédit par l’augmentation des gaz à effet de serre. Ces deux arguments supportent de plus l’idée que l’effet de serre anthropique est déjà là.
…et maintenant pour la partie de vrai truand
Bard et Delaygue ont mis à jour un certain nombre d’erreurs d’une nature plus troublante. Courtillot et al. commettent l’erreur de la "Terre plate" d’où provient le titre de notre article : ils donnent une impression trompeuse de la comparaison entre les forçages dû à la variabilité solaire et dû aux gaz à effet de serre, en oubliant de prendre en compte la géométrie sphérique de la Terre et son albédo. Après l’humiliation publique endurée par Le Mouël à ce sujet pendant les débats de l’Académie (voir la partie 1), dans son article paru dans La Lettre Courtillot se donna beaucoup de mal pour montrer qu’il avait bien compris les conséquences de la rotondité de la Terre. Pourtant, cette compréhension nouvelle n’a donné lieu à aucun signe de corrigé envoyé à EPSL, ce qui nous oblige à conclure que la tromperie est délibérée. De plus, dans leur Figure 1, Courtillot et al. montrent des données géochimiques provenant d’une stalagmite des Alpes Centrales, données qui prétendent établir une corrélation très forte entre des variations climatiques et un indicateur de l’activité solaire. Comme le notent Bard et Delaygue, Courtillot et collaborateurs ont caché le fait que la corrélation est aussi bonne précisément parce que la chronologie des séries comparées a été finement ajustée afin de maximiser expressément la corrélation. Les données originales non ajustées ne montrent pas une si bonne corrélation.
La pièce de résistance de Courtillot et al. est le graphe suivant, qui prétend montrer que durant presque tout le siècle dernier la température a été fortement corrélée avec l’activité solaire et la variabilité du champ magnétique. Les trois courbes du graphe sont, d’après le papier, l’enregistrement de la température moyenne globale de Phil Jones (Tglobe, ronds rouges), une reconstitution de l’irradiance solaire totale (S(t), triangles roses; Courtillot cite la reconstitution de Solanki dans le texte), et un index de la variabilité du champ magnétique pour un site en Ecosse (ESK, en bleu) et le site de Sitka en Alaska (SIT, en vert). Les courbes ont été centrées pour avoir les mêmes moyenne et déviation standard sur leur période d’enregistrement afin qu’elles soient plus proches. Notons que la courbe S(t) s’étend sur une période plus courte que les autres; ceci aura son importance.
Impressionant, hein? Et bien cela le serait aux petits détails près que "S(t)" n’est en fait pas l’irradiance solaire totale, "Tglobe" n’est en fait pas la température moyenne globale de Phil Jones comme annoncé, et ni "ESK" ni "SIT" ne ressemblent vraiment aux indices plus larges géographiquement de variabilité magnétique qui sont des indicateurs plus fiables de l’activité solaire. Bard et Delaygue ont trouvé curieux que Courtillot n’utilise que la toute fin de la reconstitution de Solanki alors que le siècle entier est disponible. Ils ont vérifié ce que la courbe donnerait si elle était normalisée sur toute sa longueur. C’est la courbe grise en gras dans leur version corrigée de la figure ci-dessous. Pour comparaison, la courbe violette avec des triangles correspond à la reconstitution de Solanki tronquée sur la même période que celle choisie par Courtillot.
Vous saisissez ? En découpant le dernier bout de la courbe et en le normalisant à une déviation standard, Courtillot gonfle la variabilité et rend la corrélation meilleure qu’elle ne le serait en utilisant la totalité de la courbe. Comme morceau de manipulation trompeuse de données, celui-ci doit rejoindre dans les tréfonds de l’Histoire le lissage sélectif utilisé pour certains enregistrements solaires, comme discuté par Damon et Laut dans leur critique des travaux danois sur le soleil. Maintenant, dans sa réponse à Bard et Delaygue (il y a toujours une Réponse à un Commentaire), Courtillot s’enfonce encore un peu plus. Il déclare que la raison pour laquelle il a utilisé une série solaire tronquée est que les données ne proviennent pas de Solanki (comme suggéré dans le papier) mais en fait de sorties du modèle SOLAR2000 de Tobiska. Le papier de Tobiska n’est même pas cité par Courtillot et al. (2007), alors que Solanki (2002) y est cité comme dans les papiers précédents de ces auteurs sur des sujets similaires. Il n’y a aucune raison valable pour utiliser SOLAR2000 dans une étude comme celle tentée par Courtillot et al. car, comme le notent Bard et Delaygue, le modèle SOLAR2000 est limité à la petite fraction ultraviolette du spectre solaire, ce qui n’en fait pas le bon choix, sauf si on s’intéresse explicitement à des phénomènes liés au forçage des ultraviolets (voir Lean, 2002). On peut penser que Courtillot et al. sont allés pêcher ces données dans la mare la plus proche, parce que c’était la première courbe trouvée qui leur donnait quelque excuse pour tronquer l’enregistrement de façon à obtenir le résultat voulu.
Bard et Delaygue ont remarqué autre chose d’étrange. La courbe "Tglobe" de Courtillot ne ressemble pas vraiment à celle publiée par Phil Jones. La courbe de Phil Jones, provenant de ses vrais fichiers de données, est représentée dans la version corrigée par Bard et Delaygue de la figure. Ils ont également ajouté la reconstitution de la NASA pour comparer. Ces deux courbes sont en accord, mais aucune ne montre la succession rapide de réchauffement/refroidissement entre 1940 et 1970 visible sur la figure de Courtillot. Alors si les données de Courtillot ne sont pas les températures moyennes globales de Phil Jones, qu’est-ce-que Courtillot a représenté ? Nous ne le saurons peut-être jamais. Dans sa réponse à Bard et Delaygue, Courtillot assure que ses données proviennent d’un fichier nommé : monthly_land_and_ocean_90S_90N_df_1901-2001mean_dat.txt. Bard et Delaygue soulignent cependant que Phil Jones n’a connaissance d’aucun fichier de la sorte dans sa base de données, et ne reconnait dans la supposée courbe "Tglobe" aucune version de la température moyenne globale que son groupe ait pu produire.
Quelle que soit l’origine des supposées données de "Tglobe" utilisées dans le papier de Courtillot et al., il n’y a aucune raison valable -dans un papier publié en 2007- pour tronquer la série de températures en 1992 comme ils l’ont fait. Il y a, cependant, une très bonne raison illégitime, dans le fait que tronquer cette courbe de la sorte aide à cacher l’amplitude de la tendance au lecteur, ainsi qu’à raccourcir la période pendant laquelle la discordance entre l’activité solaire et la température est la plus flagrante.
Dans le graphe corrigé, Bard et Delaygue représentent également l’index géomagnétique "aa". C’est un index basé sur deux stations situées aux antipodes, index qui se trouve bien corrélé avec la variabilité géomagnétique globale estimée à partir d’un réseau plus large de stations. On peut montrer que si on s’intéresse aux températures moyennes globales, l’index aa représente une meilleure base de comparaison que les enregistrements de station unique située à haute latitude nord utilisés par Courtillot. Notez que l’index aa suit bien l’irradiance solaire de Solanki, à la différence des mesures de station unique.
Dans le graphe corrigé, Tglobe, aa et S(t) se suivent en augmentant de 1900 à 1940, mais notez que les gaz à effet de serre augmentent aussi de façon monotone sur cette période, et après bien sûr. Une attribution purement statistique pourrait imputer presque tous les changements entre 1900 et 1940 à la variabilité solaire ou magnétique, mais la même technique pourrait les imputer aux gaz à effet de serre. Seule la physique permet de trancher sur cette responsabilité. Cependant, depuis 1940, il n’y a pas la moindre apparence de corrélation entre Tglobe et S(t) ni avec aucun des indices magnétiques. L’index solaire et l’index aa présentent tous deux une bosse vers 1950, alors que la température est constante ou en diminution. L’analyse erronée de Courtillot repousse, elle, l’absence de corrélation jusqu’en 1985.
Entre le ‘show’ embarrassant lors des débats à l’Académie et le pastiche de science exposé par Bard et Delaygue avec le papier d’EPSL, vous penseriez que Courtillot serait à la recherche du plus proche trou de souris pour s’y cacher. Bien loin de cela, il a été aperçu récemment donnant une présentation au titre de "Quel réchauffement climatique ?" à cet événement prestigieux regroupant de nombreux physiciens et chimistes de renom. Certaines personnes ne connaissent pas la honte.
Postlude : de l’or et du plomb
Bard et Delaygue concluent avec une figure, reproduite ci-dessous, qui illustre bien ce que nous disons depuis des années à RealClimate. Sur cette figure ils ont représenté la température moyenne globale de Phil Jones avec un index global magnétique (l’index aa), un index du flux de rayons cosmiques (Climax), et la série composite PMOD des mesures satellitaires de l’irradiance solaire. Ces courbes sont moins lissées que celles du graphe précédent. La variabilité inter-annuelle de la température est liée à des causes naturelles comme les éruptions volcaniques majeures, les événements ENSO, et la variabilité solaire. Cependant, seule la courbe Tglobe est caractérisée par une tendance à l’augmentation très significative -une tendance qui ne peut être expliquée par ces causes naturelles.
Répétez-le trois fois chaque soir avant d’aller vous coucher : la température augmente. L’influence solaire monte et descend, monte et descend, monte et descend. Vous ne pouvez pas plus transformer ça en une tendance que faire de l’or à partir du plomb.
Une note ajoutée aux épreuves, concernant la "Note ajoutée aux épreuves"
La discussion ci-dessus était basée sur les versions du Commentaire de Bard et Delaygue et de la Réponse de Courtillot telles qu’elles étaient disponibles sur le site Internet de Elsevier jusqu’au 15 décembre. Depuis le moment de son écriture, des changements étranges ont eu lieu sous la direction de l’Editeur responsable, Robert van der Hilst du MIT. Il a effacé la "Note ajoutée aux épreuves" de la version finale du Commentaire de Bard et Delaygue. Bard et Delaygue ne l’ont découvert qu’en recevant les épreuves de leur Commentaire. Ce qui est encore plus dérangeant est que van der Hilst a autorisé Courtillot à modifier le texte de sa Réponse en se basant sur ce que Bard et Delaygue ont écrit dans la "Note ajoutée aux épreuves" maintenant effacée. Bard et Delaygue n’ont eu aucune possibilité de voir ou de commenter ces changements. J’ai laissé la discussion ci-dessus comme elle l’était, afin que le lecteur puisse se faire une meilleure opinion de cette étrange histoire de succession commentaire/réponse.
Dans la version révisée de sa "Réponse", Courtillot admet maintenant que la série de température appelée "Tglobe" ne provient d’aucune base de données de Phil Jones. Courtillot déclare maintenant que ses données proviennent d’une étude de Briffa et al. (2001), en indiquant l’adresse sur Internet du fichier entreposé au NCDC. Comme spécifié dans cette étude ainsi qu’en entête du fichier, les données ont été “recalibrées pour estimer les températures moyennes d’avril à septembre pour les régions continentales situées au nord de 20°N”. Les données de température utilisées par Courtillot ne correspondent donc absolument pas à Tglobe, ne représentent pas l’hémisphère entière, et de plus ce ne sont même pas des moyennes annuelles.
Rob van der Hilst — ancien visiteur de l’IPGP (l’institution de Courtillot)– assure que ces modifications ont été faites dans l’intérêt de la communication scientifique. Je laisse au lecteur juger si ces actions ont été appropriées, ou si elles n’ont été qu’une tentative pour tirer Courtillot de l’embarras. Dans l’intérêt de la communication scientifique, j’annexe ci-dessous le texte entier de la "Note ajoutée aux épreuves" qui a été enlevée du Commentaire de Bard et Delaygue :
Note ajoutée aux épreuves :
Dans leur Réponse à notre Commentaire, Courtillot et al. déclarent que pour la courbe d’irradiance totale S(t) ils ont utilisé le produit du modèle SOLAR2000 de Tobiska (2001) au lieu de la série de plus d’un siècle de Solanki (2002) citée dans leur papier original (Courtillot et al. 2007). Cependant, le modèle SOLAR2000 est restreint à la composante UV et leur irradiance solaire totale est fortement biaisée, comme souligné par Lean (2002).
Pour la courbe de température globale Tglobe, citée comme étant de Jones et al. (1999) dans Courtillot et al. (2007), ces derniers déclarent maintenant dans leur réponse qu’ils ont utilisé le fichier de données suivant : monthly_land_and_ocean_90S_90N_df_19012001mean_dat.txt. Nous n’avons pu trouver ce fichier, même en contactant son auteur présumé qui nous a spécifiquement déclaré qu’il ne s’agissait pas de l’un de ses fichiers (Dr. Philip D. Jones, communication écrite datée du 23 oct. 2007).
Tobiska, W. K. 2001, Validating the solar EUV proxy, E10.7, J. Geophys. Res. 106, 29,969-29,978.
Lean, J.L., 2002. Comment on ”Validating the solar EUV proxy, E10.7” by W. K. Tobiska. J. Geophys. Res. 107, (A2), 1027, DOI: 10.1029/2001JA000137.
Gavin: Steve M. said “I strongly endorse the principle of authors providing detailed data citations (with URLs) although Courtillot et al are hardly unique offenders in this respect.” With respect to your concerns cited in this blog you must agree with Steve M on this point…right? Just throw your considerable weight behind the release of detailed citations from all scientists, modelers,… Makes sense.
[Response: I’m in favor of motherhood and apple pie too. – gavin]
Not even Panco Poultry can eviserate a chicken with more dispatch than Raypierre has shown in his truly nifty reduction with this episode of the Annals of Denial. And, to switch the analogy, he even has time to take Stevie Wonder into the boards, with time to spare to come back and give him another shot, just like that guy who used to play for Boston whose theory of Hockey was “always finish a check.”
It is truly wonderful to see how Real Climate has matured as seen in the comments. We now see a whole audience familiar with the science as generally informed lay persons, and also familiar with the realities of politics in the varied fields of academic writing, science controversy, and plain polemics (ie, there is now very little seen of the last mentioned). And this is on top of a wide readership of people in science who really do know what the topics are all about. And no longer is it a tiny band of climate scientists, there now seems to be a whole regiment of them ready to step in and whale away at the deniers and their like. The writing is apt, the mix of politics and science comes across as comfortable, and the conclusions are beginning to show steel edges.
It was a real pleasure to see how swiftly and neatly this oeuvre mal, it is their word after all, was trussed up and ready for the oven. I visualize the carver going home with a toothpick in anticipation of Christmas dinner. Three cheers for a really great year at Real Climate and may there be many more.
#97 Max, since its off topic I’ll keep my powder dry for when the appropriate subject comes up, its do or don’t, $100 a barrel and how much for renewable now?
I find the arguments given in #82 from a french man, coming from a completely different culture not entirely familiar with North America, very revealing, they are extremely similar if not identical
to the same lame extremely tired contrarian points we’ve been bombarded with in the Americas. This suggests a thread
of ignorance crossing cultural borders, coming definitely from identical sources. A deliberate world wide effort to stall GHG abatements until someone learns to crack Hydrogen from a crude oil molecule.
Re #103: [A deliberate world wide effort to stall GHG abatements until someone learns to crack Hydrogen from a crude oil molecule.]
Err… Don’t we know how to do that now? And what would be the point? You’d still have the carbon sitting around, either emitted as CO2 during the cracking reaction, or as solid carbon – which I’m sure someone would ship off to the nearest coal-fired power plant :-)
Re #104
“Re #103: [A deliberate world wide effort to stall GHG abatements until someone learns to crack Hydrogen from a crude oil molecule.]
Err… Don’t we know how to do that now? And what would be the point? You’d still have the carbon sitting around, either emitted as CO2 during the cracking reaction, or as solid carbon – which I’m sure someone would ship off to the nearest coal-fired power plant”
Yes we do, and the point would be to run the gasifier to produce H2 with which to generate power and remove the CO2 prior to combustion and sequester it in a hole in the ground (check out BP’s website, e.g. DF-I Peterhead or Google Rob Socolow and sequestration)
I’m not a scientist, however, on the issue of academic manipulations of facts, I did raise this concern back in the 80’s during my college days.
When the purpose of an ‘argument’ is to magnify what supports the argument and suppress what is contrary, it makes for a tight persuasive paper at the expense of the truth. How unfortunate for all of civilization, when garbage is recorded in a reference library to later be used by another bad theory trying to prove itself. Could there be a more effective way to keep all of civilization spinning it’s wheels, at best going nowhere in a hurry, at worst sliding back to medieval times? What have we won when we win by these methods? A moment of limelight, or a weekly paycheck for a while, at the expense of your childs future.
While I understand that this post travels well beyond the boundaries of my native USA, I feel compelled to offer some constructive criticism of our American system. Ultimately it should prove a cautionary tale to all regardless of borders.
I’m old enough to recall the time in history when professions had a sacred honor in service to the greater good. Doctors were committed to the Hippocratic oath, Judges and Lawyers were committed to the spirit of the law, Editors in the media were committed to fact finding in current affairs, and Professors in academia were committed to the expansion of knowledge and reason.
Please see the force that has eroded social ethics. Doctors are not obliged to pledge harm none, but are having their studies extended to include business management to prevent themselves from being crushed by two opposing forces wanting the lions share of medical market share: the pharmaceutical industry and the insurance industry.
Lawyers are rewarded monetarily and with media prestige to exonerate the guilty, and Judges are rewarded by exonerating special interest groups for political futures. Editors, like professors in academia, answer to their corporate sponsors, and may not speak contrary to the party line under the duress of loss of tenure/employment. False science, such as what was generated in service to the tobacco industry, and todays argument regarding global warming (what industry ‘fuels’ that false science?), is a direct example of how this trend affects the scientific community.
The common thread bringing harm to social ethics of professions is capitalism, which unchecked, is a sociopathic exploitation of resources for the benefit of a few, at the expense of the truth, and ultimately of the many. Faceless, ruthless, & unaccountable, it will continue to dominate cultures globally until we stop feeding it our power and/or money.
History being interested in honesty, isn’t it long past time to create international laws to limit what should be a mere economic tool from the short sighted harming of the greater good on our long term planet?
RE#102 amongst many others- My question to you is this:
What is repartee in service to, relative to scientific exploration, scientific method, parsing true from false, or anticipating the ramifications of our current energy policy direction?
When science cannot stand on the merits of proven fact, relying more upon the same zero sum game of win or lose a limelight, we all lose.
Blog moments like these, I imagine the cut up comments made by the experts of the time when Galileo was arguing that the world was round. Anyone remember those experts names? LOL
Re #107
“Blog moments like these, I imagine the cut up comments made by the experts of the time when Galileo was arguing that the world was round. Anyone remember those experts names?”
To the best of my knowledge Galileo never made such an argument, but one of the experts he argued with was Kepler since he thought Kepler’s theory that the tides were caused by the moon was a “useless fiction”. LOL
I assume you’re referring to his advocacy of heliocentrism in opposition to church dogma, he was actually allowed to publish as long as he kept in on a theoretical level. The real problem arose when he put the words of the Pope in the mouth of the character Simplicius! A analogy would be Hansen calling the president a fool, of course we live in more enlightened times.
Kelley Sullivan: “The common thread bringing harm to social ethics of professions is capitalism, which unchecked, is a sociopathic exploitation of resources for the benefit of a few, at the expense of the truth, and ultimately of the many.”
Yes, the truth fared so well under Soviet Communism. Are you old enough to remember Lysenko? How about the fact that Soviet chemists were not allowed to study Rare Earth Chemistry because it was of no use in the workers’ paradise.
Kelley, the problem is not capitalism or communism, or religion. The problem is people. And those institutions which most advance civilization are those which have found a way for the self-interests and prejudices of individuals to struggle and cancel each other out (at least mostly). Science is one such institution. Representative democracy another. The competition of free and fair markets a third. Trial by jury, possibly a fourth. In order for all of us to win, we must agree to rules that none of us can win it all.
[Response: This is OT – I’ll delete any further exploration of economic systems on this thread. – gavin]
Isn’t the bigger issue here that such scientific papers accurately disclose their data sources?
Gavin, you say “I’m in favor of motherhood and apple pie too.” Isn’t that a bit flip when discussing the real meat of this issue, the transparency of data in published climate research? You seem to be for this, why not throw your support behind the general principle of accuracy and full disclosure in climate science? We know there are other cases where data is not properly referenced and in some cases not archived at all.
[Response: The issue here is the manipulation of data to make a case that is not supported by the data at all. As for the rest of our point, how could anyone be against accuracy? and the more openness the better. But there are plenty of issues in data archiving that remain problematic – how to deal with age model changes or updates, what’s an appropriate level of detail, how to encourage publication of data directly and have people be properly credited, how to rescue old data from floppy disks etc. I might do a general post on the subject at some point, but none of this has anything to do with the case here. To make the point that data management is much more important that simple archiving, look at the PCMDI CMIP3 archive. The same data from GISS is there as is on our website, but so is data from another 20+ groups in the same format and for the same experiments. It’s much more useful than 20 separate and incompatible websites would be, and took enormous effort to put together (I might do a post on that as well). The equivalent effort has not been made for most kinds of climate data, and. yes, it needs to be. – gavin]
1st post from a total novice and non-scientist to AGW. I am persuaded by RealClimate, Stewart Weart, IPCC, and a variety of other sources that AGW is real and potentially problematic, with real effects currently manifest. Nevertheless, I am glad for sites like Climate Audit and some others that raise (what appears to me) legitimate questions and criticisms forcing attention and response from RC, etc,; including to possible missteps by RC and others.
Question: 500K years from now, when looking at a 1M year timeline of Temperatures as a continuation of current ice core graphs, and assuming a medium to worst case AGW scenario, will the graph show a blip or a spike that is obviously and totally anomalous or otherwise out of the ordinary compared to the type of ‘saw toothing’ the current ice core graphs or other proxie graphs show? At that time, of course, one will be able to label the spike and sequelae “Fossil Fuel AGW”, but will that spike and following graph line be readily apparent as a gross catastrophic anomaly? Or could it just as well be viewed as a more or less chaotic climate shift not terribly unlike the innumerable other ones in the preceding 1 million years on the graph?
Shelama (111) — That depends on how much carbon is added to the active carbon cycle. A good paper is A movable trigger: Fossil fuel CO2 and the onset of the next glaciation by Archer & Ganopolski.
Richard, you’ve drifted off again from the words, you’ve taken a specific description of a specific graph, this one:
https://www.realclimate.org/BD3.jpg
The description _of_that_chart_ uses the words you’re stuck on.
Look at the chart. What do you see there?
Solar goes up and down. Temperature goes up.
You wanted a more general explanation of … something about how the ocean lag time works.
You said you’ve read about that somewhere.
What did you read? Where did you read it?
You said you don’t want to do the equations, you want to do words. This isn’t working for you.
_Can_ you follow the equations? If not please say so.
JimR, One is reminded of the jibe by Andrew Lang:
“He uses statistics as a drunken man uses lampposts – for support rather than illumination.”
The preponderance of the evidence has pushed scientists to accept anthropogenic greenhouse gasses as the cause of the current warming epoch–nobody started out with that hypothesis and then looked for “evidence” for it. The denialists seem to be willing to torture any dataset until it tells them what they want.
#113
1. I did not say I read it, I said I *heard* it. The source is not known to me. Perhaps the source is not even reputable. For the purposes of argument, the source doesn’t matter.
2. I did not say I “don’t want to do the equations”. I suggested it would be best to avoid them if possible. If not, go for it. (You and/or Ray were the ones who suggested it would be a challenge in a text blog, not me. Gavin didn’t seem to have any difficulty with it.) My only concern about an overly simplistic proof involving differential equations is that it might not capture the relevant aspects of ocean dynamics.
3. I’ve seen the graph – just as I’ve read Wunsch and Pierrehumbert. These are the source of my question. What do you hope to prove by pointing to something I’ve already seen?
4. You can berate me all you want. You can cheer on other readers who find raypierre’s argument intuitive and encourage them to mob me. That is not a proof. That is not how science works. I would encourage you to forget the messenger. Argue the argument.
5. Again, for the 3rd time, I suggest we drop this for now and pick it back up when raypierre is back.
6. I will not reply to the numerous red herrings raised in the other thread. I think it would be counterproductive.
#110 Gavin – I appreciate the comments on the need to properly archive data. While much of this article was about other things an important factor was the confusion over the source of data used by Courtillot. There seem to be many cases similar to this where it is difficult to find the actual source data and in some cases it is not made available at all. My comment about accuracy was regarding accurately referencing available data upon which a paper is based, a problem in this situation as well as in other areas in climate science.
I look forward to reading your post on properly archiving of data. As a layman it baffles me that in many cases data paid for with tax dollars is not made publicly available, at times in spite of NSF rules regarding such archiving. [edit] It would be a shame for all their data to be lost.
JimR, the issue being raised in this article isn’t that the data wasn’t available it is that the data used in the paper was noticeably different then sources it cited. Had the paper properly cited the source of data to begin with no search for the real source would have been required. The greater issue, of course, remains that when the correct data was used and handled/presented properly the results directly weakened or contradicted the conclusions of the paper.
Richard:
The best response to you is that you appear not to have done enough searching of this very site to avoid raising points that are settled, and that have been explained patiently so many times everyone but you is completely sick of rehashing it all.
Grist, coby beck, realclimate, tamino, eli rabbett, deltoid, many others have well organized lists of reasons the objections raised by Climate Audit are wrong across the board (with mostly trivial exceptions).
The rest of your posts seem to be the very abuse you are projecting on others.
No one is mobbing you, you are raising the red herrings, not us. Nor do you, in fact, understand how science works – or if you do, you’re choosing not to demonstrate that fact.
Marion, 113 was my mistaken posting — in this _wrong_thread_ — meant to be a reply to Richard in the other thread. As a kindness, please don’t extend the digression here. My bad.
In AGU news, from the top of the atmosphere:
GEOPHYSICAL RESEARCH LETTERS, VOL. 34, L24707, doi:10.1029/2007GL031409, 2007
A strict test in climate modeling with spectrally resolved radiances: GCM simulation versus AIRS observations
http://www.agu.org/pubs/crossref/2007/2007GL031409.shtml
“We compare the clear- and total- sky spectra simulated from the Geophysical Fluid Dynamics Laboratory GCM using a high resolution radiation code with the AIRS observations. …”
There are some interesting bits in the abstract that suggest someone with access to the full article might find it worth reading and talking to us about. Hint hint (grin) …
“Say it three times every night before going to sleep: Temperature goes up. Solar stuff goes up and down and up and down and up and down. You can no more make a trend out of that than you can make a silk purse out of a sow’s ear.”
I guess I’m one of the stupid ones that doesn’t get the physics here. In the past we have had many trends, and like today, the “solar stuff” was going up and down. But we didn’t have man made CO2 and the CO2 increases that did happen followed temperature by centuries. So if the volcanoes had cycles, the solar irradiance had cycles, etc. How did we get trends in the past that exceeded the cyclic period of what we are calling natural components of climate variability. Do you consider a hundred year trend to be an anomally in the temperature record? Regarding solar cycles going up and down, can we account for the effects of a number of very active cycles, shortly spaced together, as opposed to a number of very inacative cycles, widely spaced apart, by simply saying they go up and down. Can cycles not have a cumulative effect?
Tilo, look at the chart, that’s what the words are describing. They are not describing the entire long timeline of climate on the planet, they’re describing the directly measured period we know best. The past hundred years are an anomaly because we are here, active, and able to measure our own effect.
Tilo, First, think about the mechanisms by which CO2 would be released in a natural warming event–warming begins, say via increases insolation due to Milankovitch cycles, melting permafrost and warming the oceans. CO2 begins to be emitted from peat bogs and from the warmer oceans (remember CO2 solubility decreases with temperature). The released CO2 acts as a feedback, intensifying and prolonging the warming event past the end of the orbital confluence that started it. There are at least a few events where the onset seems to have been due to increased CO2, but these were in atmospheres very different from our own.
As to cyclic input giving rise to monotonically increasing output. Think about a harmonic oscillator. In general it will tend to follow the input driver. It oscillates at its resonant frequency, and if an input drives it at this frequency, you will see oscillations of increasing magnitude. However, system response is still oscillatory. This is very different from what we are seeing in the climate. First, the drivers (insolation, etc.) are not really periodic. Second, the global temperature is increasing at a pretty steady rate–there’s no way you can get this from a quasi-periodic forcing function. it would violate conservation of energy.
Ray, I probably failed to explain my point about cyclical output very well. Let’s consider a sine wave representing power. Let’s say the sine wave moves between 0 and 1 Watt. We would then expect the average power to be related to the area under the curve. So if our sine wave moved from 0 to 2 Watts, the average power would increase proportionately. So I’m assuming that, say, 5 solar cycles with a high TSI, when averaged over a number of such cycles, would send more energy to the earth than 5 solar cycles with a low TSI. So if we can assume that the oceans act as heat buffers, then couldn’t it take longer than a single solar cycle to see the effects of a number of high activity cycles on temperature? It seems like this effect could be amplified by modifying the sine wave such that the bottoms were longer than the tops during the low activity cycles. This would send even less power to the earth during the weak cycles. We seem to be in a period right now where the normal cycle time of 10.7 years for a cycle has been extended to at least 11.7 years – and it may go longer. The quite time we are spending between cycle 23 and 24 seems to be extended.
You say on your website “But even if we had enough values of the cycle lengths for a reliable statistical analysis, there is another difficulty that is inherent with the lengths: they are measured from a cycle minimum to the next minimum, but the definition of a cycle minimum is not based on any theory. …
…
the next Jovian perihelion is in late March in 2011. I predict that the length of the cycle 23 is in the range of 12.2-13 years. This means a minimum earliest in October 2008 and latest in July 2009 (I use the minimum of 1996.6). This means that the cycle 24 is very low, in the range of 40-70, or a Dalton level. This means that the maximum will be reached only in 2014….”
The predictions are welcome because they’re for the near term; which of the several definitions of ‘minimum’ are you using? In other words, what observation would prove your prediction wrong?
here: http://personal.inet.fi/tiede/tilmari/sunspots.html#alert
Tilo, first, wrt solar cycle–it’s not really periodic. Typically you have 7 years of Solar Max, followed by ~4 years of Solar Min, but Solar max can vary from ~6 to ~9 years, and Solar Min from ~3 to 6 years. Solar cycles lasting up to 14 years have been seen–that’s all “normal” variation.
Second, it you are thinking that somehow the oceans have been storing solar energy from the 1940s, the question is where has it been? Moreover, how can the Oceans be heating the atmosphere when they are also warming? Moreover, when it comes to solar variability, we’re talking more like 1.01 vs 1, not 2:1. If you have a reservoir, all it will do is introduce a phase shift and possibly damping of the output vs the input. It won’t give you a steady rise, like we are seeing now. Moreover, the energy can’t just disappear and reappear 50 years later. It has to be stored somewhere.
Anthropogenic greenhouse gasses explain what we are seeing both qualitatively and quantitatively. There’s no need to posit some exotic mechanism that we understand only dimly or not at all. Science explains the unknown in terms of the known.
I am neither a scientist nor an academic but I am interested in this topic and will be impacted by the effects of climate change.
In my reading and viewing I seem to remember reference to a measurement that calculated the percentage of CO2 in the atmosphere. I believe that the IPCC assumptions are based on 1% but these other numbers indicated that in 10 year increments over the past 30 years the percentage was something like .43%, .46% and .42%.
The points were:
1. Even though industrialization has increased dramatically in past 30 year, why has CO2 volume not increased if human activity is the cause of the problem?
2. If the levels have in fact hovered at about the same levels for 30 years, how does that impact IPCC estimates that assume a more than double 1% level.
If anyone has any information on this, I would appreciate it.
A plain English response is preferred.
No I have not read all 125 posts.
Thank you.
Kelly, try the ‘start here’ button at the top of the page.
If you can remember where you got what you believe, please post a reference or link so we can see what it said.
Once you have a few of the basic terms it’s easier to look these things up. The level of CO2 measured is called the “Keeling Curve” after the man who began making the measurements. Here are some pictures of it, try any of the links:
http://images.google.com/images?q=keeling+curve
The numbers you think you remember seeing look precise, but it’s not clear what they might have meant, even if you remember them exactly.
Kelly, I’m not sure where you are got your info from, but it is incorrect. CO2 has risen from about 280 parts per million by volume (ppmv) to >380 ppmv in the industrial era. It continues to rise rapidly–as indicated by the Keeling curve Hank refers to. And indeed we know the CO2 has come from human activities, since the proportion of the isotope carbon-13 (C-13) continues to diminish–a sign that the carbon going into the atmosphere is from a fossil source.
What you may be remembering is that not all of the carbon we have released has gone into the atmosphere. About 50% of it has gone into the oceans, but their ability to absorb more is not unlimited, and may already be decreasing.
Hello all,
I’m back from a very refreshing holiday break. I have enjoyed reading everything people have posted while I was away, and have especially appreciated the fine responses posted to issues that have been raised. I have very little to add to Gavin’s comments and the comments and responses made by the RC readership, but I have read everything. Thanks to you all for contributing to such a high quality discussion. I will continue reading this, so if there are any points that anybody would like to see addressed at greater length, please do post your query.
At a few points there have been comments on the interest in this story on the part of the French press. In fact, it was also picked up by Figaro, though the story mysteriously didn’t appear in the online version. I want to underscore how impressed I am at the attention the French press has given to such a science-heavy story, and contrast it with a somewhat analogous case where the US press completely dropped the ball. I refer to the issue of the severe criticism leveled by Von Storch et al against the MBH Hockey stick paper, which actually had much bigger consequences for MBH than the Courtillot et al paper had for anybody. The Von Storch et al criticism contributed to what could well be described as an inquisition against MBH, involving even Congressional hearings. A Comment was published showing that the Von Storch criticism was based on a number of errors, some of which seem to have been actively concealed. The comment was peer reviewed and published, just as Bard and Delaygue’s was, and then RealClimate blogged on it to make the issues known to a wider readership. Unlike the case with the French press in the present instance, the response in the US press to the exposure of Von Storch’s errors was deafening silence –even though the papers in question had given prominent space to the inquisition against MBH.
The US press has published some outstanding investigative reporting on climate change issues, but I think that on the whole the French press comes out of this incident looking very good, and the reporters who covered this story at considerable risk to themselves have shown themselves very courageous.
Thanks for the responses.
Let me see if I understand this. IPCC scenarios are based on a 1% ppmv assumption. Does that mean a CO2 level of 10,000ppmv?
[Response: No. You are perhaps confusing a single kind of scenario run (the 1% per year increasing CO2 amount), with the actual amount (which is currently 380 ppmv, and increases to 560 ppmv by ~2080 in that scenario). In the current IPCC report, the scenarios are based on more ‘storylines’ that are not as simple of the 1% increase per year ones from a few years back. – gavin]
What I meant was that the IPCC predicts some terrible climatic changes in the future based on the assumption that CO2 will reach the level of 1% of earth’s atmospheric gasses. Does that mean that CO2 would have to be 10,000ppmv (10,000 is 1% of 1,000,000) for it to equate to IPCC’s 1% ?
[Response: You are more confused than ever. IPCC CO2 scenarios don’t do any such thing. Mostly they ‘stabilise’ at 550 or 750 ppmv. No one is talking about CO2 being 1% of the earth’s atmosphere. – gavin]
Kelly, what source are you relying on for what you believe?
Kelly,
I dimly recall seeing something like your .43%, .46%, .42% series, though unfortunately I can’t remember the source at the moment, either. However, I’m pretty sure that those numbers referred to the observed percent increase in atmospheric CO2 per year. They definitely do not refer to the percent of the atmosphere consisting of CO2. If I recall correctly, the discussion at the time centered around why the yearly increase did not seem to be accelerating, despite the fact that emissions had been accelerating over the same time period. But 1) atmospheric CO2 has consistently been increasing, contrary to what you seem to have taken from what you read, and 2) none of the numbers you have mentioned are close to the observed or projected amount of CO2 in the atmosphere–380ppmv currently, for instance, and projections in the range Gavin mentioned above. Often the sensitivity of the climate to changes in greenhouse gasses is talked about in terms of how much temperature would increase as a result of doubling atmospheric CO2, but a doubling from current levels is still only 760ppmv, a far cry from the 4,200-10,000 ppmv you’re talking about.
Having read your blog for a few years now, I have always been impressed with your evenhandedness in terms of pointing out problems with data sets, analysis, models, etc.
I also understand your annoyance with Dr. Pielke’s statements. Today I find a post at his blog making claims regarding your post that are truly misleading.
He suggests you believe “asking questions about forecast verification is to be tabooo” because you call him a skeptic. Yet, your blog is full of examples were you do question the science and make suggestions on how it could be improved. He has failed to make the distinction between questioning a poorly done critique of the forecast models and an outright ban on making such critiques.
I know both Vincent Courtillot and Edouard Bard quite well. The first one because he belongs to this IPGP “clique” you mentionned and because of which I decided to move to USA (I froze my position at the CNRS and I am now working at the Colorado School of Mines where I am very very happy to work in a wonderful atmosphere). I know also Edouard Bard very well because I spent 9 years in the same institution than him (the CEREGE at Aix en Provence). He is someone very honest, quiet, and I have a high respect for him. I think he was really fed up to listen all this sh… from the IPGP to write this comment. About the IPGP clique, Le Mouel called several years ago the head of my institution, Bruno Hamelin, and asked him to find a way to impede me to work on the french volcanoes (Bruno Hamelin himself gave me this information). Another story: Dominique Gibert, who did his Ph-D thesis with Courtillot, published in EPSL a paper entitled “Electrical tomography of La Soufrière of Guadeloupe Volcano: Field experiments, 1D inversion and qualitative interpretation”, (Earth Planet Sci. Lett. 244 (2006) 709-724). This is my belief that this paper should not have passed the peer-review process and would not have been accepted if reviewed by a real expert in the inversion of electrical resistivity data. However, the Editor of EPSL was at that time… V. Courtillot and the paper was reviewed by phone by … Le Mouel. I co-wrote a comment about this paper: Linde, N., et A. Revil, Earth Planet Sci. Lett. 244 (2006) 709-724), Earth Planetary Science Letters, 258, 619-622, 10.1016/j.epsl.2006.02.020, 2007 (http://www.andre-revil.com/. Now Dominique Gibert has been appointed recently as responsible for the EM effects in the volcanological french observatories. He got few months ago the Dolomieu medal from the french Académie des Sciences (see http://www.geosciences.univ-rennes1.fr/article.php3?id_article=726) for his exemplary work in geoelectrical methods. I let you conclude !!!! This is right that these people have no shame.
Regarding the Global Warming Petition Project by the Oregon Institute of Science and Medicine (http://www.oism.org/pproject/),
do you have any information, pro or con?
Is there more information available on the _peer review(s)?
Names, titles, letters, other documents, conclusions, comments, etc.?
Frank Rapallo
Every example of coerelation without an underlying physical mechanism comes down to the “Lack of Pirates Causes Global Warming” theory doesn’t it? (See Pastafarianism and the Flying Spaghetti Monster).
The so-called debate over global warming, climate change, whatever you want to call it, is a big waste of time. People on both sides of the issue have made up their minds, and are not going to change them, no matter how much time you waste and how many thousands of words you put on the Internet.
If you are actually concerned about AGW, you need to realize that wasting all your time in pointless psuedo-debates is exactly what the deniers want you to do.
Instead, work on getting your side into power, so that the appropriate changes can be implemented as soon as possible.
You wrote: “The piece de resistance of Courtillot et al., is the following graph …”
However, the graphs aren’t visible anymore. Help! I’d greatly appreciate it if you could repair this – I’ve got a colleague who just read the report in the Jan 11 Science and I wanted to show him your analyses.
Thanks so much.
#129
Thank you, raypierre, for your generous invitation to continue the conversation. The “AGU dispatch #4” thread – where some of the discussion on solar-driven ocean heat content took place – is now closed for comments, but perhaps this is the place to follow up.
What do you make of this paper:
Compo,G.P., and P.D. Sardeshmukh, 2008: Oceanic influences on recent continental warming. Climate Dynamics, in press.
They seem to suggest that we have new insights into ocean heating dynamics that could help inform the tuning exercise by which GHG forcing effects were calculated. Is it time yet to revise our estimate of the magnitude of GHG effects? Or is it always a bad time to do that?
As before, I’m interested in the details of how warming gets “in the pipe”, so to speak. This idea that the ocean can not possibly smooth out global temperature fluctuations by storing heat and releasing it over slow time scales relative to atmospheric dynamics.
(Especially relevant given the criticim on other threads of “narrow-minded electrical engineers” who are not so familiar with the dynamics of slow-response systems. Is Earth’s climate a “slow-response” system? (Feel free to define as you like.))
The published version of the paper is:
https://commerce.metapress.com/content/au9x40l201105273/resource-secured/?target=fulltext.html&sid=30gk1gymv3yoqe45c2xige45&sh=www.springerlink.com
DOI 10.1007/s00382-008-0448-9
SpringerLink Date Thursday, July 31, 2008 — $32.00
The August 2007 draft “Submitted to Climate Dynamics” is available:
http://scholar.google.com/scholar?num=50&hl=en&lr=&newwindow=1&safe=off&cluster=18313781490556654380
For anyone with access to both — how does last year’s draft compare to the published text?
I don’t see any differences, Hank. The abstract is identical:
Abstract
Evidence is presented that the recent worldwide land warming has occurred largely in response to a worldwide warming of the oceans rather than as a direct response to increasing greenhouse gases (GHGs) over land. Atmospheric model simulations of the last half-century with prescribed observed ocean temperature changes, but without prescribed GHG changes, account for most of the land warming. The oceanic influence has occurred through hydrodynamic-radiative teleconnections, primarily by moistening and warming the air over land and increasing the downward longwave radiation at the surface. The oceans may themselves have warmed from a combination of natural and anthropogenic influences.
I quickly scanned sections 1-4. No difference there.
The Acknowledgements are also identical:
Acknowledgments
We thank the following colleagues and observational and modeling centers for providing data and model output: P. Brohan, P. Jones, the UK Met Office Hadley Center, and the University of East Anglia Climatic Research Unit for HadCRUT3v; N. Rayner and the UK Met Office Hadley Center for HadISST1.1; J. Hansen and NASA GISS for GISTEMP; T. Smith and NOAA/ NCDC for MLASST; D. Dewitt and the IRI for ECHAM4.5 and
ECHAM5 data; S. Schubert, P. Pegion, and NASA/GMAO for NSIPP data; M. Alexander, C. Deser, A. Phillips, G. Meehl, and the CCSM Climate Variability Working Group for CAM3 data; J. Kinter and the Center for Ocean–Land–Atmosphere Studies for COLA data; and N.C. Lau, J. Ploshay, and NOAA/GFDL for AM2 data. We thank M. Wallace for thoughtful comments. We also thank two reviewers and the editor E. Schneider for suggestions which improved an earlier version of this manuscript. This work was supported by the NOAA Climate Program Office.
Re #118, Marion Delgado:
“The best response to you is … ”
I think the best response to me would have been to answer the question with the best available science.
I don’t think Tilo Reiber in #120 was satisfied with his (or my) responses either. (Tilo, your suggestion in #123 is the question that I asked to start this discussion.)
Raymond, neither Tilo or I understands this so-called physical argument that oceans can’t store heat and cough it up later in the form of smoothed out temperature trends. That is more or less what deep ocean circulation such as THC does. What are we missing?
Richard Sycamore, Well, the question is where would the oceans be storing heat that we couldn’t measure it, and how would it get to the surface without our knowing it. It seems to me that you are engaged in an activity that is fundamentally unscientific–you are trying to explain the unknown in terms of the unknown. You are positing some HIDDEN heat reservoir that manages to somehow unobserved transfer its heat to the atmosphere. Now even if you were to succeed, there’s the small matter of the stratosphere cooling as the troposphere warms. That is very hard to explain without a greenhouse-type mechanism. I am always wary of a single paper that claims to revolutionize a field. It is very difficult for a single paper to overturn a mountain of evidence. Creationists and other anti-science types keep confronting that, but it never seems to sink in.
Ray, what percentage of the ocean’s volume has been sampled by continuous-time temperature sensors over the last 30 years?
I’m not being “unscientific”. I’m pointing to a scientific paper, asking whether it is true that the atmospheric GHG effect has been overestimated, with the solar-ocean connection correspondingly underestimated. How is it “unscientific” to examine new data?
As far as the underlying physics of the GHG mechanism: enough already; I believe, I believe! The question – as always – is the *estimated* magnitude of GHG forcing, NOT whether it is ZERO. “Estimates” require statistical analysis of samples, and are therefore are prone to sampling error, and therefore ought to be periodically revised. So the question here is whether you think this paper will trigger a re-evaluation of that estimate. Looking forward to Raymond’s review.
[Response: Despite what you might have read, this paper offers no information on the forcings at all. It is a very standard procedure (google ‘AMIP’) to run models with observed SST changes and see what happens – most models did that for AR4 and similar experiments can be downloaded at the GISS website. These runs are good at testing teleconnections to ENSO for instance, but they are not any use for attribution of trends since increases (in the real world) in the atmosphere-to-ocean heat flux, emerge as ocean-to-atmosphere heat fluxes (ie. precisely the wrong way around) in AMIP experiments. They also have systematic differences in land relative humidity and variability even when using SST derived from the coupled version of same model. Much of the noise surrounding this paper is based on this assumption that one paper is going ‘to trigger a re-evaluation’ of global warming. It just isn’t going to happen, and thinking (as some appear to), that it is happening every other week is just self-deluding. – gavin]
Re #144
What’s “self-delusional” is supposing that I made assertions that I did not make. Shall I list them? I suppose not, as it doesn’t move us forward. Please, as always, just answer the questions with straight facts. No need to discredit yourselves by labelling my comments as “unscientific” and “delusional” and so forth.
I look forward to your noise-free review of this paper, and your signal-rich replies to my still-unanswered questions on ocean heat content dynamics. Which – as you will recall – stem from Raymond’s poetic remark:
“Say it three times every night before going to sleep: Temperature goes up. Solar stuff goes up and down and up and down and up and down. You can no more make a trend out of that than you can make a silk purse out of a sow’s ear.”
… a remark that suggests to me there is no way, physically, mathematically, to get a periodic power input to produce a temperature trend output. And yet each morning I plug my kettle in, and using AC current channeled through a resistance coil, produce a temperature trend that boils water. Forgive us – Timo and I and a bunch of electrical engineers – we are just trying to understand the mathematical difference between these two systems.
Thanks as always for your patience and interest this question.
[Response: The Earth kettle has been on for millennia (and longer!) – you’d have more of a point if the sun didn’t exist 50 years ago. Except that it did. Without a trend in the long term output of the sun, you aren’t going to see a trend in the Earth’s temperature. It really isn’t that hard. – gavin]
I’m not sure why this is in the ‘Geomagnetic’ thread?
The paper said they were addressing:
“To what degree is [global warming] directly attributable to local GHG increases?”
Is there any model or theory suggesting that warming on land is due to _local_increases_ in greenhouse gas?
Do they mean local _emissions_ as distinguished from, say, locala increases in humidity when wet air blows in from the ocean in a weather front?
It seemed to me as an amateur reader that they were ruling out an unlikely possibility, nothing more. Were they trying to do anything else? Were they trying to show that something (geomagnetic?) is heating up the oceans in some way that doesn’t show up in the oceans but increases humidity over the land? Bu
Hank #146 asks:
“I’m not sure why this is in the ‘Geomagnetic’ thread?”
It’s in the thread where raypierre in #129 said:
“Thanks to you all for contributing to such a high quality discussion. I will continue reading this, so if there are any points that anybody would like to see addressed at greater length, please do post your query.”
Like I said, the original thread where raypierre made the “solar up down, temperature up” comment is now closed. Thread it wherever you like.
But to the point: you disagree with the statements in the abstract?
Re #145
“Without a trend in the long term output of the sun, you aren’t going to see a trend in the Earth’s temperature.”
The last six solar cycles exhibited higher peak sunspot activity and higher TSI than the previous five. There is your trend. That the change in solar activity was fairly sudden and preceded the 1950s temperature rise by a decade or so is not surprising given the time constant of the ocean. The effect of solar is not instantaneous, but is lagged, due to its effect on ocean heat content. How do you account for this lag (of uncertain magnitude) in the attribution model?