It’s worth going back every so often to see how projections made back in the day are shaping up. As we get to the end of another year, we can update all of the graphs of annual means with another single datapoint. Statistically this isn’t hugely important, but people seem interested, so why not?
For example, here is an update of the graph showing the annual mean anomalies from the IPCC AR4 models plotted against the surface temperature records from the HadCRUT3v and GISTEMP products (it really doesn’t matter which). Everything has been baselined to 1980-1999 (as in the 2007 IPCC report) and the envelope in grey encloses 95% of the model runs. The 2009 number is the Jan-Nov average.
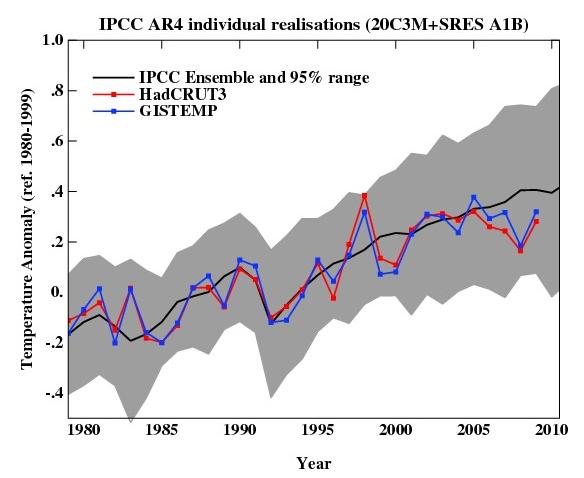
As you can see, now that we have come out of the recent La Niña-induced slump, temperatures are back in the middle of the model estimates. If the current El Niño event continues into the spring, we can expect 2010 to be warmer still. But note, as always, that short term (15 years or less) trends are not usefully predictable as a function of the forcings. It’s worth pointing out as well, that the AR4 model simulations are an ‘ensemble of opportunity’ and vary substantially among themselves with the forcings imposed, the magnitude of the internal variability and of course, the sensitivity. Thus while they do span a large range of possible situations, the average of these simulations is not ‘truth’.
There is a claim doing the rounds that ‘no model’ can explain the recent variations in global mean temperature (George Will made the claim last month for instance). Of course, taken absolutely literally this must be true. No climate model simulation can match the exact timing of the internal variability in the climate years later. But something more is being implied, specifically, that no model produced any realisation of the internal variability that gave short term trends similar to what we’ve seen. And that is simply not true.
We can break it down a little more clearly. The trend in the annual mean HadCRUT3v data from 1998-2009 (assuming the year-to-date is a good estimate of the eventual value) is 0.06+/-0.14 ºC/dec (note this is positive!). If you want a negative (albeit non-significant) trend, then you could pick 2002-2009 in the GISTEMP record which is -0.04+/-0.23 ºC/dec. The range of trends in the model simulations for these two time periods are [-0.08,0.51] and [-0.14, 0.55], and in each case there are multiple model runs that have a lower trend than observed (5 simulations in both cases). Thus ‘a model’ did show a trend consistent with the current ‘pause’. However, that these models showed it, is just coincidence and one shouldn’t assume that these models are better than the others. Had the real world ‘pause’ happened at another time, different models would have had the closest match.
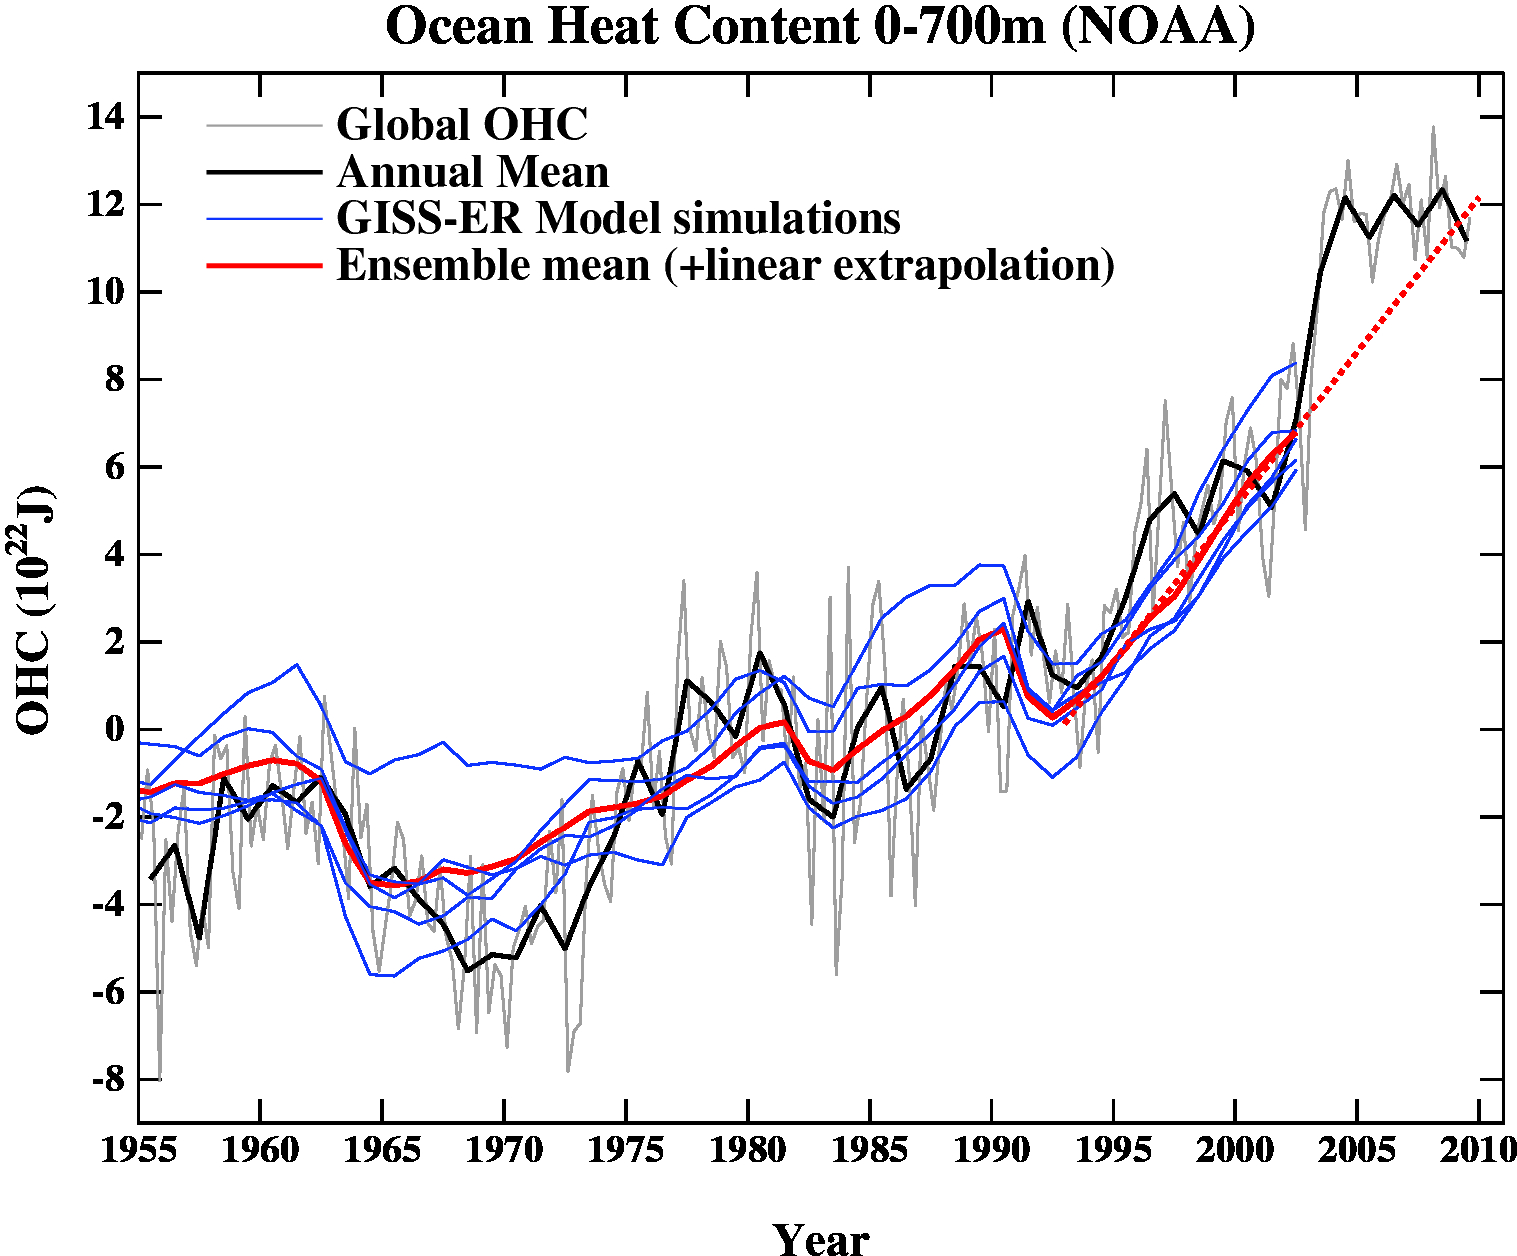
Another figure worth updating is the comparison of the ocean heat content (OHC) changes in the models compared to the latest data from NODC. Unfortunately, I don’t have the post-2003 model output handy, but the comparison between the 3-monthly data (to the end of Sep) and annual data versus the model output is still useful.
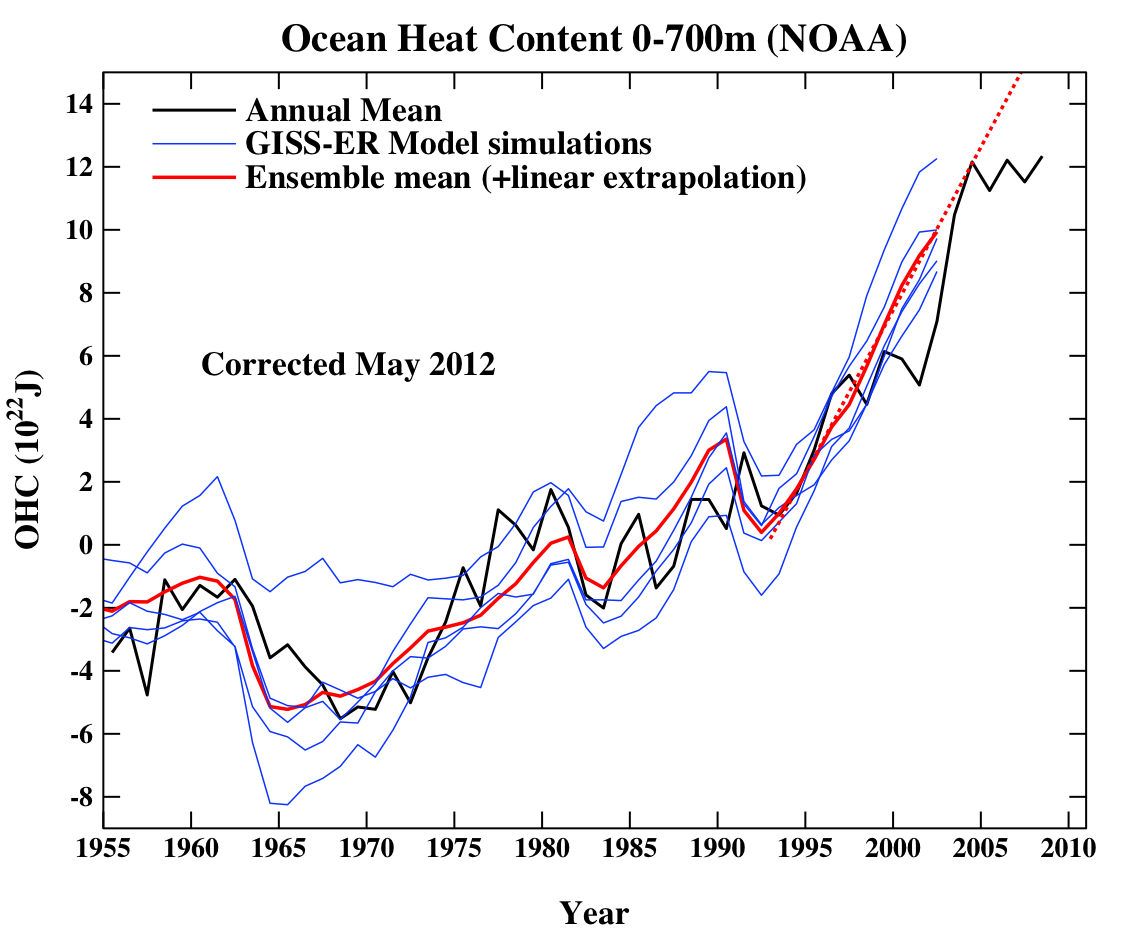
Update (May 2012): The graph has been corrected for a scaling error in the model output. Unfortunately, I don’t have a copy of the observational data exactly as it was at the time the original figure was made, and so the corrected version uses only the annual data from a slightly earlier point. The original figure is still available here.
(Note, that I’m not quite sure how this comparison should be baselined. The models are simply the difference from the control, while the observations are ‘as is’ from NOAA). I have linearly extended the ensemble mean model values for the post 2003 period (using a regression from 1993-2002) to get a rough sense of where those runs could have gone.
And finally, let’s revisit the oldest GCM projection of all, Hansen et al (1988). The Scenario B in that paper is running a little high compared with the actual forcings growth (by about 10%), and the old GISS model had a climate sensitivity that was a little higher (4.2ºC for a doubling of CO2) than the current best estimate (~3ºC).
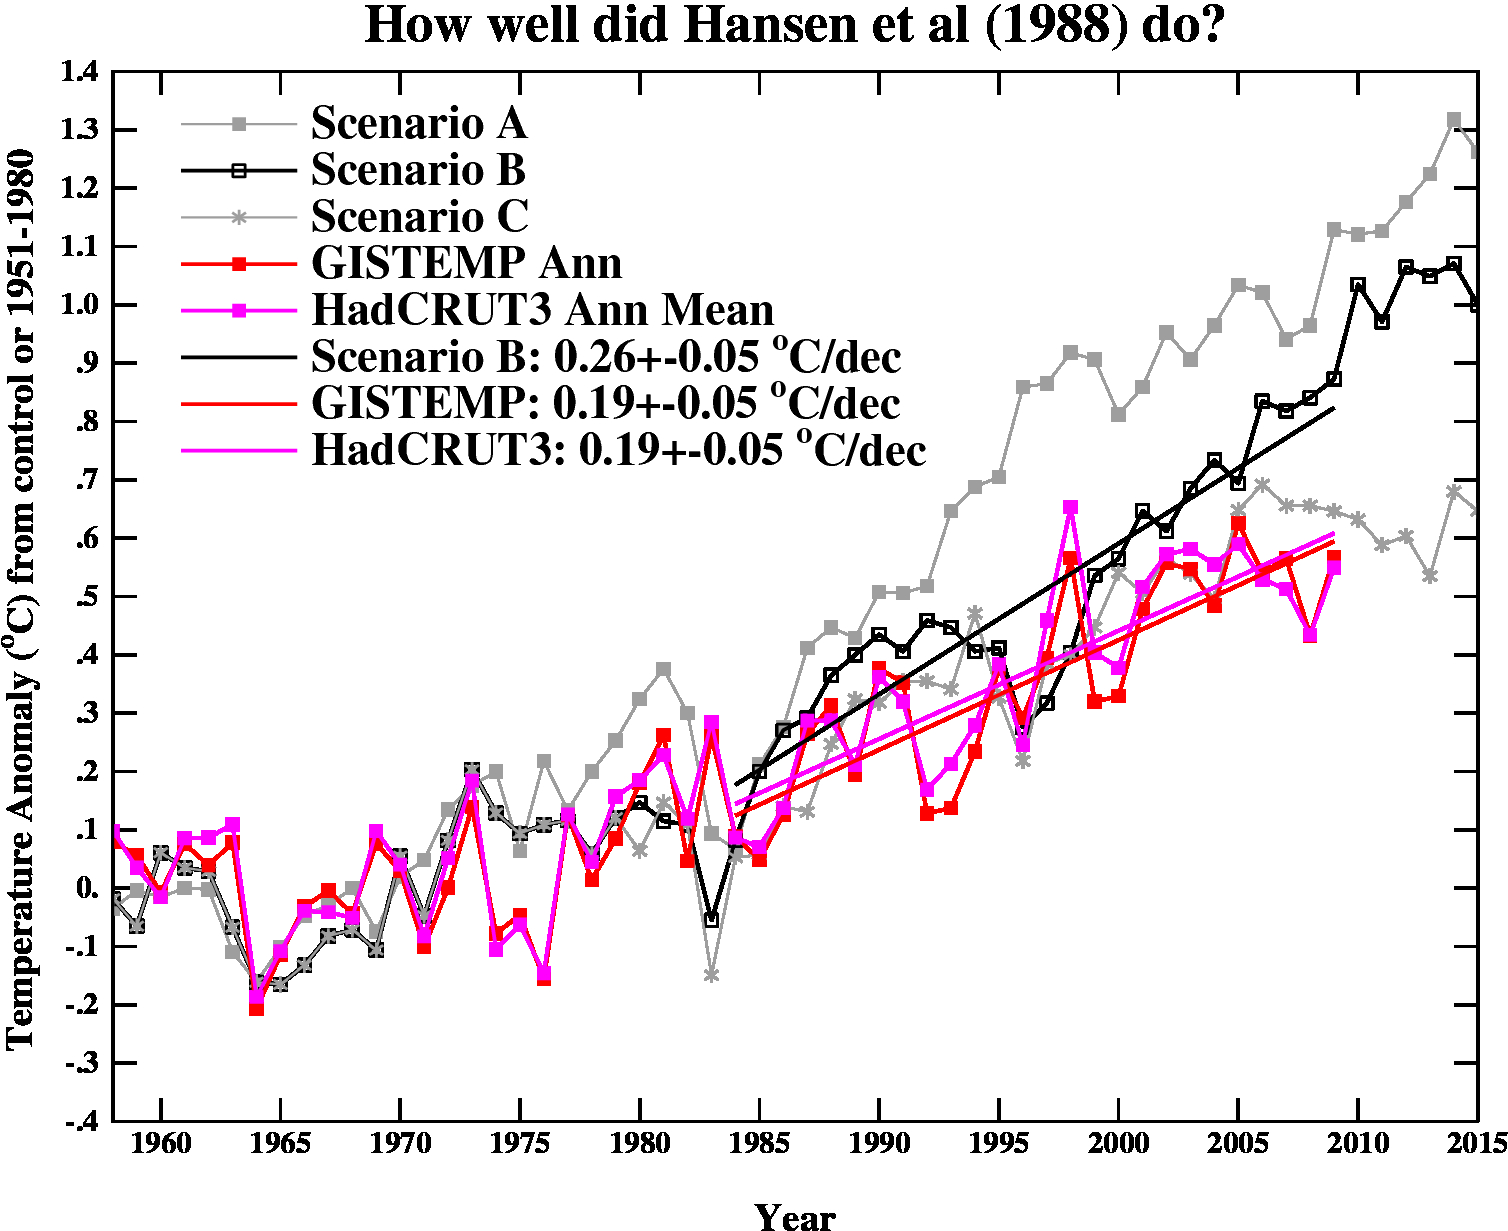
The trends are probably most useful to think about, and for the period 1984 to 2009 (the 1984 date chosen because that is when these projections started), scenario B has a trend of 0.26+/-0.05 ºC/dec (95% uncertainties, no correction for auto-correlation). For the GISTEMP and HadCRUT3 data (assuming that the 2009 estimate is ok), the trends are 0.19+/-0.05 ºC/dec (note that the GISTEMP met-station index has 0.21+/-0.06 ºC/dec). Corrections for auto-correlation would make the uncertainties larger, but as it stands, the difference between the trends is just about significant.
Thus, it seems that the Hansen et al ‘B’ projection is likely running a little warm compared to the real world, but assuming (a little recklessly) that the 26 yr trend scales linearly with the sensitivity and the forcing, we could use this mismatch to estimate a sensitivity for the real world. That would give us 4.2/(0.26*0.9) * 0.19=~ 3.4 ºC. Of course, the error bars are quite large (I estimate about +/-1ºC due to uncertainty in the true underlying trends and the true forcings), but it’s interesting to note that the best estimate sensitivity deduced from this projection, is very close to what we think in any case. For reference, the trends in the AR4 models for the same period have a range 0.21+/-0.16 ºC/dec (95%). Note too, that the Hansen et al projection had very clear skill compared to a null hypothesis of no further warming.
The sharp-eyed among you might notice a couple of differences between the variance in the AR4 models in the first graph, and the Hansen et al model in the last. This is a real feature. The model used in the mid-1980s had a very simple representation of the ocean – it simply allowed the temperatures in the mixed layer to change based on the changing the fluxes at the surface. It did not contain any dynamic ocean variability – no El Niño events, no Atlantic multidecadal variability etc. and thus the variance from year to year was less than one would expect. Models today have dynamic ocean components and more ocean variability of various sorts, and I think that is clearly closer to reality than the 1980s vintage models, but the large variation in simulated variability still implies that there is some way to go.
So to conclude, despite the fact these are relatively crude metrics against which to judge the models, and there is a substantial degree of unforced variability, the matches to observations are still pretty good, and we are getting to the point where a better winnowing of models dependent on their skill may soon be possible. But more on that in the New Year.
Obviously can’t help myself.
@Luke Silburn
I have actually read IPCC AR4 WG1. I won’t claim my comprehension is perfect. I suggest that anyone using AR4 WG1, to support or rebut a particular point of view, reread the document, paying particular attention to the footnotes, definitional changes and so on. No, I haven’t read ALL the references.
If, after reading IPCC AR4 WG1 (and all the referenced literature), you believe that it indicates anything approaching certainty relating to climate change predictability, then go for it.
I seem to provide analogies from time to time. Here’s another.
Dam designers are presumably expert engineers. Large dams are usually Government funded, and cost lots. Designing a dam is a reasonably simple matter, given what is known about material strengths, geology, water flow and the rest. Simulations can be run, and models supposedly effectively predict dam performance over a wide range of conditions. Historical dam failures have been studied, and the models and the engineering takes this into account. Neither the designers or the Government want the dam to fail. Nor do the downstream populations.
Look up dam failures during the twentieth century. I certainly would not live in a community downstream of a large dam, regardless of the fact that the modeling showed (obviously) that the dam would not fail within its design lifetime. Would you?
Anyway, thanks for not trying to shoot the messenger.
@Completely Fed Up.
If you wonder why policy makers might choose to ignore your opinions, I can probably provide the answer.
@ the people who actually bothered to read what I say.
Thank you very much.
Live well and prosper
To all – many apologies.
I prepared a response to @BPL #883. Unfortunately, the blog spam filter caught the “ci-alis” in “speci-alised”.
RC kindly pointed out the problem, and sent back my post. Here ’tis. Definitely. absolutely, positively, probably the last.
– beginning of comment
@ Barton Paul Levenson
You said “You know very well that the inaccuracy of a single
measurement is NOT the same as the inaccuracy of a large number of
measurements.” Yes I do. Much work has gone into “homogenising” data
from both larger and smaller reporting stations. For example, it may
appear to be obvious that certain readings suddenly appear to be 2
degrees higher while the normal observer is on leave. It is worth
while checking that the person making the apparently anomalous
readings was reading a real difference, rather than reading the
installment incorrectly. Sure, if you assume that all the errors
cancel each other out “on the average” you can choose to believe your
results.
My point is that meteorological data collection is possibly as much
art as science, in some instances. After you have emptied the rain
gauge and reset the max / min thermometers etc, who’s to say if you
read them right, or read them at all? I’ve certainly seen some
practices in various countries that could best be described as
“interesting”, to say the least!
I’m not sure about your statement – “And what’s with the crack about
aborigines? You think they’re too stupid to read thermometers? Are you
an Australian, by any chance? A white one, that is.”
My posts would no doubt be a lot longer if I expanded sufficiently to
avert misunderstandings such as this. Maybe I am not clear enough for
you. I was pointing out the realities of collecting meteorological
data at other than sites involving speci-alised full time data
collectors – eg in Australia, those stations staffed by Bureau of
Meteorology staff. Apart from sites such as Giles, Willis Island etc.
these stations are at larger airports, with subsidiary observing
stations at capital city Met. Offices (usually). Remote sensing has
supplanted many of the more remote Met stations.
To provide reasonably widespread data collection given the large area
and relatively sparse population of the arid interior, the Bureau used
(before the introduction of remote sensing equipment on a wide scale)
the services of people such as cattle station managers and owners and
staff, Police Officers at remote localities, and resident civil
service officers at communities too small to warrant a full time
Police presence.
Most remote communities of this nature are composed of Aboriginals (or
as you would call them, aborigines,) Hence my use of the term
“Aboriginal communities.”
But it gets worse, from some perspectives. For example, the first
permanent non-Aboriginal settlement on Groote Eylandt did not happen
until 1921. Temperature records for the whole area were non existent
before then, and for quite a while after, officially at least. For a
community to justify a permanent Government presence it had to reach a
large enough size or be important for some other reason. Once
established it may endure, or not.
As to stupidity, it would depend on the person. By definition, half
the (population -1) is below average intelligence. But that is usually
not the criteria. The observer needs to be capable of understanding
the observational process and the importance of consistency. Also
needs to be capable of providing regular scheduled observations at
specified times as determined by the WMO.
So, you tell me. You have a person who doesn’t speak English. Does not
work at a “regular job”. Is a nomadic hunter gatherer. Has no concept
of timekeeping or counting as we understand it. Cannot read or write.
Has no storage facilities, and is more concerned with finding enough
food to survive in a harsh environment.
Or, would you choose a person who is educated to some degree, can
undertake to provide observations as part of their other duties, and
can accept enough basic training from a visiting Supervising Observer
to be more or less dependable. As a matter of fact, if the Police
Station providing the obs is manned by Aboriginal Police Officers,
they provide the data. What’s the problem with getting the best data
you can?
Without knowing the exact details of the Hadley CRU’s programmer’s
complaints about Australian records, I am guessing that some of his
frustrations came from problems associated with the above.
Additionally, community names may change. For example, many
communities are now referred to by an Aboriginal name. Hooker Creek
becomes Lajamanu and so on. Think of Bombay turning into Mumbai,
Constantinople / Istanbul and so on. Come to think of it, cities in
imperial Russia were renamed in many cases as part of the USSR, only
to be unrenamed as part of Russia again – and not always with the same
pre USSR name.
Yes, I am Australian (and another nationality – dual citizenship.) I
look fairly white, and have mixed ancestors – including European,
Native American, and a few others. Could I ask the relevance? I can
provide you with more information on request, but I don’t want to
waste too much time unless the information would be of use to you.
@Gavin.
I am responding to an a possible misinterpretation of a statement I
made. Maybe the practical difficulties of collecting and interpreting
meteorological data in Australia and possibly other places in the
world could be of use to others without practical experience in such
matters. I believe problems with Australian data have been examined in
other places including the Bureau of Meteorology itself. It occurs to
me that the researchers at the BOM may be unaware themselves of
certain practices used in relation to data acquisition and collation.
Sorry about the length of the post. You may decide to just transmit
the contents to BPL, (or not). Really not concerned one way or t’other.
Live well and prosper.
PS Probably serendipity that there is something flagged as indicative
of spam. I am not trying to get up BPL’s nose, just pointing out
reality.
– end of comment
I have not corrected the error I made. Not relevant. Only the word that resulted in the rejection.
Live well and prosper.
G’day Sepilok–point taken. I do not believe all Australians are racists. That would be as stupid as believing all Aborigines are unable to report temperature measurements.
TOF: By definition, half the (population -1) is below average intelligence.
BPL: You’re SURE you’re a statistician?
Half the population is below MEDIAN intelligence.
I note, with interest, that you’ve responded to my one implication of racist thinking three times. A bit defensive, are we? I’ve noticed before that you spend a lot of time accusing climatologists and liberals in general of being racists–I believe the charges were usually along the lines of “it’s okay to let all those brown-skinned Third Worlders die, of course.” I just thought it would be fun to throw a bit of that back.
Guys who are constantly accusing others of racism on flimsy grounds are sometimes worried about being racist themselves, just as some guys who constantly accuse others of being gay are latent themselves.
I would not, of course, depend on an uneducated aborigine to give me the reading from a thermometer when he never had access to one. But if an aboriginal shaman tells me that in his grandfather’s grandfather’s time, the rivers were higher and there were more trees in the land, and now the rivers are low and the trees are going away, even in areas where the white men have not come, I might take it very seriously.
Mike Flynn,
Wow! Just wow? And I’ll bet some of your best friends are aboriginals, too, huh?
Did it ever occur to you that it might require some “native” intelligence to survive in the outback there in OZ? Did it maybe occur to you that that intelligence might be trained to make accurate readings? Did it not occur to you that if the person–be he aboriginal or not–making the readings was not doing a good job that another person, regardless of ethnicity, might do a better job. I am just amazed.
[Response: This sub-thread is OT. Please no more. – gavin]
Mike Flynn said:
The GHCN homogenisation is almost entirely automated. Take discontinuities, for example. The algorithm doesn’t care whether the discontinuity is caused by a change in instrumentation, a change in the time of day of measurement, a change in the way the daily mean temperature is calculated, or, indeed, a different observer or a switch to an entirely different location altogether. The algorithm eliminates isolated anomalous readings, too – so, if, due to human error, a reading was significantly off, then it gets dropped. If it is in error, but not by enough to be identified as anomalous – then does it matter? The point is that the error is limited.
The homogeneity adjustments can make huge changes to a single station. But despite this, the global mean is almost unaltered. This is extremely strong evidence that the global temperature record is robust, and not dependent on data collection practices at individual stations or groups of stations.
No assumptions are made about the errors “cancelling each other out”. That’s a conclusion we can draw after the homogenisation step.