We’ve been a little preoccupied recently, but there are some recent developments in the field of do-it-yourself climate science that are worth noting.
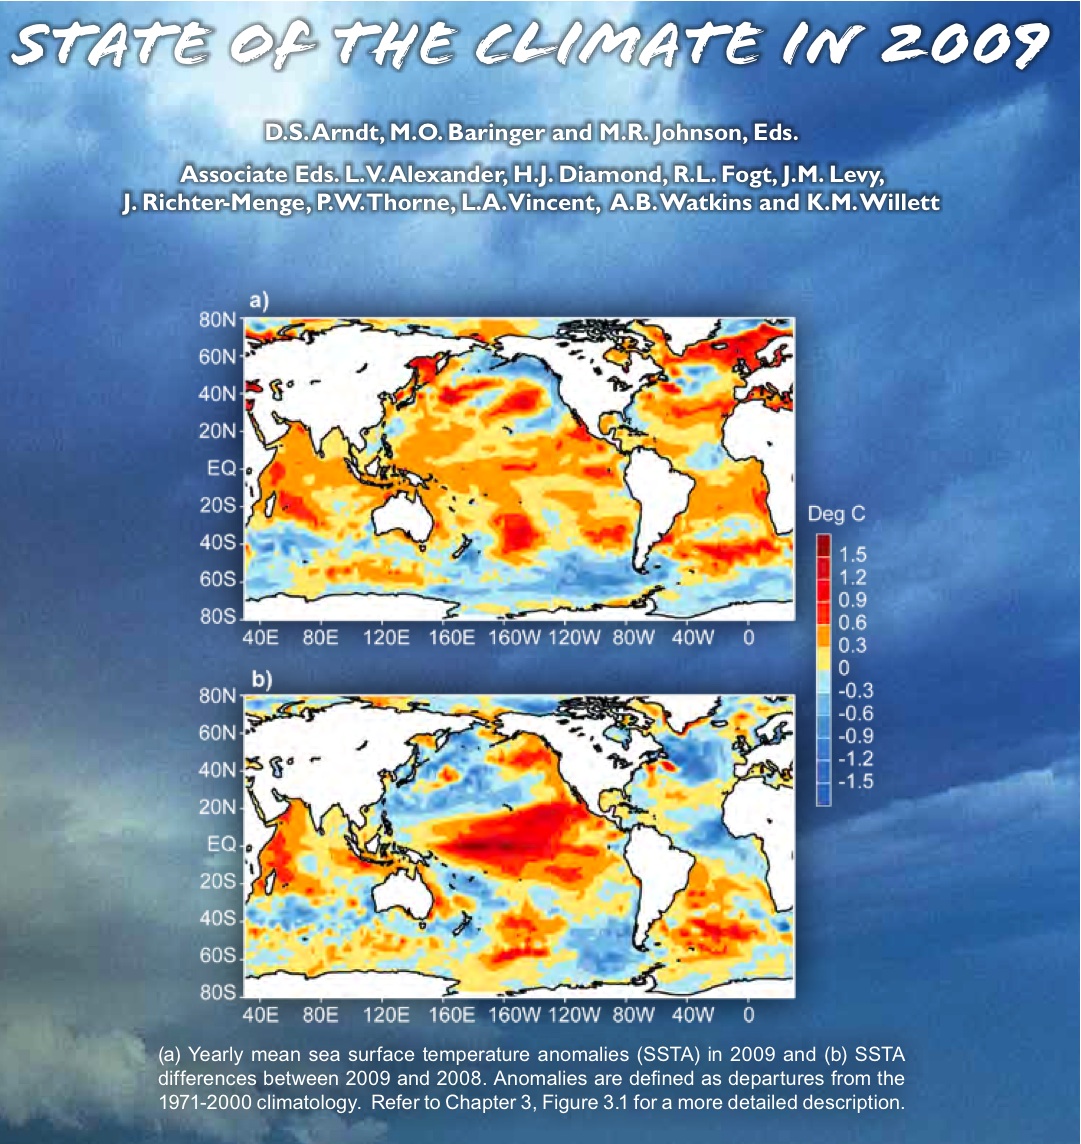 First off, the NOAA/BAMS “State of the Climate 2009” report arrived in mailboxes this week (it has been available online since July though). Each year this gets better and more useful for people tracking what is going on. And this year they have created a data portal for all the data appearing in the graphs, including a lot of data previously unavailable online. Well worth a visit.
Second, many of you will be aware that the UK Met Office is embarking on a bottom-up renovation of the surface temperature data sets including daily data and more extensive sources than have previously been available. Their website is surfacetemperatures.org, and they are canvassing input from the public until Sept 1 on their brand new blog. In related news, Ron Broberg has made a great deal of progress on a project to use the much more extensive daily weather report data into a useful climate record. Something that the pros have been meaning to do for a while….
Third, we are a little late to the latest hockey stick party, but sometimes taking your time makes sense. Most of the reaction to the new McShane and Wyner paper so far has been more a demonstration of wishful thinking, rather than any careful examination of the paper or results (with some notable exceptions). Much of the technical discussion has not been very well informed for instance. However, the paper commendably comes with extensive supplementary info and code for all the figures and analysis (it’s not the final version though, so caveat lector). Most of it is in R which, while not the easiest to read language ever devised by mankind, is quite easy to run and mess around with (download it here).
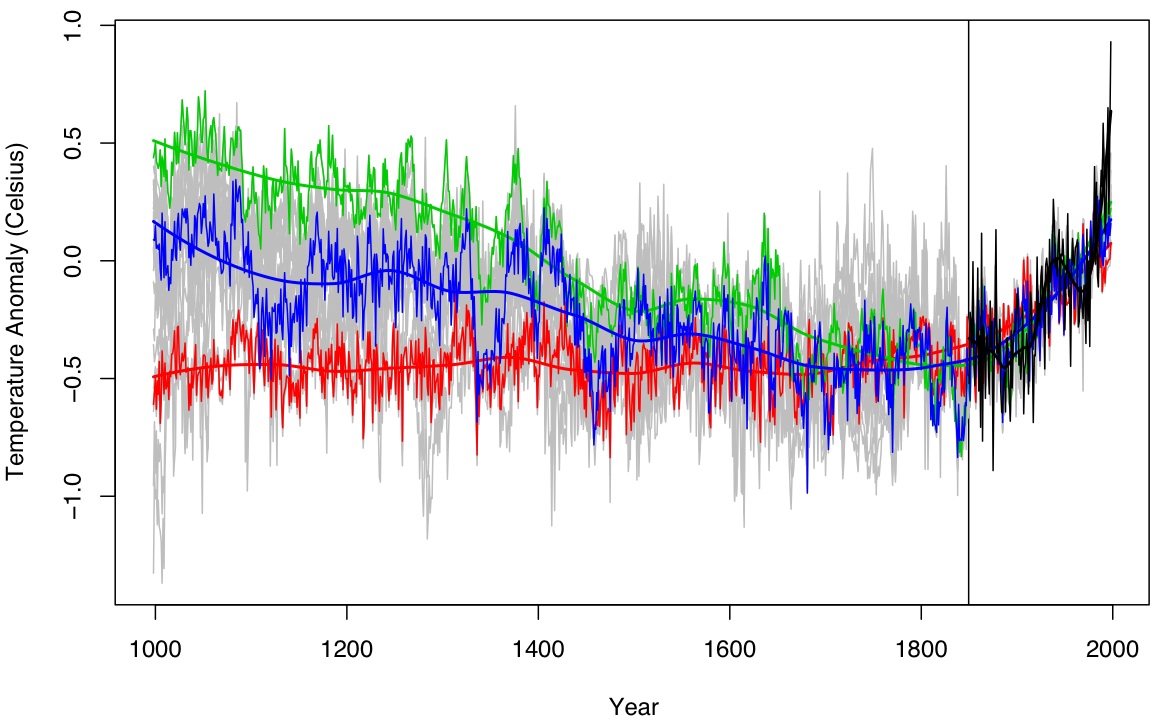
The M&W paper introduces a number of new methods to do reconstructions and assess uncertainties, that haven’t previously been used in the climate literature. That’s not a bad thing of course, but it remains to be seen whether they are an improvement – and those tests have yet to be done. One set of their reconstructions uses the ‘Lasso’ algorithm, while the other reconstruction methods use variations on a principal component (PC) decomposition and simple ordinary least squares (OLS) regressions among the PCs (varying the number of PCs retained in the proxies or the target temperatures). The Lasso method is used a lot in the first part of the paper, but their fig. 14 doesn’t show clearly the actual Lasso reconstructions (though they are included in the background grey lines). So, as an example of the easy things one can look at, here is what the Lasso reconstructions actually gave:
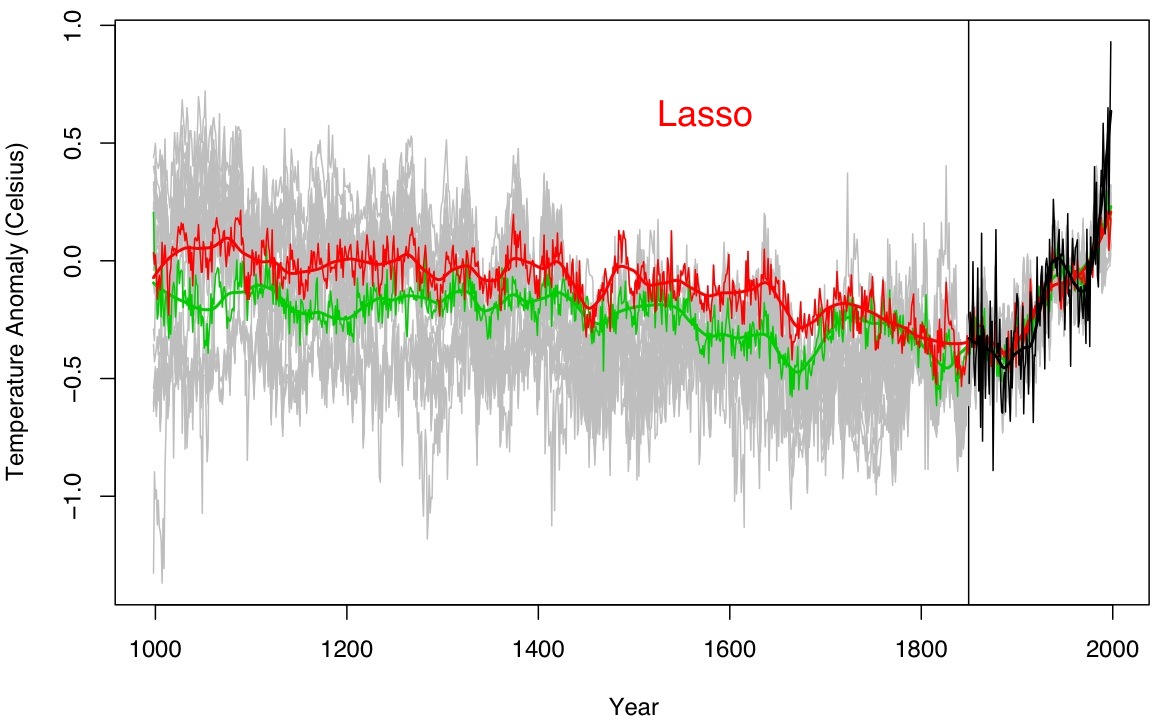
‘Lasso’ methods in red and green over the same grey line background (using the 1000 AD network).
It’s also easy to test a few sensitivities. People seem inordinately fond of obsessing over the Tiljander proxies (a set of four lake sediment records from Finland that have indications of non-climatic disturbances in recent centuries – two of which are used in M&W). So what happens if you leave them out?
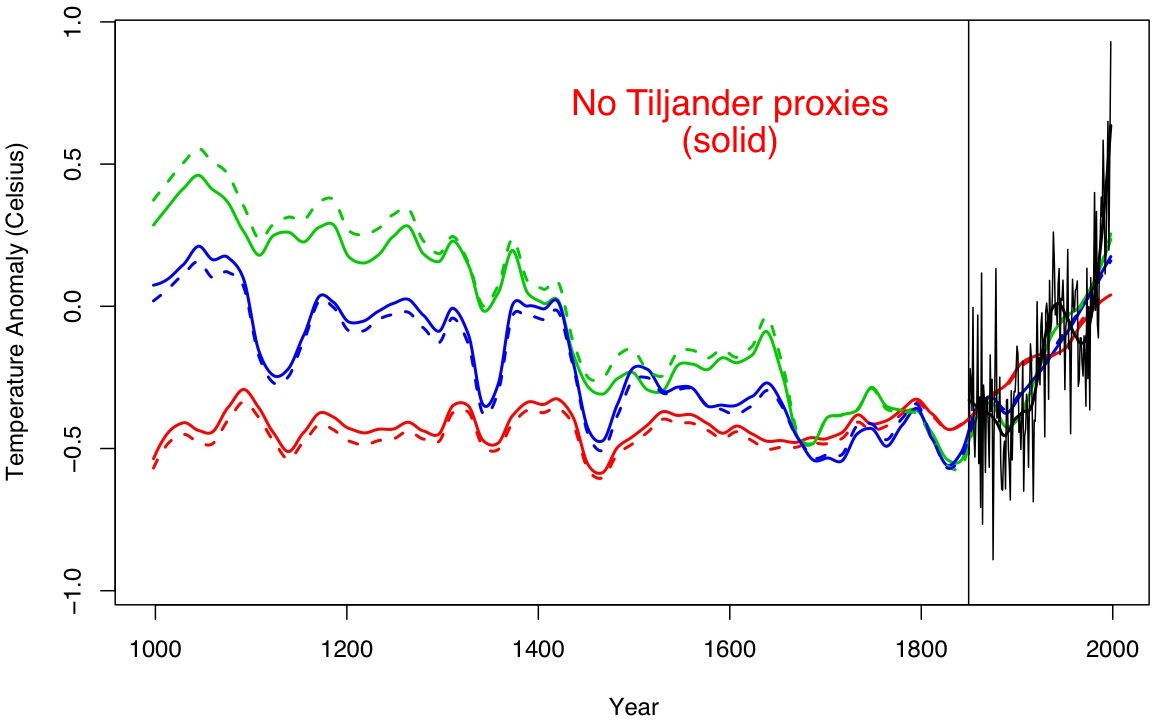
No Tiljander (solid), original (dashed), loess smooth for clarity, for the three highlighted ‘OLS’ curves in the original figure).
… not much, but it’s curious that for the green curves (which show the OLS 10PC method used later in the Bayesian analysis) the reconstructed medieval period gets colder!
There’s lots more that can be done here (and almost certainly will be) though it will take a little time. In the meantime, consider the irony of the critics embracing a paper that contains the line “our model gives a 80% chance that [the last decade] was the warmest in the past thousand years”….
Wally: “I won’t bother to go into a lot of detail, as neither has this poster even attempted to prove such things, but every one of these issues has been debunked.”
Hmm. Let’s see. Rice yields:
PNAS: Rice yields decline with higher night temperature from global warming
http://www.pnas.org/content/101/27/9971.full
http://www.reuters.com/article/idUSTRE6790HS20100810
Poison Ivy?
http://news.nationalgeographic.com/news/2006/05/060530-warming.html
Drought and floods?
http://www.csmonitor.com/Books/2008/0304/p13s02-bogn.html
http://www.nature.org/initiatives/climatechange/issues/art19624.html
You know, Wally, normally when you are going to lie, it’s customary to make it a little more difficult to prove. 3 tiny little Google searches and now you can sweep up the ashes of your credibility.
Oh, and by the way John is a PhD in physics…and so do I. We can recommend texts if you’d like.
Ray, Wally’s information on Rice yields most likely comes from Watts Up With That which is subsequently cross-posted on Climate Skeptic.
He will most likely defer to the blogsites’ version of recent history.
Wally, did you learn in school what’s in Weart’s book (first link, right sidebar)? That book covers up to about the 1980s, so that much history ought to have be in the textbooks in 1992 or so — but I’d be surprised if it was.
Did you take biology? Understand rates of change?
Did you read the ocean pH link above?
Have you read the phenology material in older topics here at RC?
What does “catastrophic” mean to you? It might mean many things
— something so fast it happens in your own lifetime
— something that affects your own wealth?
— something that changes easily one direction but isn’t easily reversed
— something that lasts centuries or millenia
— rates of change faster than anything but an asteroid impact has caused
Or something else. What’s it mean to you?
Somewhat OT
I’ve started a project that I’ve called GoGCM. I wanted to see if anyone would care to comment on the idea and/or how to go about it.
http://gogcm.blogspot.com/
Thanks for any feedback.
Wally:
Ahhh, Wally outs himself as being just another garden-variety cut-and-paste denialist (well, he probably did earlier, but I couldn’t be bothered working through most of his bullshit).
There’s no more massive strawman than the denialist invention … “AGW” vs. “CAGW”.
Wally – please tell us in your own words what you believe to be the difference between the two. Please use numbers, and show your work.
FYI: from Climate Skeptic, Russ R’s latest equations verbatim:
“RE: Hansen (1988) – Autocorrelation issue.
Wally et al,
I spent a few hours last night reading up on the various approaches for identifying and correcting autocorrelation in time series data.
Since I don’t have access to professional statistics software with GLS tools, I’m limited to excel-based OLS methods. I’ve settled on the AutoRegressive (AR) approach, which basically runs a standard OLS regression twice – first regressing the data against 1-period lagged observations to identify and strip out auto-correlation, and second to regress the residuals against the date to identify trend and significance.
Here’s a summary of the preliminary results:
Hansen’s temperature projections (1988-2010)
Scenario: Scenario_A Scenario_B Scenario_C
Slope: β = 0.029844862 0.027396245 0.019274704
(Source: https://www.realclimate.org/data/scen_ABC_temp.data )
UAH data set (1988 – 2010.58)
Observations: n = 271
Slope: β = 0.017105791
Autocorrelation: ρ = 0.834750724
(Source: http://woodfortrees.org/data/uah/from:1988/to:2010.58/plot/gistemp/from:1988/to:2010.58 )
GISTEMP data set (1988 – 2010.58)
Observations: n = 271
Slope: β = 0.017105791
Autocorrelation: ρ = 0.760693177
(Note the higher autocorrelation coefficient for the UAH data.)
UAH AR(1) autoregression
Observations: n = 270
Intercept: α = 0.022953044
Lag-1: β = 0.838341028
GISTEMP AR(1) autoregression
Observations: n = 270
Intercept: α = 0.097138485
Lag-1: β = 0.76108575
Both data sets were stripped of autocorrelation as modeled above, and the residuals used for the next stage of regression.
UAH Residuals regression
Observations 270
Slope 0.019506406
Standard Error 0.006566299
Scenario: Scenario_A Scenario_B Scenario_C
Ho: Slope ≠ 0.029844862 0.027396245 0.019274704
TStat = 1.574472273 1.2015656 -0.035286678
Pvalue (2 tail) 0.115378307 0.229531876 0.971851146
GISTEMP Residuals regression
Observations 270
Slope 0.01920112
Standard Error 0.004669017
Scenario Scenario_A Scenario_B Scenario_C
Ho: Slope ≠ 0.029844862 0.027396245 0.019274704
TStat = 2.279653399 1.755214024 0.015759938
Pvalue (2 tail) 0.022628253 0.079222706 0.987425909
Conclusions: As expected, the T-stats are lower than before. Due to the higher degree of autocorrelation in the UAH data, they only give us 77% & 88% confidence that we can reject the predictions for Scenarios A & B respectively. The GISTEMP data show a significant difference between predictions and observations with 98% and 92% confidence.
As always, please let me know if you have any concerns with the method, and I’m happy to email the spreadsheet I used to anyone who’d like it.
If the above work checks out, I’ll repeat with IPCC (1990).”
[Response: With all due respect, what do you think this means? Forecasts are always ‘different’ from the actuality for all sorts of reasons – and the further out you go, the more different they will be. Yet forecasts still have skill if they get closer to the true outcome than any other method. For instance, a forecast of 0.2 deg C/decade will be statistically significantly different to a reality of 0.19 deg C/dec given a long enough period. However, this is clearly skillful given the alternative of no change. Please think about what you are trying to calculate. – gavin]
BPL: congrats on getting your paper accepted. This is really “doing it yourself” at a very high level.
Oh, Hank, c’mon, you know the answer. It means any scientific result hinting that he might need to abandon his political ideology if he cares about the health and welfare of his kids (present or future).
Wally 289: If we us X dollars to make Y power now, but in the future you need X+Z dollars to make Y power because of cap and trade or what ever legislation, you’ve lost the ability to use Z dollars for other kinds of investments or consumption.
BPL: Unless by doing so you free up W dollars that used to go to health care, lost productivity, funerals, and property damage from the pollution that is no longer being created. Then you might break even or even do better.
SecularAnimist 295,
I agree completely. The AGW issue is radicalizing me very fast. I’ve been a liberal Democrat more or less since I quit the Libertarian Party in 1990, but I never really regarded the GOP as the Party of Evil until they legalized torture and embraced the full-scale war on science (and it’s not just AGW, folks, it’s evolution and cosmology and astronomy and geology and HIV-causes-AIDS). And I’m beginning to seriously doubt that the Democrats, well-intentioned as some of them may be, are capable of doing something about the problem or even understanding it.
The big problem is, most Americans regard themselves as either Democrats or Republicans, usually after generations of family tradition. A third party is very unlikely to be able to win in the time civilization has left. And if one does, it might be the Tea Party.
Brian Dodge 297,
These are great citations, but could you please lists the authors as well?
Wally 300: Most of us in the skeptic camp do agree with AGW, we disagree with catastrophic AGW.
BPL: You’re still wrong.
Waldo, repeating a lie makes one a liar. And lying to oneself counts. I haven’t yet decided whether Anthony micro-Watts is actually stupid enough to believe what he posts. I am less willing to let Willy plead to the lesser charge of stupidity.
Global scale climate–crop yield relationships and the impacts of recent warming
David B Lobell and Christopher B Field stacks.iop.org/ERL/2/014002
Radically Rethinking Agriculture for the 21st Century
N. V. Fedoroff,1* D. S. Battisti,2 R. N. Beachy,3 P. J. M. Cooper,4 D. A. Fischhoff,5
C. N. Hodges,6 V. C. Knauf,7 D. Lobell,8 B. J. Mazur,9 D. Molden,10 M. P. Reynolds,11
P. C. Ronald,12 M. W. Rosegrant,13 P. A. Sanchez,14 A. Vonshak,15 J.-K. Zhu http://www.faculty.ucr.edu/~jkzhu/articles/2010/833.pdf
Rice yields decline with higher night temperature from global warming
1. Shaobing Peng *,
2. Jianliang Huang †,
3. John E. Sheehy *,
4. Rebecca C. Laza *,
5. Romeo M. Visperas *,
6. Xuhua Zhong ‡,
7. Grace S. Centeno *,
8. Gurdev S. Khush § , ¶, and
9. Kenneth G. Cassman ¶ , http://www.pnas.org/content/101/27/9971.full
Nonlinear temperature effects indicate severe damages to U.S. crop yields under climate change
Wolfram Schlenker and Michael J. Roberts http://www.pnas.org/content/106/37/15594.abstract
Biomass and toxicity responses of poison ivy (Toxicodendron radicans) to elevated atmospheric CO2
* Jacqueline E. Mohan,
* Lewis H. Ziska,
* William H. Schlesinger,
* Richard B. Thomas,
* Richard C. Sicher,
* Kate George,
* and James S. Clark http://www.pnas.org/content/103/24/9086.full?sid=2f6085af-a211-4277-8af7-13ddd758df9c
[FWIW, I live about 10 miles from the Duke University FACE site, and have developed poison ivy allergy in the last ten years. I have a magnificent specimen 4 inch diameter poison ivy vine growing on my property, to the top of a ~60 foot red oak.]
Response of an allergenic species, Ambrosia psilostachya (Asteraceae), to experimental warming and clipping: implications for public health1
Shiqiang Wan, Tong Yuan, Sarah Bowdish, Linda Wallace, Scott D. Russell and Yiqi Luo http://www.amjbot.org/cgi/content/abstract/89/11/1843
Changes in biomass and root:shoot ratio of field-grown Canada thistle ( Cirsium arvense), a noxious, invasive weed, with elevated CO2: implications for control with glyphosate, Weed Science, 52:584–588. 2004
LH Ziska, S Faulkner, J Lydon http://ddr.nal.usda.gov/dspace/bitstream/10113/10283/1/IND43643718.pdf
Rising CO2, Climate Change, and Public Health: Exploring the Links to Plant Biology
Lewis H. Ziska, Paul R. Epstein, and William H. Schlesinger http://www.ncbi.nlm.nih.gov/pmc/articles/PMC2649213/
[This source for my snarky comment about more morphine(e.g. stronger heroin, not really a good thing – more OD’s, more profit for Afghan warlords) is a good overview with links to a lot of other work]
RV 306,
I haven’t submitted the paper yet. I need to have some climate scientist look it over to make sure I didn’t include some dumb mistake that will get it rejected on the first pass. Tamino is looking at the statistics for me.
256, Hank Roberts: Wally, ocean pH change is better understood and faster than climate change:
http://www.nature.com/nature/journal/v425/n6956/abs/425365a.html
http://www.nature.com/cited/cited.html?doi=10.1038/425365a
I couldn’t access the article, only the abstract. Turnabout is fair play, I suppose, as people sometimes can’t access the articles in Science that I cite. Anyway, accumulation of anthropogenic CO2 is supposed to lower ocean pH from 8.1 to 7.7 or maybe, in the extreme, 7.3. Is that correct? Study of the biological effects of this “acidification” is in its infancy, and would make a good thread of its own some day.
261, Hank Roberts: The lectures follow a textbook, “Global Warming, Understanding the Forecast,” written for the course. For information about the textbook, interactive models, and more, visit: http://forecast.uchicago.edu/ ”
Cool (!) Thanks for the link.
Wally, You have to understand that the current warming epoch happens to coincide with what is likely to be the peak human population on the planet. Even if it were to only decrease agricultural yields, water supplies or healthy living space marginally, the results could be catastrophic. All of the evidence to date suggests that the effects will be largely negative and more than marginal. My suggestion would be to look at climate change as one facet of THE PROBLEM for our generation and the next–achieving a sustainable and still vibrant economy. If we do this, we stand a chance of preserving civilization. If we fail, then the anthropocene will indeed be a very thin geologic stratum.
Re: SM (313)
Here’s an additional Caldeira piece on the subject:
Source available here.
The Yooper
Wally wrote: “Most of us in the skeptic camp do agree with AGW, we disagree with catastrophic AGW.”
That is one of the forms of denialism. The evidence that unmitigated AGW resulting from anything close to continued business-as-usual use of fossil fuels will have catastrophic consequences is overwhelming. It is particularly overwhelming since those catastrophic consequences are already occurring right before our eyes.
Wally wrote: “Second, we don’t deny no alternatives exist, we point out they are not currently practical and/or expensive.”
The claim that wind and solar are “not currently practical and/or expensive” is false. Solar and wind are the fastest growing sources of new electricity generation in the world, and both are growing at record-breaking double-digit rates every year.
According to WorldWatch Institute’s Renewables 2010 Global Status Report:
Wally wrote: “You’re creating strawmen.”
Far from demonstrating that I am “creating strawmen” you have given a perfect illustration of exactly what I was talking about.
You have denied that the problem exists — by denying the seriousness of the problem, ignoring the overwhelming evidence that it is indeed already profoundly serious and that it is rapidly becoming ever more serious.
You have denied that the solution exists — by disparaging alternative energy sources as “not currently practical and/or expensive”, ignoring the overwhelming evidence that the key alternatives (wind and solar) are already being widely, rapidly and profitably deployed all over the world.
Your comment is a textbook example of the two tactics of obstructionism that I described.
Another for SM – a dedicated acidification blog
Arrow 304,
I’ve been teaching myself to write radiative-convective models (single-column approximations of the atmosphere plus surface). I’ve written a tutorial on how to do that. Would you like a copy?
http://www.google.com/search?q=site%3Aipcc.ch+ocean+acidification
or if you don’t like that source try these:
http://www.google.com/search?q=ocean+acidification+global+conspiracy+world+government
Ray, congrats on the Phys. Ph.D., I’m about to finish my own in a field of genetics.
For your papers:
The PNAS piece “Grain yield declined by 10% for each 1°C increase in growing-season minimum temperature in the dry season, whereas the effect of maximum temperature on crop yield was insignificant. This report provides a direct evidence of decreased rice yields from increased nighttime temperature associated with global warming. ”
Correlation, not causation. This paper would have been far more interesting if they set up several plots of rice crops in a green houses, and exposed them to different temperatures. Experiments Ray, they should have tought you how useful they were while you were getting that Ph.D. Correlations are nice, and can hint at something being possible, but controlled experiments prove it. There is probably a reason this ended up in PNAS.
The other’s are not research pieces, but blogs or news reports. So, I’m still waiting…
Gavin,
“Forecasts are always ‘different’ from the actuality for all sorts of reasons – and the further out you go, the more different they will be. Yet forecasts still have skill if they get closer to the true outcome than any other method. For instance, a forecast of 0.2 deg C/decade will be statistically significantly different to a reality of 0.19 deg C/dec given a long enough period. However, this is clearly skillful given the alternative of no change. Please think about what you are trying to calculate.”
I won’t speak for Russ, but I think it should be pretty obvious what this means. The models that missed by 98 and 92 did not due particularly well predicting the climate. Like you said, there could be a lot of reasons for this. Well, now that we know they missed by a pretty large margin, we should try to explain why. If its simply because the CO2 levels were not accurately predicted, and we could update the model with that information and find a near match, GREAT! I’m all for an honest persuit of the truth here. But if you do that and you still find that the models are off by a far bit, well, you might want to start testing some new theories. Maybe the CO2 forcing isn’t as strong, or the feedbacks, or other factors. What ever. Its honestly unfortunate you can’t do this more quickly in climate science, I can do it about every week, with a controlled experiment no less, in my field. Not that I’m trying to one up anything, but you have to recignize the limitations. Even if these models do roughly work with these kinds of “hindcasting” tests, you then run into the issue that you can tune the model to do anything you want it too. Just fiddle with the set of parameters slightly, and viola! But will that help you going forward? Don’t know, need to wait again.
[Response: You are very confused. 0.19 is different from 0.20 with 100% significance. Does it mean that a forecast of 0.20 was not useful in anticipating 0.19? The size of the significance is irrelevant. Skill is what you need to assess. This is measured as the difference between the RMS error in the forecast compared to the RMS error in what you would have anticipated without the forecast (S= 1 – RMS(forecast)/RMS(naive) ). So given a naive forecast of ‘no change’ (which is what was being put forward by others at the time), the skill of the Hansen forecast is easy to calculate and very positive (Hargreaves, 2010). And if you think I can ‘get the model to do whatever I want it to by playing with a few parameters’, you are even more confused. – gavin]
Barton,
“Unless by doing so you free up W dollars that used to go to health care, lost productivity, funerals, and property damage from the pollution that is no longer being created. Then you might break even or even do better.”
That’s quite an IF there that you avoided.
BPL 304,
I would love any help you can give. If it’s only me that will be doing this I don’t think it will get very far. I’d probably try to get the tutorial on the site, although if you wanted it as a post I’m sure we can arrange something. I have a few other posts to get out of the way first in terms of some of the basics for how the model will be set up, but I could definitely see the radiative-convective models being high on the priority list.
If you want to help with the project, I would certainly welcome anyone who is willing. Email me if you think you’d be interested or just to send me the tutorial. Either way, I appreciate the help.
Wally, I’m surprised that even though you say you are about to get a degree in “genetics,” you seem utterly unaware of the difficulty of conducting controlled experiments in fields such as agriculture and agronomy. It would appear that you need to expand your reading a bit.
Also, you might want to attach wheels to the goalposts–it will make them easier for you to move rapidly. I note that you’ve gone from “debunked” to “requiring additional confirmation”. This is, of course, opposed to your position–which has zero evidence.
Evidence, Wally, it’s what’s for dinner when you’re a scientist. I hope you learn that someday.
After that, you might want to study statistics and hypothesis testing. Here’s a start–you cannot compare a point estimate of a model to an experimental result. Google confidence intervals.
Wally, in what field of genetics are you about to get a Ph.D., if you care to say? If you have been reading the journals, you should be more, not less, aware than most of the rate of change problems.
http://eco.confex.com/eco/2010/techprogram/P22682.HTM
I realize an almost-Ph.D. is very focused on one particular subject, but I suspect that if you ask around in your own department you’ll find a lot of information about climate change.
Is there anything more tiresome than willfully ignorant people who refuse to educate themselves, cavalierly dismiss the evidence presented to them, and cling obstinately to the sophistry and disinformation that they have embraced, and then post comments on blogs proclaiming that they are “still waiting” for others to devote their own time and energy to convince them of facts that are fully understood and accepted by the entire world’s scientific community, but which they are ideologically driven to reject no matter what?
289 Wally babbled: “”273 Wally sez: “Do you think we went straight from E=mc^2 to Hiroshima?”
John: “WHat does the one have to do with the other? You might want to learn some physics and history of physics.”
First, you’re talking to some one that holds a BS in physics among other things. Second, the idiocy of your comment is self evident, so I’ll let it speak for itself. Good laugh though John. Next time think before you cast an insult, you might just make yourself look like a fool again.
”
Nonsense isn’t any less nonsensical just because it is part of popular culture.
Gavin, that was of very little help. I assure you I am not confused, I’ve been using and testing models in contagious disease and genetic networks for years. I fully understand the concept of confidence intervals, and how through increased sampling or decreased variability confidence goes up. I also fully understand that creating a model that is better than anything else is certainly of value, even if it is of by no means perfect (this would be every genetic network model ever created by anyone). All these issues however, do not mean you can escape poor stat. tests of your model by just hand waving away the very large differences found. What you’re attempting to tell me is that the ~20 years of climate data we’re using to test the model is basically a perfect set of data that can distinguish between extremely small differences in trend. This is not the case. As you can tell by the results from the test posted by Russ originally. Just look at the confidence differences between the 3 slopes. Those are hardly staggering levels of confidence given a nearly 2x difference in yearly change from observed .0171, and scenario A .0298. And the one that was about 1.6x the observed slope fell within 95% CI, though not by much. You can’t have it both ways Gavin.
“And if you think I can ‘get the model to do whatever I want it to by playing with a few parameters’, you are even more confused.”
Maybe it is you that is confused. Take your random model using a fairly small set of differential equations, say 5 or 6 equations, and lets assume each equation has 3 parameters. Now try to fit it to a variety of curve shapes by changing those 15 or so parameters. You might be surprised what you can get. Now, I’ve never actually seen the code for Hansen’s model, but I’m guessing its a great deal bigger than that. Personally I’ve made models with a hundred equations and maybe 500 parameters. Those models can pretty much do what ever I want them to. The trick is getting them to match the experiment.
[Response: Why do you think that GCMs are like random low order differental equations? They are nothing like it. The vast majority of the code is tied very strongly to very well known physics (conservation of energy, radiative transfer, equations of motion etc.) which can’t be changed in any significant aspect at all. The number of variable parameters that can be used for the tuning exercises you seem to want to do are tiny (a handful or so), and even they can’t be changed radically because you’ll lose radiative balance, or reasonable climatology. I strongly suggest you actually look at some GCM code, and read a couple of papers on the subject – GCMs are far more ‘stiff’ than you imagine. – gavin]
Ray,
I’m not all saying experiments would be easy, but there are quite possible. Particularly for testing rice yields against temperature.
“Also, you might want to attach wheels to the goalposts–it will make them easier for you to move rapidly. I note that you’ve gone from “debunked” to “requiring additional confirmation”. This is, of course, opposed to your position–which has zero evidence.”
I did not move anything. I asked you to prove your case. You merely hinted at it being possible. It is unfortunate you fail to understand the difference. Providing some evidence for something is one thing, proving that something to be true is another. A lesson in science I suppose you missed?
Hank,
“I realize an almost-Ph.D. is very focused on one particular subject, but I suspect that if you ask around in your own department you’ll find a lot of information about climate change.”
Actually, I fairly regularly go to talks from faculty and students working on various bio solutions to our CO2 problems and a few work on those ag. issues we’re talking about as well. It is a fairly big part of our department.
Wally, I am becoming less and less likely to believe that you are a scientist. Yes, I presented evidence. Evidence is what science is about. It is not about proof.
Now the evidence I presented is more than sufficient to establish decreased agricultural yield, increased drought and severe weather, etc. as credible risks. The approproate next step would be to find an upper bound to risk posed by these threats. The problem here is that there is a non-negligible probability of warming over 5 degrees C, which would result in catastrophic consequences. This means that the only appropriate action is risk avoidance. All of this, Wally, is based on the available evidence, none of which you have even challenged in any serious manner.
You, on the other hand have presented nothing but your own incredulity based on your own ignorance.
“This paper would have been far more interesting if they set up several plots of rice crops in a green houses, and exposed them to different temperatures. Experiments Ray, they should have tought you how useful they were while you were getting that Ph.D. Correlations are nice, and can hint at something being possible, but controlled experiments prove it.” Wally — 11 September 2010 @ 9:27 PM
” I would prefer that this article refered to actual real experiments. … strong benefits from increased CO2 with much lower temperature dependence. …”
wattsupwiththat.com/…/rice-yields-co2-and-temperature-you-write-the-article/
http://books.irri.org/3540589066_content.pdf International Rice Research Institute. 1976. Climate and Rice. Los Ba–os, Philippines.
“Controlled-environment facilities cannot copy climates in which plants are to be selected or tested, nor are they meant or designed to do so. They cannot reproduce climates, since climate embraces an hour-by-hour, day-by-day, and year-by-year variation. Their function is to isolate particular and critical features of the environment, so that their effects can be examined and subsequently reproduced at will.”
“Early experiments in the Pasadena phytotron led Went to suggest that many plants are favored in their growth and development by night temperatures lower than the daytime optimum, ” Global warming is reducing this diurnal variation – see below.
“At high day and night temperatures (35 deg C day and 30 deg C night), sterility increases as a result of smaller pollens and non-dehiscence of the anthers (Sato et al., 1973).”
“Top growth of rice plants after transplanting is, in general, linearly accelerated by raising average temperature from approximately 18јC to 33јC (Ueki, 1966; Place et al., 1971; Sato, 1972a; Chamura and Honma, 1973; Osada, Takahashi, Dhammanuvong, Sasiprapa, and Guntharatom, 1973; Yoshida, 1973). Above and below this range, the growth notably decreases.”
“Sasaki (1927) reported that the elongation of rice leaves increased with rising temperature from 17 to 31 deg C; thence it tended to decrease and practically ceased at 45 deg C.”
“At [0] stage, temperature-ripening grade curves have two characteristics. One is higher optimum temperature of about 26јC, the other is the rapid decline of ripening grade at high temperatures above optimum.”
“It is also observed that the temperature curve of ripening grade at [ + 20] stage, as compared with that at [-20] stage, shows slow decline in the low temperature range, but rapid decline in the higher temperature range.”
“Temperature of water – Under laboratory conditions, Kondo and Okamura (1932) reported that elongation is greatest at 25 deg to 30 deg C. At 35 deg to 40 deg C, it is retarded and the plant dies if submergence is prolonged.”
Science already had shown by 1976 that temperatures above the optimum caused various adverse effects, and that the rate of onset versus temperature was faster than for temperature declines below optimum.
http://books.irri.org/3540589066_content.pdf ‘Climate Change and Rice’, S. Peng K.T. Ingram H.-U. Neue L.H. Ziska (Eds.)
“There is a large body of literature on the individual effects of CO2 and temperature on rice physiology. In summary, CO2 concentration is directly related to biomass production (Baker et al. 1988), crop development rate (Baker et al. 1988), leaf-level water-use efficiency (Allen et al. 1988), and grain yield (Yoshida 1976; Cure 1985). For tropical areas, increased temperature leads to faster crop development (Nishiyama 1976), higher respiration rates (Munakata 1976), spikelet sterility (Yoshida et al. 1981; Mackill et al. 1982), and reduced grain yield (Imai et al. 1983).”
“Though there are few data on the interactive effects of elevated CO2 and temperature, speculated interactions based on their individual physiological effects are mostly negative. For example, increased temperature hastens crop development, thereby shortening the time from planting until maturity and reducing the total time for photoassimilation and yield development. Elevated CO2 on the other hand increases the rate of CO2 uptake thereby offsetting, at least in part, the negative effect of increased temperature. Unfortunately, elevated CO2 also hastens crop development (Baker et al. 1988) and seems likely to exacerbate the negative effects of increased temperature on total duration of crop growth. Preliminary experimental data support this view and indicate that increased temperatures cause large reductions in rice yield, which are not compensated for by increases in CO2 (US DOE 1989). Extrapolation of these data to real-world field conditions suggest the possibility that tropical rice grain production of current cultivars could decline about 7 or 8% for each 1 deg C rise in temperature, seriously affecting world food supply, (US DOE 1989).” [prediction from models based on real data, field and controlled environment studies, in 1989.]
“Although these results suggest dramatic effects of climate change on rice production, they are based on only one experiment under highly controlled conditions for one rice cultivar . Additional cultivars must be studied under actual tropical conditions with variable temperatures to verify the above data and to verify whether they can be extrapolated to real-world rice production.”
http://www.pnas.org/content/101/27/9971.full
“Here we report that annual mean maximum and minimum temperatures have increased by 0.35°C and 1.13°C, respectively, for the period 1979–2003 and a close linkage between rice grain yield and mean minimum temperature during the dry cropping season (January to April). Grain yield declined by 10% for each 1°C increase in growing-season minimum temperature in the dry season,”
“Relationships between grain yield and temperature or radiation were evaluated by using yield data from field experiments conducted under irrigated conditions with optimal management at the IRRI Farm from 1992 to 2003.” – confirming the 1989 predictions, by studying rice yields, growing under actual real world tropical conditions with varying temperatures. Except that the observations were worse than the predictions.
Irrigation and fertilizer were maintained at constant levels, and “Mean radiation also increased during the same period …” so light wasn’t a factor.
“The increase in minimum temperature was 3.2 times greater than the increase in maximum temperature, which is consistent with the observation that minimum temperature has increased approximately three times as much as the corresponding maximum temperature from 1951 to 1990 over much of the Earth’s surface…” – see reference above to “early experiments” by Went at the Pasadena phytotron.
Repeating a body of experiments already performed by a host of plant physiologists over the last hundred years isn’t necessary, let alone interesting.
What do you think, according to Liebig’s law, caused the decline in rice production? Cosmic rays? It wasn’t the Lindzen Iris closing – radiation increased. Natural cyclic variations of unknown origin?
Not to mention the body of evidence from the real world experience of the folks growing Wallys food since he was in diapers, but like many young grad school hot shots he assumes any thought or objection he has is entirely original and incisive, so investigating what’s been done in the real world over the last hundred years isn’t necessary.
Enough with the citizen auditors misunderstandings please! this is not the “do-it-yourself climate science” that’s worth noting.
Wally:
> bio solutions to our CO2 problems
What _are_ your CO2 problems then? What do you think are problems?
” they can’t be changed radically because you’ll lose radiative balance, or reasonable climatology…GCMs are far more ‘stiff’ than you imagine. – gavin”
Sorry Gavin, but how is it compatible with the large uncertainty of the climate sensitivity? if they were that stiff, they should all give the same result ! you just seem to forget (I can’t imagine that you don’t know it !) that
1) average temperature is not univocally linked with enthalpy content
2) there is ample room for the temporary storage of energy in the oceans, to drive limiting cycle on century, and probably on millenary scale
3) GCM are not accurate enough to describe non linear feedbacks like cloud covering – hence their very poor predictive power on ENSO cycles for instance – which could also easily change the energy balance – just modifying the albedo by 1% is already a large change.
Ray “The problem here is that there is a non-negligible probability of warming over 5 degrees C, which would result in catastrophic consequences. ”
The problem here is that there is no sensible way of quantifying properly this “non-negligible probability”, just because, as I argued already, there is no theory of probabilities applied to an unknown theory.
Arrow,
I wasn’t thinking of posting the tutorial, but just of giving you a document with some of the basics in it so you could develop your own posts.
I’ll need your email address. Mine is readermail1960@gmail.com.
Wally: What you’re attempting to tell me is that the ~20 years of climate data we’re using to test the model is basically a perfect set of data that can distinguish between extremely small differences in trend. This is not the case.
BPL: If the differences in trend are “extremely small,” it means the model was close to the reality, doesn’t it?
Duh.
Wally
“So you’ve now combined the results from climate models with dubious validity with economic models? I see expanding error bars….”
Indeed. But not expanding in a direction that’s going to help /you/. Those ‘expanding error bars’ make it increasingly unlikely that something catastrophic will occur.
“Silk, its based on increased power costs, which are pretty straight forward to evaluate.”
I’m calling you out here. Some me some /evidence/ that cap and trade in the US would cause a 1% contraction in the US economy.
Indeed, you’re argument seems to be that growth would be down 1% EVERY year. So brack that up, too.
321, flxible, thank you.
320, Secular Animist: The claim that wind and solar are “not currently practical and/or expensive” is false. Solar and wind are the fastest growing sources of new electricity generation in the world, and both are growing at record-breaking double-digit rates every year.
Add to that: Somerville et al in the 13 August 2010 Science, page 790, report that the global production of biofuels equals the consumption by Germany of all liquid fuels.
All energy supplies receive government subsidies, and the subsidies for wind and solar are higher than the subsidies for some others. Subsidies have to be paid by reductions in GDP elsewhere, but with costs of renewables declining it is likely that they will soon have smaller subsidies than most other sources.
Gilles @339 — ENSO is far from cyclic, being best described as a quasi-periodic oscillation. Cloud cover is nothing to do with it.
Septic Matthew @344 — Fossil fuels receive much higher subsidies, at least in the USA, than do wind/solar. That is all actually OT here on RealClimate. Take to, for example,
http://climateprogress.org/
Gavin,
I’ll happily go through an exercise in getting one of these models to do damn near anything. Would like to suggest a paper we could start with?
[Response: You need to start with the code, not a paper. That comes afterwards. Try EdGCM, NCAR CSM or GISS ModelE. – gavin]
Brian, that’s a nice list of quotes. But I never claimed this was easy. Nor do the experimental conditions have to perfectly reproduce the climate. I can take an embryo out of it egg/mother and explant it into growth media. That media is good enough to allow the embryo to grow for at least several hours, during which I can preform a CONTROLLED experiment. The conditions do not have to be perfect, you just need to be able to get them to work reasonably well, so that you can create a controlled environment for your experiment. If it take $1B to do such an experiment in rice crops, that’s not really my problem. And it certainly doesn’t allow for us to placed increased confidence in simple observation based correlations.
Gilles,
Gavin: “they can’t be changed radically because you’ll lose radiative balance, or reasonable climatology…GCMs are far more ’stiff’ than you imagine.”
Gilles: “Sorry Gavin, but how is it compatible with the large uncertainty of the climate sensitivity? if they were that stiff, they should all give the same result ! you just seem to forget (I can’t imagine that you don’t know it !) that”
Exactly, if you can push one of these handful of parameters that you can not arrive at experimentally such that you attain some sort of “unreasonable” climate. It should become pretty obvious that those parameters that are unknown can have drastic effects on the model outputs.
Its a little comical that Gavin can in one breath tell us that the models are based on well known physics that give it a great deal of certainty. Then in the next tell us that changing a few of the unknown parameters gives us an “unreasonable” climate. All while being condescending and ridiculing those he presumably would like to convince.
Here’s a hint Gavin, create an argument that makes sense and do attempt to tell me I’m “confused” or something similar. If I’m missing something, explain it rationally, logically and respectively, otherwise you are not going to get your point across and only further entrench me in my position, even if it is, in part, based on ignorance. Remember ignorance is no crime, being willfully ignorant however can be. But since we’re hear talking, you should assume there is at least some chance a respectful and logical argument could swing my opinion on one matter or another. But if you and the others around here wish to assume that is not true, well that’s what you’ll get. A bit of self fulling prophecy that would be.
[Response: Ignorance is indeed curable. The cure starts with a dose of background reading on model development (Schmidt et al , 2006 is a reasonable example of the genre). There are also FAQs on climate models that might be helpful. Both should help you formulate what it is that actually want to know. – gavin]
345, David B. Benson: That is all actually OT here on RealClimate. Take to, for example,
It’s just a slight detail added to Secular Animist’s assertion about the viability of alternatives. Here’s another report on biofuels, not exactly new:
That is all actually OT here on RealClimate. Take to, for example,
It seems (whine, whine, whine — oh woe is me) that some topics don’t become off-topic until I comment on them, even when I write in support of Alternative Energy.
BPL @ 340 – I’m trying to find people who will want to contribute to this project, which is why I was suggesting posting it or anything else you think you can contribute. While I plan on being active on this project, I know that it won’t work without other people getting involved. My email is bloggingarrow@gmail.com. I’ll email you soon in order to get the tutorial. I’ll probably ask if you want to contribute as well, but I’ll understand if you have other demands on you’re time. If anyone else would like help however, check out the project site or send me an email.
PS I’ve been looking at the GISS ModelE code and I have some questions (minor technical clarifications, like what does this variable mean, what is the purpose of such and such subroutine). Can one of the RC moderator’s let me know who I should email my questions to? Should it be to Gavin or is there someone more appropriate (I don’t want to bore him with all my mundane questions). Thanks for any help.
[Response: email me. – gavin]