A new paper in Nature Climate Change out this week by England and others joins a number of other recent papers seeking to understand the climate dynamics that have led to the so-called “slowdown” in global warming. As we and others have pointed out previously (e.g. here), the fact that global average temperatures can deviate for a decade or longer from the long term trend comes as no surprise. Moreover, it’s not even clear that the deviation has been as large as is commonly assumed (as discussed e.g. in the Cowtan and Way study earlier this year), and has little statistical significance in any case. Nevertheless, it’s still interesting, and there is much to be learned about the climate system from studying the details.
Several studies have shown that much of the excess heating of the planet due to the radiative imbalance from ever-increasing greenhouses gases has gone into the ocean, rather than the atmosphere (see e.g. Foster and Rahmstorf and Balmaseda et al.). In their new paper, England et al. show that this increased ocean heat uptake — which has occurred mostly in the tropical Pacific — is associated with an anomalous strengthening of the trade winds. Stronger trade winds push warm surface water towards the west, and bring cold deeper waters to the surface to replace them. This raises the thermocline (boundary between warm surface water and cold deep water), and increases the amount of heat stored in the upper few hundred meters of the ocean. Indeed, this is what happens every time there is a major La Niña event, which is why it is globally cooler during La Niña years. One could think of the last ~15 years or so as a long term “La-Niña-like” anomaly (punctuated, of course, by actual El Niño (like the exceptionally warm years 1998, 2005) and La Niña events (like the relatively cool 2011).
A very consistent understanding is thus emerging of the coupled ocean and atmosphere dynamics that have caused the recent decadal-scale departure from the longer-term global warming trend. That understanding suggests that the “slowdown” in warming is unlikely to continue, as England explains in his guest post, below. –Eric Steig
Guest commentary by Matthew England (UNSW)
For a long time now climatologists have been tracking the global average air temperature as a measure of planetary climate variability and trends, even though this metric reflects just a tiny fraction of Earth’s net energy or heat content. But it’s used widely because it’s the metric that enjoys the densest array of in situ observations. The problem of course is that this quantity has so many bumps and kinks, pauses and accelerations that predicting its year-to-year path is a big challenge. Over the last century, no single forcing agent is clearer than anthropogenic greenhouse gases, yet zooming into years or decades, modes of variability become the signal, not the noise. Yet despite these basics of climate physics, any slowdown in the overall temperature trend sees lobby groups falsely claim that global warming is over. Never mind that the globe – our planet – spans the oceans, atmosphere, land and ice systems in their entirety.
This was one of the motivations for our study out this week in Nature Climate Change (England et al., 2014) With the global-average surface air temperature (SAT) more-or-less steady since 2001, scientists have been seeking to explain the climate mechanics of the slowdown in warming seen in the observations during 2001-2013. One simple way to address this is to examine what is different about the recent decade compared to the preceding decade when the global-mean SAT metric accelerated. This can be quantified via decade-mean differences, or via multi-decadal trends, which are roughly equivalent if the trends are more-or-less linear, or if the focus is on the low frequency changes.
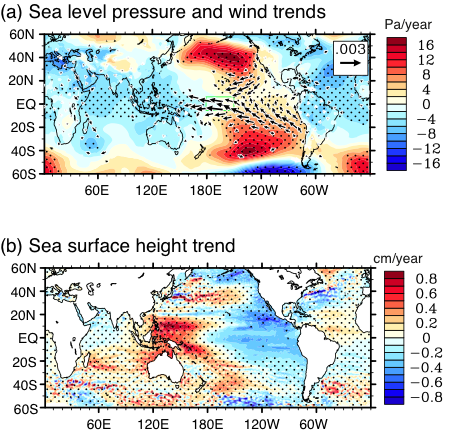
A first look at multi-decadal trends over the past two decades (see below) shows a dramatic signature in the Pacific Ocean; with sea surface cooling over the east and central Pacific and warming in the west, extending into the subtropics. Sea-level records also reveal a massive trend across the Pacific: with the east declining and the west rising well above the global average. Basic physical oceanography immediately suggests a trade wind trend as the cause: as this helps pile warm water up in the west at the expense of the east. And sure enough, that is exactly what had occurred with the Pacific wind field.
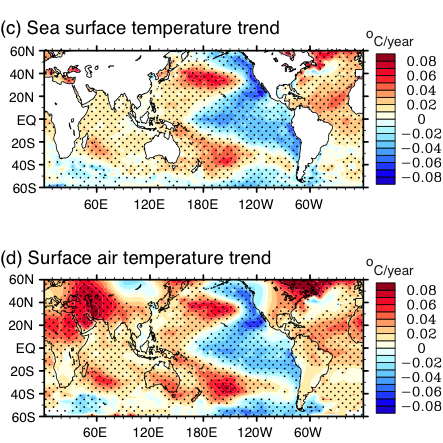
A consistent picture has now emerged to explain the slowdown in global average SAT since 2001 compared to the rapid warming of the 1980s and 1990s: this includes the link between hiatus decades and the Interdecadal Pacific Oscillation, the enhanced ocean heat uptake in the Pacific (see previous posts) and the role of East Pacific cooling. All of these factors are consistent with a picture of strengthened trade winds, enhanced heat uptake in the western Pacific thermocline, and cooling in the east – as you can see in this schematic:
As our study set out to reconcile the emerging divide between observations and the multi-model mean across CMIP5 and CMIP3 simulations, we took a slightly different approach, although there are obvious parallels to Kosaka and Xie’s study assessing the impact of a cooler East Pacific. In particular, we incorporated the recent 20-year trend in trade winds into both an ocean and a climate model, to quantify its impact. It turns out that with this single perturbation, much of the ‘hiatus’ can be simulated. The slowdown in warming occurs as a combined result of both increased heat uptake in the Western Pacific Ocean, and increased cooling of the east and central Pacific (the latter leads to atmospheric teleconnections of reduced warming in other locations). We find that the heat content change within the ocean accounts for about half of the slowdown, the remaining half comes from the atmospheric teleconnections from the east Pacific.
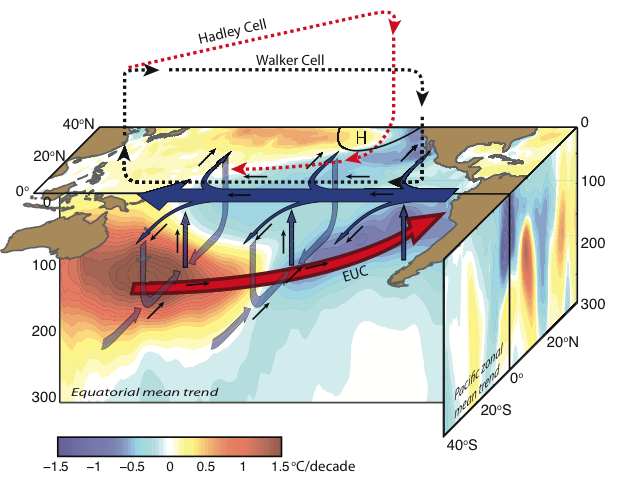
Unfortunately, however, the hiatus looks likely to be temporary, with projections suggesting that when the trade winds return to normal strength, warming is set to be rapid (see below). This is because the recent accelerated heat uptake in the Pacific Ocean is by no means permanent; this is consistent with the shallow depths at which the excess heat can now be found, at the 100-300m layer just below the surface mixed layer that interacts with the atmosphere. [Ed: though see also Mike’s commentary on this aspect of the paper]
Even if the excess heat fluxed into the ocean were longer-term, burying the heat deep in the ocean would not come without its consequences; ocean thermal expansion translates this directly into sea-level rise, with Western Pacific Island nations already acutely aware of this from the recent trends.
Our study addresses some important topics but also raises several new questions. For example, we find that climate models do not appear to capture the observed scale of multi-decadal variability in the Pacific – for example, none reproduce the magnitude of the observed Pacific trade wind acceleration – the best the models can do is around half this magnitude. This begs the question as to why this is the case: given the positive ocean-atmosphere feedbacks operating to drive these strengthened trade winds, the answer could lie in the ocean, the atmosphere, or both.
The study also discusses the unprecedented nature of the wind trends, and suggests that only around half of the trend can be explained by the IPO. So where does the other half come from? The Indian Ocean is as one possibility, given its recent rapid warming; but models capture this in greenhouse gas forced projections. What else might be accelerating the winds in the Pacific beyond what you’d expect to see from the underlying SST fields alone?
The study also points to the length of the wind trend as being crucial to the hiatus; arguing that anything much shorter, like a decadal wind trend, would not have resulted in nearly as much heat uptake by the ocean. This is related to the time-scale for ocean adjustment to wind forcing in the subtropics: in short it takes time to spin-up the ocean circulation response, and then more time to see this circulation inject a significant amount of heat into the ocean thermocline. Given the ocean inertia to change, what happens when the trade winds next weaken back to average values? Does the subducted heat get mixed away before this can resurface, or does the heat find a way to return to the surface when the winds reverse? Our initial work suggests the latter: as when we forced the wind anomalies to abate, warming out of the hiatus can be rapid, eventually recovering the warming that paused during the hiatus. So this suggests that whenever the current wind trends reverse, warming will resume as projected, and in time the present “pause” will be long forgotten by the climate system. [Ed: see again Mike’s piece for a discussion of an alternative hypothesis–namely, the possibility that a La Niña-like state is part of the response to anthropogenic forcing itself].
Of course, other factors could have also contributed to part of the recent slowdown in the globally averaged air temperature metric: increased aerosols, a solar minimum, and problems with missing data in the Arctic. Summing up all of the documented contributions to the hiatus, spanning ocean heat uptake, reduced radiation reaching Earth’s surface, and data gaps, climate scientists have probably accounted for the hiatus twice over. Of course each effect is not linearly additive, but even so, many experts are now asking why hasn’t the past decade been one of considerable cooling in global mean air-temperatures? Or put another way, why isn’t the model-observed gap even wider? One way to explain this is that the current generation of climate models may be too low in their climate sensitivity – an argument made recently by Sherwood et al in relation to unresolved cloud physics. A perhaps completely unexpected conclusion when analysts first noticed the model-observed divergence progressing over the past decade.
References
- G. Foster, and S. Rahmstorf, "Global temperature evolution 1979–2010", Environmental Research Letters, vol. 6, pp. 044022, 2011. http://dx.doi.org/10.1088/1748-9326/6/4/044022
- M.A. Balmaseda, K.E. Trenberth, and E. Källén, "Distinctive climate signals in reanalysis of global ocean heat content", Geophysical Research Letters, vol. 40, pp. 1754-1759, 2013. http://dx.doi.org/10.1002/grl.50382
- M.H. England, S. McGregor, P. Spence, G.A. Meehl, A. Timmermann, W. Cai, A.S. Gupta, M.J. McPhaden, A. Purich, and A. Santoso, "Recent intensification of wind-driven circulation in the Pacific and the ongoing warming hiatus", Nature Climate Change, vol. 4, pp. 222-227, 2014. http://dx.doi.org/10.1038/nclimate2106
- Y. Kosaka, and S. Xie, "Recent global-warming hiatus tied to equatorial Pacific surface cooling", Nature, vol. 501, pp. 403-407, 2013. http://dx.doi.org/10.1038/nature12534
Incidentally, the over cooler tropical Pacific nicely explains (quantitatively — I’m not just speculating) why the rapid warming in Antarctica culminated with the 1990s and appears to have leveled off in the 2000s. Changes occurring in the tropics have truly global effects. See e.g. our paper in Nature Geoscience, 2013.
Typo: “When the global-average surface air temperature (SAT) [became] more-or-less steady [after] 2001,
[Response: Thanks, fixed… -eric]
Thanks for the interesting post by Eric and Dr. England. Isaac Held had a post on his blog (http://www.gfdl.noaa.gov/blog/isaac-held/2013/09/23/41-the-hiatus-and-drought-in-the-u-s/) and the discussions there were also very interesting and possible relevant to this post.
I generally agree with the point of view on the role of equatorial Pacific in so-called slowdown of global warming, but I have a question to Eric and Matthew: Is it possible that AMO may also contribute to the slowdown (at longer time scales) so that the slowdown may last longer than 15 years, for example, similar to the hiatus from 1940-1970s?
I’d analyzed the results from an equilibrium run in CCSM3 and it seems to me the AMO might contribute, but not in a running 11-yr-trend of global SAT.
[Response: It’s certainly possible for the AMO to influence the global mean SAT trajectory. One of Jerry Meehl’s recent hiatus papers demonstrates this in the NCAR model: it’s secondary to the IPO/PDO in their study, but significant nonetheless. The key thing for me – in terms of identifying the ocean’s role in the current SAT slowdown – is to identify regions where the heat uptake has accelerated. The oceans have sucked up around 93% of excess ‘anthropogenic’ heat in the past 50-100 years: and they’ve sucked up heat from the atmosphere in a big way over the past decade. But the question is, where has this accelerated since 2000 compared to the preceding decades? That led us to the western Pacific. – Matthew]
Thank you for writing such a nice paper. The most remarkable thing is, to me, the wind. Figs. 1b, 5b and S9 just say it all.
“No historical or preindustrial simulation ever captures 20-year Pacific wind trends at the magnitude of the recent observed 1992-2011 trade wind acceleration.”
Quite amazing.
sidd
In 2009 Kyle Swanson told RC readers that his work with AA Tsonis indicated anthropogenic warming of the surface air temperature essentially stopped after the 1998 El Nino, roughly, and would not resume until 2020.
Much of their work is all about Pacific Ocean dynamics. The warming and cooling phases of the PDO are often characterized as being El Nino dominant (low westerly winds) and La Nina dominant (high westerly winds).
Why no credit?
[Response: Many authors have made the point about the Pacific playing a significant role. In his post on RealClimate, Swanson did not make a prediction warming “would not resume until 2020”. He was making an illustrative point, explaining why we should perhaps not be surprised if we had to wait until about 2020 for the long term trend to be the same as the last 20-years trend. –eric]
What happens if the wind doesn’t abate? Shouldn’t there be an El Nino too at one point – when enough heat is accumulated? This could even mean a linear persistent El Nino mechanism cycle? Also what are the impacts to deep sea lifeforms and how deep does the heat penetrate – only 300 meters? It would be really interesting to see an assessment of cloud formation and convective mixing in regards to England et al and Sherwood et al.
[Response: Some heat gets fluxed into the Indian Ocean via the Indonesian Throughflow. We didn’t study ecosystem impacts: but the ~4 degs C warming in the Western Pacific thermocline since the early 1990s would likely be having an impact.- Matthew]
Hello Matthew, my dear fellow New South Welshman.
It’s a timely paper, well done to all.
Matthew, a humble editing suggestion you may like to consider is this:
“… the climate mechanics of the slowdown in the rate of increase in average global mean surface temperature (GMST) seen in the observations during 2001-2013.”
You said this: “… the climate mechanics of the slowdown in warming seen in the observations during 2001-2013….”
I believe the former is more scientifically accurate and clear. Plus far less likely to be misinterpreted and/or intentionally misused by others out of context to your actual meaning.
Co-incidentally Matthew, you said this in your introduction: “Over the last century, no single forcing agent is clearer than anthropogenic greenhouse gases,…”
Which is intimately related to a recent comment of mine on RC:
AR5-TS TFE.8: Climate Targets and Stabilization
The concept of stabilization is strongly linked to the ultimate objective of the UNFCCC, which is:
“to achieve […] stabilization of greenhouse gas concentrations in the
atmosphere at a level that would prevent dangerous anthropogenic
interference with the climate system.”
Recent policy discussions focused on limits to a global temperature increase, rather than to greenhouse gas concentrations, as climate targets in the context of the UNFCCC objectives. [end ar5 quote]
“NOTE – This shift in POLICY EMPHASIS from a GOAL based on GHG PPM CONCENTRATIONS to one of AVERAGE SURFACE TEMPERATURE (GMST) ‘appears’ to have been imposed onto the IPCC process by the most powerful National Governments in the UNFCCC.
“This change is NOT something instigated by the Climate Scientists and IPCC Authors themselves during the writing of the AR5 IPCC reports, nor does this appear based upon the scientific work in any of the published climate science Papers since the AR4 in 2007.” […]
“NOTE: The last 5+ year emphasis by denier activists and recalcitrant anti-Science National Governments & Legislators has been on the idea of a HIATUS-PAUSE in TEMPERATURE INCREASES.
“Their OBJECTIVE (I believe) goes like this: There has been Nil to Minimal short-term Average Temperature Increase = UNFCCC Goals Are Being Met = NOT A PROBLEM = No Action Required = Nothing to see here.”
From here: https://www.realclimate.org/index.php/archives/2014/01/if-you-see-something-say-something/comment-page-12/#comment-458903
Keep up the good work. Have a cold beer for me at The Rocks next time you’re there.
Walter
Video: Stronger Winds Shift Heat to Deeper Pacific
Doesn’t this also suggest that the temperature gradient in the Northern Hemisphere is further increased, hence contributes to the science around jet stream anomalies (Francis et al., Screen, Overland and more).
Eric Steig @ 1 – The NCAR CCSM4 climate model used in Meehl et al (2013) exhibits a marked warming (cooling) in Antarctica with the positive (negative) phase of the IPO. See figure 1.
Excellent post Matthew, and congratulations or your media work on this study, which has been impressive for its clarity of explanation.
Err, not unless you’re prepared to posit some complex, saw-toothed, far-from-parsimonious fitted function … one with at least five parameters*. Perhaps a trunk-waving elephant?
In fact the interval 2001-2013 has been unusually close to the half-century long simple linear trend. The residual are largely within +/-1σ, and are mostly above the trend line (these are 2000-2013): http://gergs.net/wp-content/uploads/2014/02/21st-century-residuals.png
(*You need at least two different and offset linear trends, plus the time of the step change between them.)
Thanks to Matthew and Eric.
Eric, could you clarify something in your introduction: ‘increases the amount of heat stored in the upper few hundred meters of the ocean’
My understanding is that heat storage in the upper few hundred meters hasn’t increased much at all over the past decade. The observed change has been an increased proportion of heat accumulation occurring below 700m.
[Response: I was purposely vague here, I admit, because I haven’t studied the issue carefully — my original text said “upper 1000”. You are right that the big news about this has been mostly about the heat gain below 700 m, but that still amounts to only about 30% — see the Balmaseda et al. paper. –eric]
Would increased amounts of heat being taken into the oceans also indicate increased amounts of CO₂ being absorbed? Ie, if there’s more cold, old water accessible to take up heat would that also take up more CO₂?
[Response: Yes indeed. CO2 goes up and down with El Niño and La Niña events as well. CO2 is increasing so fast that it doesn’t make a big difference though. The numbers are of order 10 GT/year fossil fuel emissions, vs. ! GT fluxes (which vary by around 50%) between El Niño and La Niña years. A randomly selected and perhaps not-very up to date write-up on this, by NOAA experts, is here http://www.pmel.noaa.gov/pubs/outstand/feel1868/text.shtml and has a bunch of good references if you want to follow up further –eric]
> 9 prokaryotes says: 18 Feb 2014 at 12:41 AM> Doesn’t this
> also suggest that the temperature gradient
> in the Northern Hemisphere is further increased, hence
> contributes to the science around jet stream anomalies
> (Francis et al., Screen, Overland and more).
No, you have that backward.
The temperature gradient decreases — becomes less steep — as
the Arctic area warms faster than the overall N. hemisphere.
Ars has an interview with Dr. Francis about this:
http://arstechnica.com/science/2014/02/santas-revenge-arctic-ice-may-be-putting-us-in-a-long-deep-freeze/
Thanks for covering this important topic. It is looking more and more likely that we are heading for an El Nino in the coming months/couple years (though it is still too early to be certain). Latest NOAA forecast is out, and it says…
[quote]models predict either ENSO-neutral or El Niño (greater or equal to
+0.5ºC) during the Northern Hemisphere summer 2014[/quote] (p. 26)
[quote]…El Niño starting in May-July 2014[/quote](p. 27)
http://www.cpc.ncep.noaa.gov/products/analysis_monitoring/lanina/enso_evolution-status-fcsts-web.pdf
Am I right in assuming that, even if this occurs, it will be too late to shed much moisture on CA and the rest of the parched West this year? What might the consequences be globally, especially if this turns into another major El Nino?
Paul S – Lyman and Johnson 2013 has these numbers for 0 to 300 meters:
1967 to 2011 – .18C
1983 to 2011 – .24C
2004 to 2011 – .18C
After 2011 I would presume fairly high numbers as the winds have been a bit calmer in that period.
Sorry, those are Wm2.
Another thing that we should keep in mind is that there has been the opposite of a deceleration in temperature trends if you just look at global temperatures on land, particularly if you look at the recent BEST data: http://www.woodfortrees.org/notes
(and what am I to make of reCaptcha’s “xport sho the”?)
[Response: Which of course makes the point once again that short-term trends don’t tell you very much (notwithstanding England et al’s very interesting and important analysis).–eric]
If the trade wind acceleration has led to an increased differential in the western Pacific sea height over that of the eastern Pacific, and an increased differential favoring ocean heat accumulation over surface and atmospheric warming, one would expect each of these phenomena to act as a brake on their further growth. What might be the result – would it imply mainly a return to more normal rates of surface warming, or would it be expressed as a temporary supernormal surface warming? I suspect a little of both, but I would be interested in further empirical or model evidence, including a consideration of the timescales that are likely to be involved.
Typo, missing links in article – it says: “(see e.g. and ).”
[Response: fixed. gavin]
wili: ENSO wrap up ref resource http://www.bom.gov.au/climate/enso/index.shtml
# 12 Paul S says:
“My understanding is that heat storage in the upper few hundred meters hasn’t increased much at all over the past decade”.
I thought the opposite was happening:
http://www.climate4you.com/images/NODC%20GlobalOceanicHeatContent0-700mSince1979%20With37monthRunningAverage.gif
Thanks very much for this post. It is just the topic I wanted to see.
Regarding surface air temps vs ENSO, John n-g already graphed El Niño, neutral and La Niña years and the three trend lines are very close to parallel. If these trends continue, then as soon as La Niña catches up with the big El Niño of ’98 surface air temperature will go up with the slope of those lines even without another El Niño.
[Response: Yes, that was a great post by John N-G. Two great lines at the end summarize the point:
–eric]
For a look at global circulation, hop on over to Steve’s place.
It would be interesting to see if the shipping records of the China Trade ( a surprisingly well archived subject ) hold any useful infromation about decadal variations in the trans-pacific trade winds , which might lead to reconstruction of patterns attributable to El Nino and ENSO.
A journal called The American Neptune specializes in the history of 19th century navigation .
Re Hank #14, sorry if i wasn’t very clear – and i think Francis is only referring to the horizontal “thickness” or temperature gradient, not the vertical distribution (which i meant) and ripple effects from jet anomalies.
From the recent Met Office release The Recent Storms and Floods in the UK which makes a great read, however they do not address sea ice loss, what i don’t understand, since there is a lot science already – even if still heavily studied.
I meant to write “Francis is only referring to the vertical “thickness” or temperature gradient, not necessarily the horizontal distribution” -which comes from changes in the jet. That’s at least my take away when she says the evaporation is weakening the 500mb layer.
From the article,
I’ve heard this a few times and am unsure what the putative mechanisms are for this heat transfer. Is it really that heat is transferring out of the ocean into the surface air, or that transfer of heat into the ocean slows down, which leaves more heat at the surface? Or something else?
[Response: It will be a combination of both. The longer the wind trends persist the more chance we have of the increased heat uptake being mixed to deeper depths. If the winds abate sooner, more heat can return to the surface faster, as less heat has been buried deep by mixing. – Matthew]
I would have thought that ocean expansion would have confirmed the conjecture of heat take-up in the oceans. But that measurement isn’t mentioned.
[Response: We show this via sea surface height trends in Fig. 2. – Matthew]
A vigorous spectrum of interdecadal internal variability presents numerous challenges to our current understanding of the climate. First, it suggests that climate models in general still have difficulty reproducing the magnitude and spatiotemporal patterns of internal variability necessary to capture the observed character of the 20th century climate trajectory. Presumably, this is due primarily to deficiencies in ocean dynamics. Moving toward higher resolution, eddy resolving oceanic models should help reduce this deficiency. Second, theoretical arguments suggest that a more variable climate is a more sensitive climate to imposed forcings (13). Viewed in this light, the lack of modeled compared to observed interdecadal variability (Fig. 2B) may indicate that current models underestimate climate sensitivity. Finally, the presence of vigorous climate variability presents significant challenges to near-term climate prediction (25, 26), leaving open the possibility of steady or even declining global mean surface temperatures over the next several decades that could present a significant empirical obstacle to the implementation of policies directed at reducing greenhouse gas emissions (27). However, global warming could likewise suddenly and without any ostensive cause accelerate due to internal variability. To paraphrase C. S. Lewis, the climate system appears wild, and may continue to hold many surprises if pressed.
Acknowledgments
We thank Isaac Held and Lord Robert May for helpful comments on earlier versions of the manuscript.
(Emphasis mine)
Long-term natural variability and 20th century climate change
Swanson called it a pause in warming, and he was saying it could last until 2020.
Tsonis is now saying the SAT pause will last until 2030. He’s betting on lots of repeats of the 2011 La Nina.
Numerobis, I -think- (amateur comment) your question is what’s mentioned here: http://www.gfdl.noaa.gov/blog/isaac-held/2013/09/23/41-the-hiatus-and-drought-in-the-u-s/#comment-3548
The warm layer may float on top, stay separate from the cold deeper water, so the thermocline is deformed by the wind (warm water pushed to one side of the ocean, then pushed back to the other side — the thermocline is deeper where the warm water is temporarily piled up).
Or, some of the warm water mixes into the deep water.
I’m trying to paraphrase, don’t trust me (grin). Awaiting correction.
JCH:
“Swanson called it a pause in warming, and he was saying it could last until 2020.”
You first said he said it WOULD last until 2020 …
JCH:
“In 2009 Kyle Swanson told RC readers that his work with AA Tsonis indicated anthropogenic warming of the surface air temperature essentially stopped after the 1998 El Nino, roughly, and WOULD NOT RESUME UNTIL 2020”
Big difference. HUGE difference, actually.
And your quote also says it could turn out to be the opposite:
“However, global warming could likewise suddenly and without any ostensive cause accelerate due to internal variability.”
This makes it even more clear that he was not predicting we’d see a pause until 2020. He’s saying, in essence, you can flip a coin, because currently it is impossible to predict with any precision in advance when natural variability will cause temps to uptick or downtick.
In other words, Eric’s inline response to you:
“Swanson did not make a prediction warming “would not resume until 2020″. He was making an illustrative point, explaining why we should perhaps not be surprised if we had to wait until about 2020 for the long term trend to be the same as the last 20-years trend”
Fairly summarizes the point Swanson was making.
It is unclear to me why you’re continuing to flog this dead horse.
It seems to me there’s an easy way to destroy the basis of the argument about a “slowdown” in the climate system:
1. Some people say that global warming is not taking place because there has been a slowdown for the last few years in the increase of surface temperatures.
2. The same people do not deny that, in the geological past, there have been periods of natural warming; on the contrary, they use that fact in order to say that climate fluctuations are something natural.
3. As a result, they do not deny that there has been a warming curve of surface temperatures, about 10 000 years ago, that led to today’s warm period.
4. If data show that that warming curve was not neatly regular, but that there were “slowdowns” in it, then their argument explodes, because these slowdowns didn’t change anything to the end-result, ie. today’s warm period and its increase of 5° C in mean temperature.
Can anybody tell if the above makes sense, and whether it’s already been developped, and if so, which data about the last deglaciation could be used?
PS: I am putting aside the reevaluation of surface temperatures, the energy that has gone into heating oceans, etc., in order to concentrate on the hollowness of the argument itself.
JCH is quoting from the 2009 paper. Note that “pause in warming” there doesn’t mean a pause in warming the planet; it means a pause in the perceived surface temperature where we live.
Think of the playground game “crack the whip” — pauses, and surprises.
It’s been cited by more recent papers that go into more detail:
http://scholar.google.com/scholar?cites=10825134140285984546
Four pages of results, if you follow that link. Worth a look.
“Even if the excess heat fluxed into the ocean were longer-term, burying the heat deep in the ocean would not come without its consequences; ocean thermal expansion translates this directly into sea-level rise.”
The coefficient of expansion of ocean water at a depth of 1000 meters is half that of the tropical surface.
It seems to me the practical implication of this study is that we should be producing all of the energy we can from an ocean thermal energy conversion system that moves heat to this depth.
JCH,
Thank you for that manuscript. The role of the oceans tends to be under-appreciated in climate models. Much of the “pause” and previous warming could be just internal variablility associated with ocean dynamics.
I have a question about the sea level rise (the lower left figure in the group of four, fist image): Is this sea level change “on top of the global average” or is it the absolute values including all factors? The reason I ask is I live in HI and I’ve seen some substantial changes in some of our beaches in the last 30 years with the biggest effects of erosion occurring during a period about 10 to 15 years ago with some leveling off somewhat over the last 5 to 10. The figure seems to indicate (current?) stability in sea level for HI (light blue to white). If this buildup to in water in the Western Pacific were to change and reverse direction, I should expect to see a change (return? increase?) in the same erosion patterns — if that erosion is caused by sea level rise (which is the only explanation anyone here can give). Your comments would be welcome.
Thank you Dr England for a fascinating post and paper.
Can you explain how you constructed Fig 5 (the model observation comparison). It seems to show a similar discrepancy between IPCC projections and observations as the (apparently flawed) draft AR 5 Fig. 1.4, in contrast to the final version of AR 5 fig 1.4, which suggests recent temperatures are in line with projections – https://www.skepticalscience.com/curry-mcintyre-resist-ipcc-model-accuracy.html
I will admit to a certain prejudice- but I do think the ocean will eventually get it’s way. In support, my colleagues try to persuade me that, over the past couple billion years, the oxygen level in the air has been determined dominantly by the life in the oceans. My best guess is that it might be a mistake to ignore 70% of the planet’s surface.
> 28, 31 hint Thermohaline circulation
Water driven across the Pacific reaches the Maritime Continent. It is warm. The ‘continent” slows it down. The rain from water that evaporates from the warm Pacific blows on ahead. The warm water left behind becomes dense with salt. The dense water sinks and may become entrained in cold north-south currents. The PIG melts from below.
Sorry, perhaps the wrong time and place to ask but, do any findings of atmospheric water vapor from NVAP-M shed any light (or any doubt?) on the “slowdown”? Or, in general, anything concerning feedbacks, warming and model projections?
For instance, Weather and limate analyses using improved global water vapor observations, Vonder Haar, Bytheway and Forsythe – http://onlinelibrary.wiley.com/doi/10.1029/2012GL052094/pdf ?
Hank, without your input i wouldn’t had read the Met Office study. And you were correct, judging per Francis.
ps. i created a small graphic to visualise the driver of current northern hemispheric weather. 1 (full post), based on recent studies.
Maybe the trade winds are stronger because of the increased Arctic sea ice cover, variability.
Hank – it’s not a game. The definition of global warming is the surface air temperature. If it goes up, we have global warming; if it stays flat, we have a pause in global warming; if it goes down, we have global cooling.
[Response: I am well aware that temperature is a different quantity than heat, and have no objection to people tracking the accumulation of heat, but ‘global warming’ is simply not defined in this way. This is not a ‘fundamental disagreement’, this is simply you redefining the term ‘global warming’. For me (and almost anyone else you care to ask) global warming refers to the increase in global surface temperature anomaly. Indeed, ‘warmth’ is not a pure function of Joules – ice and water at 0 deg C have the same ‘warmth’, but very different heat contents. The very natural definition of warming is in terms of temperature; when people say that something has warmed, it means that the temperature has risen. You would be much more effective at communicating your scientific points if you used words in ways other people were already used to. – gavin] …
Emphasis mine.
You make judgements with no knowledge of what say. I commonly tell skeptics at Climate Etc. that people can draw fairly long flat lines, even descending lines, in the SAT data. It’s obvious that can be done. Then I tell them they would really have something if the oceans were also cooling, which they aren’t.
Dan H. – wrt to post-1970s warming, I do not agree with you, and I do not think the authors agree with you:
Finally, a fraction of the post-1970s warming also appears to be attributable to natural variability. – Tsonis and Swanson
To me “a fraction” denotes a small amount. If you look at their graph, fig 4, their analysis finds natural variability played a small part in the post-1970s warming. Others may disagree with my interpretation of the graph.
#44 JHC
Gavin: Sorry, i can´t fully understand your response …
Natural definition of warming, OK. But I think it´s not sufficient to say:
“…have no objection to people tracking the accumulation of heat …”.
If, f.e., a lot of energy accumulated in water that melts, during several years, with no temperature increase, and rest of planet maintained mean temperature, skeptics would say global warming had stopped … They could be considered right, but the global warming “problem” wouldn´t have dissapeared …
Re- Comment by Pierre-Emmanuel Neurorh — 19 Feb 2014 @ 11:57 AM
I prefer to indicate the figure under “The global temperature jigsaw” RC topic and ask a denier to show me the pause in warming- https://www.realclimate.org/index.php/page/3/?wpmp_switcher=desktop
Unfortunately, we both assume that actual evidence is more important than opinion.
Steve
JCH above quoting Gavin, saying Gavin agrees with JCH’s definition?
As I read Gavin’s words, he distinguishes “air” temperature (JCH’s idea) from the change in the surface (land and water/ice) temperature.
“the” definition used to be air temp., when it was all we had.
This topic is about water temperature, for example.
Hank @31, thanks. That makes it sound like I was more confused than I thought.
My question, thinking more clearly, came down to asking whether the ocean is warmer or cooler than the atmosphere — so is El Nino / reduced trade winds going to cause heat flux from ocean to atmosphere, or merely reduced heat flux from atmosphere to ocean (either way, the atmosphere gets warmer). I was reading “the heat will come back up” as meaning a heat flux from ocean to atmosphere.
But it seems like I was just barking up the wrong tree, and this is not what the interesting scientific question is… I’ll need to read more to understand this.
JCH,
First, the Swanson, et. al. paper, to which you linked, has no fig. 4. Their paper firmly states, “This result is another link in a growing chain of evidence that internal climate variability played leading order role in the trajectory of 20th century global mean surface temperature.” The word “fraction” is an ambiquous term, and cannot be assigned a definitive value in this report, except to say less than the whole. (remember 1/2 and 3/4 are also fractions). My term “much” is just as ambiguous, and chosen based on their statements. Even their penultimate statement that surface temperatures could decline or accelerate over the next several decades suggests higher than “small amount” attributed to natural variability. I can see how these results could be interpretted in many different ways though.