We’ve all seen how well temperature proxies and CO2 concentrations are correlated in the Antarctic ice cores – this has been known since the early 1990’s and has featured in many high-profile discussions of climate change.
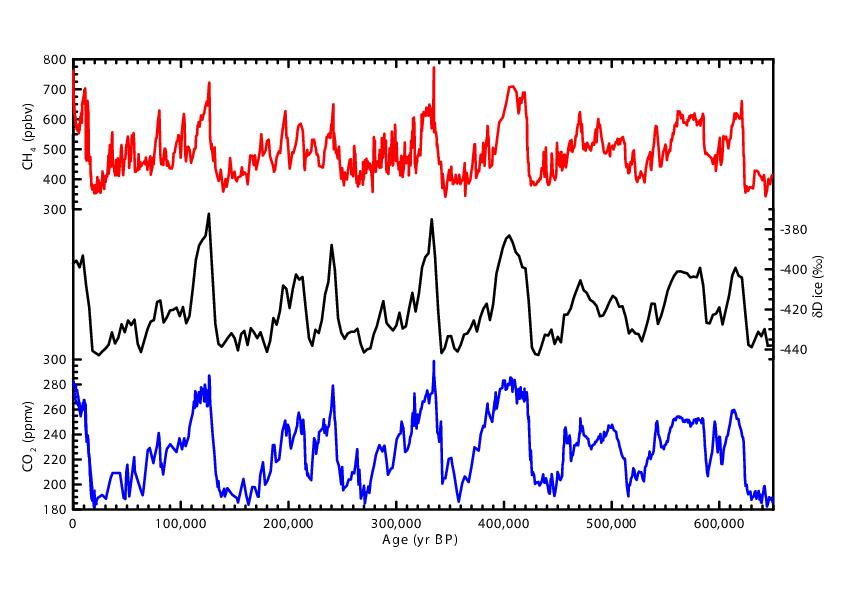
EPICA Dome C ice core greenhouse gas and isotope records.
The temperature proxies are water isotope ratios that can be used to estimate Antarctic temperatures and, via a scaling, the global values. The CO2 and CH4 concentration changes can be converted to radiative forcing in W/m2 based on standard formulas. These two timeseries can be correlated and the regression (in ºC/(W/m2)) has the units of climate sensitivity – but what does it represent?
For obvious reasons, we are interested in how the climate system will respond to an increase in CO2 and that depends on time-scale and what feedbacks we consider:
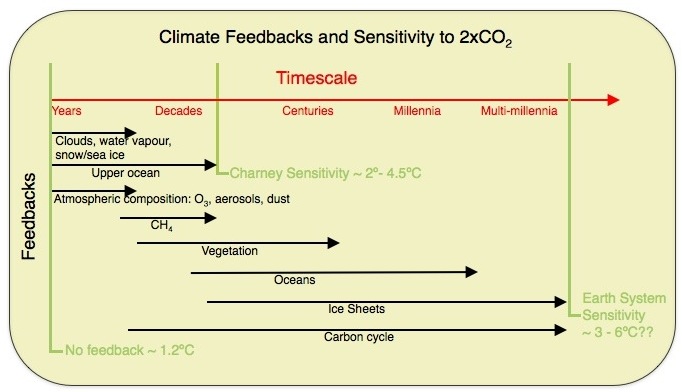
The “Charney” sensitivity is generally thought of as the medium-term response of the system, including all the fast feedbacks and some of the longer term ones (like the ocean). This is usually what is meant by climate sensitivity in normal conversation. On longer (multi-millennial) timescales we expect changes in vegetation and ice-sheets to occur and alter the response and that sensitivity is often described as the Earth System Sensitivity (ESS).
But let’s go back to the correlation from EPICA Dome C:
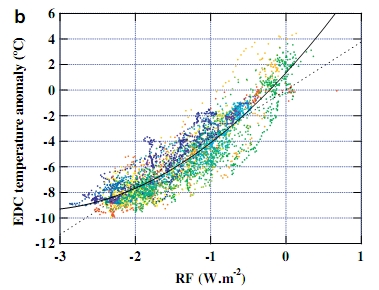
Regression between temperature and GHG radiative forcing from Masson-Delmotte et al (2010) via SkepticalScience.
Using local temperatures, the straight line regression is ~3.9 ºC/(W/m2). Assuming that global temperature changes on these timescales are roughly half as large, that implies ~2 ºC/(W/m2) at the global scale, and given that 2xCO2 forcing is about 4 W/m2, that means a ‘sensitivity’ of ~8ºC for a doubling of CO2. This is very much larger than any of the standard numbers that are usually discussed. So what is going on?
The first point to recognize is that the ice age/interglacial variations are being driven by Milankovitch forcings (“orbital wobbles”). These have an almost zero effect in the global mean radiative forcing but make huge differences to the seasonal and regional solar fluxes. This makes these drivers almost uniquely effective at impacting ice sheets, hence temperature, the circulation, the biosphere, and therefore the carbon cycle. Notably, these drivers don’t fit neatly into a global forcing/global response paradigm.
Second, the relationship we are seeing in the ice cores is made up of two independent factors: the sensitivity of the CO2 to temperature over the ice age cycle – roughly ~100 ppmv/4ºC or ~25 ppmv/ºC – and the sensitivity of the climate to CO2, which we’d like to know.
The problem is perhaps made clearer with two thought experiments. Imagine a world where the sensitivity of the climate system to carbon dioxide was zero (note this is not Planet Earth!). Then the records discussed above would show a reduced amplitude cycle, but a strong correlation between CO2 radiative forcing and temperature. This relationship would be exactly the T to CO2 function. To take another extreme case, assume that that carbon cycle was insensitive to climate, but climate still responded to CO22, then we’d see no CO2 change and zero regression. In neither case would the raw T/CO2 regression tell you what the sensitivity to CO2 alone was.
Instead, to constrain the Charney sensitivity from the ice age cycle you need to specifically extract out those long term changes (in ice sheets, vegetation, sea level etc.) and then estimate the total radiative forcing including these changes as forcing, not responses. In most assessments of this, you end up with 2.5ºC to 3ºC in response to 2xCO2. To estimate the ESS from these cycles you’d need to know what the separate impacts the CO2 and the orbital forcing had on the ice sheets, and that is not possible just from these data. Constraints on ESS have thus come from the Pliocene (3 million years ago) or even longer Cenezoic time scales – giving a range roughly 4.5ºC to 6ºC. Lunt et al (2010) and Hansen et al (2008) have good discussions of this and we discussed it here too.
The bottom line is that you can’t estimate Earth System Sensitivity solely from correlations over ice age cycles, no matter how well put together the temperature data set is.
References
- V. Masson-Delmotte, B. Stenni, K. Pol, P. Braconnot, O. Cattani, S. Falourd, M. Kageyama, J. Jouzel, A. Landais, B. Minster, J. Barnola, J. Chappellaz, G. Krinner, S. Johnsen, R. Röthlisberger, J. Hansen, U. Mikolajewicz, and B. Otto-Bliesner, "EPICA Dome C record of glacial and interglacial intensities", Quaternary Science Reviews, vol. 29, pp. 113-128, 2010. http://dx.doi.org/10.1016/j.quascirev.2009.09.030
- D.J. Lunt, A.M. Haywood, G.A. Schmidt, U. Salzmann, P.J. Valdes, and H.J. Dowsett, "Earth system sensitivity inferred from Pliocene modelling and data", Nature Geoscience, vol. 3, pp. 60-64, 2009. http://dx.doi.org/10.1038/NGEO706
- J. Hansen, M. Sato, P. Kharecha, D. Beerling, R. Berner, V. Masson-Delmotte, M. Pagani, M. Raymo, D.L. Royer, and J.C. Zachos, "Target Atmospheric CO: Where Should Humanity Aim?", The Open Atmospheric Science Journal, vol. 2, pp. 217-231, 2008. http://dx.doi.org/10.2174/1874282300802010217
Isn’t there an even bigger issue that approx half of the temperature amplitude between glacial and interglacial isn’t actually due to CO2 or other GHG, but to albedo changes (ice albedo feedback)? If you ascribe the whole temperature change to GHG, you end up overestimating the sensitivity to GHG. Even though the albedo change acts as a feedback, this won’t act nearly as strongly going from the current to a warmer climate as compared to during glacial-interglacial transitions when there was tons more ice.
Bart (#1),
I don’t think that is a different, independent issue…I think it is just the issue that they talked about explained with a somewhat different emphasis. (Their emphasis was that some of the change in CO2 levels is caused by change in temperature and not vice versa and your emphasis is explaining what is likely causing those change in CO2 levels and also causing much of the temperature change that is not being caused directly by the change in CO2 levels.)
Hello realclimate.org
Thanks for your excellent work.
I have a question : is there a point at which albedo loss equals CO2 forcing?
Or in other words, what’s the proportion of albedo loss relative to CO2 forcing?
Thanks in advance
Jack
[Response: The albedo change, going from last glacial maximum to present (pre-industrial time) was about 3.5 +/-1 W/m^2, whereas CO2 change (including other greenhouse gases) was about 2.6 +/- 0.5), and aerosols about 0.5 +/-1. (These numbers are from Hansen 2004, but haven’t changed all that much with further refinements. So albedo change (owing to changes in orbital forcing, which is what melts the ice sheets) was comparable to, and probably larger than, the CO2 change. –eric]
See also my old RealClimate post on the subject, here:
https://www.realclimate.org/index.php/archives/2007/04/the-lag-between-temp-and-co2
As I explained, you *can* get at climate sensitivity with the ice core record, but only by taking into account all the forcing (including, in particular, the ice sheet albedo). When you do that, you get essentially the same answer as the standard IPCC sensitivity. Claude Lorius, Jim Hansen, and others, all had this figured out more than two decades ago.
A very common way to *miscommunicate* this subject is to conflate “climate sensitivity to CO2” with “climate sensitivity to radiative forcing.” In the scientific literature, the jargon is often used interchangeable with an implicit understanding that 2xCO2 = 3.7 W/m2 of RF. But this distinction is often lost on even well-informed lay readers, so it’s very easy for the discussion to go off the rails pretty badly.
As Eric pointed out in #4, the key is to estimate *all* radiative forcing. So for example deglaciation warmed global mean temps by about 5 C over 10k years with a radiative forcing of about 6.5 W/m2 (total of both GHG increases and albedo decreases). This leads to a calculated climate sensitivity *to radiation* of about 0.77 C/(W/m2). Converting this to climate sensitivity *to CO2* we get [3.7 W/m2 RF per 2xCO2] * [0.77 C per W/m2 of RF] = 2.85 C per 2xCO2, which is right in line with other estimates from both paleo and modeling studies.
As Gavin points out in this post, there are also subtleties involving different feedbacks operating over dramatically different time scales (clouds & water vapor over 1 year vs ice sheets & carbon cycle over millennia). Also, the onset of glaciation or deglaciation appears to be triggered by orbital effects that have big seasonal/regional impacts but apply almost zero RF in the global mean. Sorting out forcing from feedback from response in this case therefore involves some semantic parsing.
It’s no wonder people get wrapped around the axle on this subject!
[Response: Well explained, Scott. I agree, it’s easy to see why people get confused. The language in the literature can be pretty obscure on this subject, even though it’s actually pretty straightforward. –eric]
The is our initial source of heat, but is their another source of heat that has not been taken into account? and if it has, ok. What i’am talking about is that when we use fossil fuels we release GHG’s but also generate heat which escapes to the atmosphere, think of a car engine or an airconditioner for example. Has this been taken into effect?
Simon.
For Simon Edwards: Yes; it’s small.
http://www.climatecentral.org/news/fossil-fuels-heat-climate-dramatically-19062
SE 6: when we use fossil fuels we release GHG’s but also generate heat which escapes to the atmosphere, think of a car engine or an airconditioner for example. Has this been taken into effect?
BPL: Yes, but it’s trivial compared to the amount of energy coming from the sun, which is what drives climate.
Simon Edmonds:
People have considered this. I know that’s hard to believe.
Simon Edwards (#6): Yes, there is a certain amount of heat added to the atmosphere & ocean by the combustion of fossiel fuels as well as other heat sources (e.g. nuclear).
However, as BPL notes, it is only a very small fraction of the measured increase in heat content of ocean & atmosphere and of the total amount of power (W/m^2) which we receive from the sun.
Total power generation is about 16 TW, 16000 gigawatt (thermal, not electric). This is about 0.03 Watt/m^2 of Earth’s surface while 2 x CO2 causes a radiative forcing of 3.7 Watt/m^2. The power we receive from the sun – averaged over day and night, considering albedo, over Earth’s surface – is about 239 W/m^2.
So total human power generation is on the order of 1/100th of the extra heat we retain due to the anthropogenic (increased) greenhouse effect, and on the order of 1/10000 of the Sun’s power.
Scott at 5. Well put. I think the problem is that almost all humans excepting extreme math-o-philes like to think in terms of explicit causes only. But nature is coupled implicit equations, and for systems like climate you have the complication of vastly differing time scales are well. So we are stuck with creating nontrivial mathematical models, turning the crank, and accepting the results that come out. It doesn’t lend itself to thirty second sound-bite explanations, but leaves plenty of scope for propagandists to mislead.
Btw. Asimov wrote in 1971: “If the present carbon dioxide content of the atmosphere were merely to double, the average temperature of the Earth would increase by 3.6° C.” https://www.triumf.info/wiki/pwalden/index.php/Isaac_Asimov_predicts_Global_Warming_findings_in_1971 related video https://www.youtube.com/watch?v=XsGa4I8_BOo
Simon Edmonds, have a look at Its waste heat at Skepsci.
Is the increased forcing from heat absorbed in the Arctic from the drop in snow cover and Arctic Sea Ice included in the Charney sensitivity or is it part of the larger Earth System Sensitivity?
Approximately what is the estimated added forcing from these effects? Is this additional forcing an important factoid or does it roll into other forcings or unknowns as a small effect?
I noticed that you have had more postings recently. I rarely post at RealClimate, but I read all your posts and think that your posts are always very informative. When I first started reading about climate change about 10 years ago I thought you were often too conservative, but as the years pass you seem better and better. The more I understand the more your posts seem to conform to observations. Your post at 538 was also very informative.
The ice age T variations are primarily due to orbital changes and their effects alter the CO2 concentration. If the orbital change produces a cooling more CO2 dissolves in the ocean and enhances the cooling. The effects of CO2 are a feedback. This is not the case currently. The CO2 concentration is a primary driver of atmospheric and surface temperature.
The fundamental reason that CO2 and global surface temperature are so highly
correlated during comings and going of the the ice ages is that the orbits cause the temperature change, and then the resulting heating of the ocean causes it to outgas some CO2 to the atmosphere. This extra CO2 then goes on to amplify the temperature increase slightly, in what scientists call a “feedback”.
So the observed slope of the correlation between CO2 and temperature tells us mostly about how sensitive CO2 is to temperature, not the other way around. To get an actual example of how CO2 directly impacts temperature, from the past, we have to go back 56 million years to the so-called “PETM”, a time when fossil CO2 was put directly into the atmosphere by an extraordinary epsiode of volcanism beneath a massive oil field as the North Atlantic ocean rifted open.
In this example, CO2 quadrupled and global temperature warmed about 6 degrees C. This gives a climate sensitivity of about 3 degrees for a doubling, consistent with the widely used “Charney sensitivity”.
To sum up, the ice ages give us information about how CO2 responds to temperature increases but not, unfortunately, information about how much warming CO2 causes.
[Response: Jeff, thanks for dropping by. Just a clarification (I know you know this, but not all our readers will!): the fact that the ocean was colder during glacial periods by itself explains only about 10% of the CO2 change. Dynamical, biological and chemical changes that go *along* with the temperature change are required to explain the bulk of the changes in CO2. –eric]
For SE: this thread makes it clear why it’s easy to argue about the contribution to heating from fossil fuels, as the blog commenters above have given you answers that range over many orders of magnitude. If you didn’t look it up for yourself and just relied on blog commenters for information, it would seem reasonable to conclude they don’t know what they’re talking about.
They do, most of them, but without cites to their sources it’s easy to be confused about why the numbers given vary so much.
You should read the linked article and the research behind it to understand the numbers.
For those providing opinions — links to a cite, or showing your work, is more convincing than proclaiming you know the answer.
I know, I know, I should give you a link to support that statement I just made. Trust me.
Since there will be readers who don’t bother to clicky the linky, I’ll paste in just a bit more from the source I suggested reading.
Did you bother to click the link to read the paper? That’s usually helpful figuring out what the journalists are trying to say.
Basic point — as Gavin is quoted as saying — just burning fossil fuel, if there were no greenhouse effect, would be trivial for climate.
But if there were no greenhouse effect — we’d be in a different universe with different physics.
When you look at the changes in Arctic temps during the warming side of glacial cycles, temps and co2 rise almost immediately. Well before all of the ice has had a chance to melt. The lines on the charts are almost vertical. During the glacial advance part of the charts, the lines of temps decline like stair steps in tandem with the decline in CO2 concentrations.
I trust the claims that we need to consider albedo change to determine ESS but it sure looks like the dominant factor by far is CO2
“15 Jack Barrett
If the orbital change produces a cooling more CO2 dissolves in the ocean and enhances the cooling. The effects of CO2 are a feedback.”
And if the orbital change produces a warming less CO2 dissolves in the ocean and enhances the warming. A positive feedback again.
So here is my question. Today we see a negative feedback unlike the situation described above. The ocean doesn’t release more CO2 while warming, quite the opposite… Will this situation reverse on bigger timescales (probably will)? And which CO2 levels at the atmosphere to be expected after this longterm positive feedback instead of shortterm negative one?
(Back of the envelope calc: now oceans absorb 30-50% of antropogenic carbon, more or less the same as the atmospere. So without this current negative feedback CO2 levels would already be around 540 ppm, thats a “neutral feedback” level. And we have to add some carbon eventually released from the warming ocean. In case of doubling CO2 under current negative feedback conditions we should expect 560+280+unknown ppm longterm by analogy. And so on. Am I wrong?)
I think trying to claim CO2 (or Albedo or whatever) is a cause in one case and a feedback sheds more heat than light on the subject. Its a coupled implicit nonlinear system, and you have to model it and solve the resulting equations. Trying to create simple uni-causal explanations as a way to convince math-o-phobes is problematic.
About direct heat emissions I have seen a figure quoted of 0.1C or 0.3% of radiation from the sun. Is this correct?
I didn’t know that, and find it quite interesting. What are the other (proposed?) feedbacks? And what levels of uncertainty attach to the various contributions? Pointers, perhaps, to some lit on this?
dp @21
.3% (as well as .1C) has to be way too high. The general order of magnitude I recall of human energy versus solar input is 1:10000, or .01%. This is averaged over the whole planet -much of which is ocean or unoccupied desert. .3% might represent a typical urban number perhaps.
Jeff Severinghaus #16,
You say CO2 quadrupled during the PETM. From what to what level? And how certain is that? It seems there’s still quite some discussion on what happened during the PETM. Which references would you recommend?
#24, Lennart–
From sub-1,000 ppm to ~4,000 ppm, as discussed in this SkS post from a few years back. But I hope Jeff will respond in more detail (and perhaps with more up-to-date information as well.)
http://www.skepticalscience.com/co2-rising-ten-times-faster-than-petm-extinction.html
Re #23 Afraid I got the decimal points wrong on my post. The figure for human energy should be 0.03% of radiation from the sun. this equates to 0.1c warming. In the same vicinity but somewhat greater than the 0.01% you have. Anywhere this can be checked?
> Anywhere this can be checked?
You’d need an accurate quantity of carbon burned.
“order of magnitude” means somewhere between a tenth to ten times the number given.
DP writes on the 2nd of October, 2016, at 9:10 AM
“The figure for human energy should be 0.03% of radiation from the sun. this equates to 0.1c warming.”
1) In the phrase “radiation from the sun,” is that the incident or absorbed radiation ?
2) How is a heat flux related to a temperature increase ?
sidd
Kevin @25, thanks for the reference to Cui et al 2011.
IPCC AR5 WG1 Ch.5 says:
“The PETM was marked by a massive carbon release and corresponding global ocean acidification (Zachos et al., 2005; Ridgwell and Schmidt, 2010) and, with low confidence, global warming of 4°C to 7°C relative to pre-PETM mean climate (Sluijs et al., 2007; McInerney and Wing, 2011). The carbon release of 4500 to 6800 PgC over 5 to 20 kyr translates into a rate of emissions of ~0.5 to 1.0 PgC yr–1 (Panchuk et al., 2008; Zeebe et al., 2009). GHG emissions from marine methane hydrate and terrestrial permafrost may have acted as positive feedbacks (DeConto et al., 2012)…
Climate reconstructions for the warm periods of the Cenozoic also provide an opportunity to assess Earth-system and equilibrium climate sensitivities. Uncertainties on both global temperature and CO2 reconstructions preclude deriving robust quantitative estimates from the available PETM data.”
So I’m still wondering how certain we can be of CO2 quadrupling during the PETM (others estimate less than a doubling) and how much of this rise can be considered forcing and how much feedback. Hopefully Jeff Severinghaus can comment?
Sidd,
The sunlight striking Earth is intercepted on its cross-sectional area, π R^2, where R is the mean radius. Each square meter of that area receives the Solar constant, S, but we reflect back a certain percentage, the albedo A. Thus power in is
Pin = S (1 – A) π R^2
Meanwhile, Earth radiates from its whole surface area, which is that of a sphere–4 π R^2. Its emission temperature creates radiation by the Stefan-Boltzmann fourth-power law. Power out is then:
Pout = 4 π R^2 σ Te^4
where σ is the Stefan-Boltzmann constant, 5.670373 x 10^-8 W m^-2 K^-4.
Equating power in to power out (conservation of energy and all that), we have
S (1 – A) π R^2 = 4 π R^2 σ Te^4
The common terms (π R^2) drop out, leaving
S (1 – A) = 4 σ Te^4
So Earth’s radiative equilibrium temperature is
Te = (S [1 – A] / [4 σ]) ^ 1/4
For a Solar constant of 1361.5 W m^-2, and an albedo of 0.3, T comes out at 255 K. The 33 K difference from the mean surface temperature is due to the greenhouse effect.
Try varying S and see what happens to Te.
With reference to my earlier points
In 1) i meant to indicate that a factor of 3 discrepancy might be explained by the ratio of absorbed to incident radiation
In 2) i wanted to discuss the different forcing efficacies of solar shortwave compared to anthro fossil carbon combustion upon global average surface temperature, rather than the emission temperature at top of atmosphere
sorry for not being clearer
sidd
Doubling CO2 increases radiative forcing by 3.7 watts per square meter. To equal that in Solar forcing, S would have to vary by ~1%–a difference never seen in historical times.