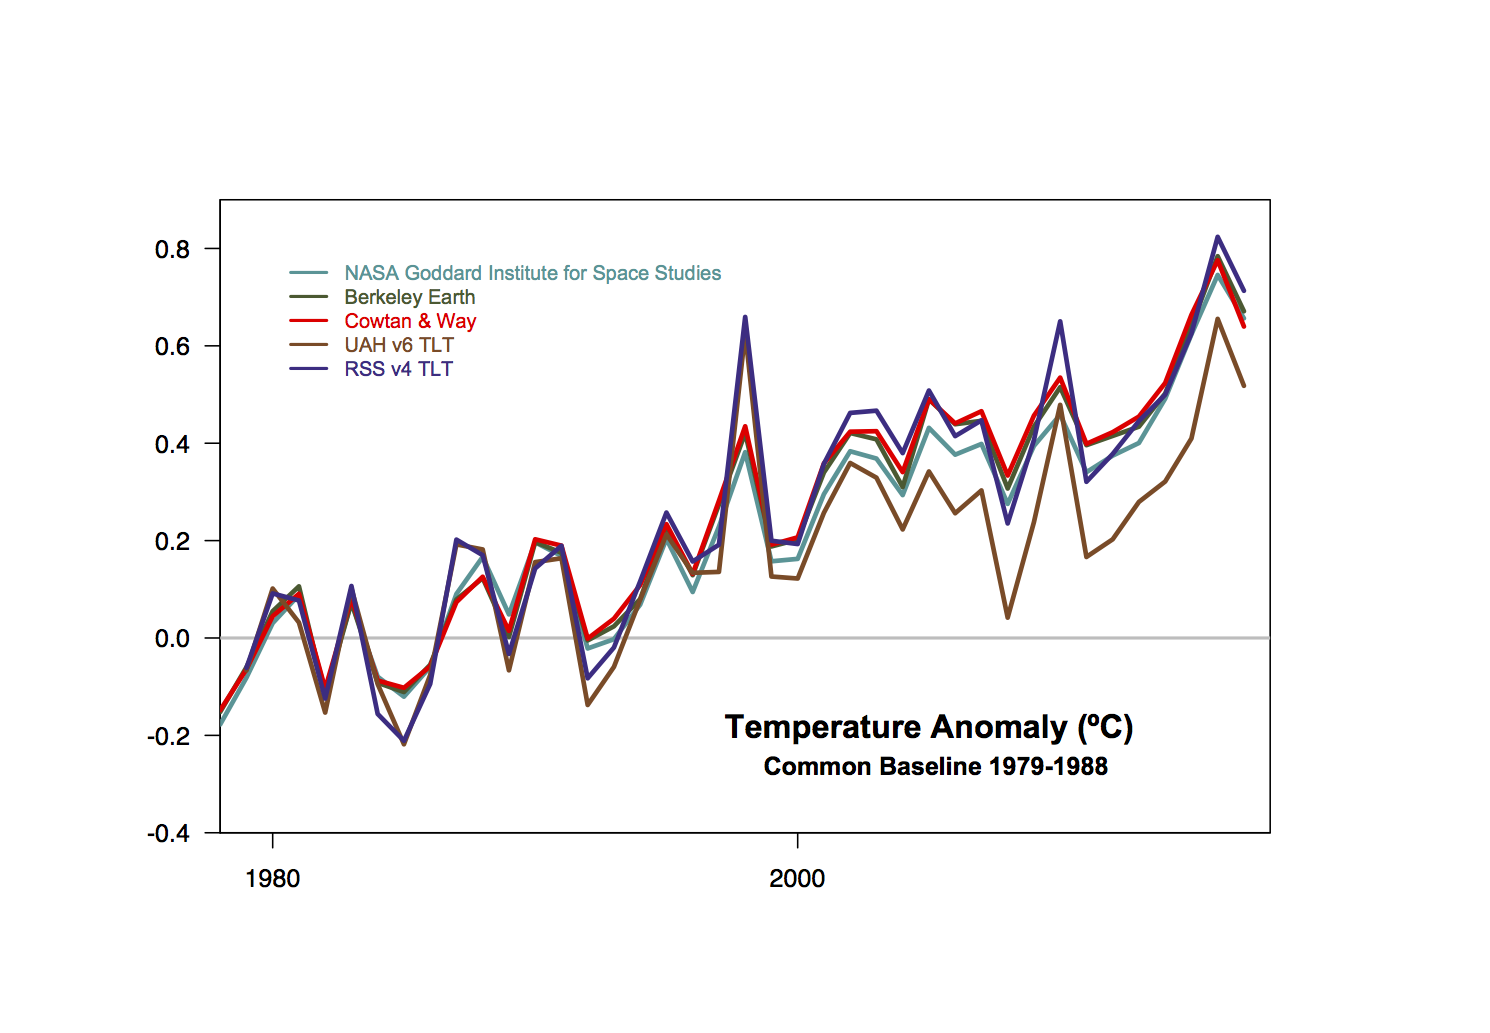
This is a thread to discuss the surface temperature records that were all released yesterday (Jan 18). There is far too much data-vizualization on this to link to, but feel free to do so in the comments. Bottom line? It’s still getting warmer.
[Update: the page of model/observational data comparisons has now been updated too.]
RE #31 Gavin in-line,
Your ref to ‘discussions’ mentions this item: map to see how local temperature changes compare to the global average over the past century (http://warmingworld.newscientistapps.com/).
That’s defunct, the only “active” site I could find via search is this by Paldhous, but it is not working either.
Climate Change | New Scientist
paldhous.github.io/climate-change/
YOUR WARMING WORLD.
—-
Is there another APP like this available today?
—
and fwiw the 2014 WH “Climate Data Initiative” is also gone (don’t know when that happened) https://catalog.data.gov/dataset
re https://news.nationalgeographic.com/news/2014/03/140319-white-house-climate-data-app-website-global-warming-science/
48 Titus says: “So Gavin is actually using a projection to show it has only been warming since the 19th century.
No he is not. Obviously.
Gavin, thanks for the updates. Looking at the satellite/CMIP5 graphs and histograms at the bottom of the page,I notice that you refer to a 95 percent envelope of simulations. In contrast to that I’ve noticed that some other commentators and the AR5 synthesis report refer to a 95 percent confidence interval. Since the term confidence interval ordinarily has a specific meaning in study design statistics, I’m wondering if we may infer from your choice not to use that term here that you don’t think it accurate to describe the 95 percent envelope as a confidence interval? Thanks.
[Response: The CMIP ensemble isn’t a random pick from a distribution. Thus to create a CI you need to have some way of creating a pdf from the histogram. I don’t bother, so I just show the 95% envelope of the individual runs. You could be more persnickety to avoid over-emphasis on single model centers, but it doesn’t matter much. Not sure what the AR5 did. – gavin]
Keith Woollard:
Heh. KW may be wrong, but at least he’s sure 8^D!
Failure to recognize one’s own lack of skill, and inability to distinguish genuine from fake expertise, is diagnostic for the Dunning-Kruger effect.
I hope that one of your moderators might respond as to the methods used and the cooling forecasts made in comment #46 above
Is it true that there was a time during the medieval period that was hotter than today? That the Vikings settled in Greenland because it really was warm and inviting? That the North Atlantic oscillation is affected by melting sea ice and colder water is not dipping down because of less salinity? That precession and variation in earth tilt, along with eleven year solar cycle is moving radiation into an opposite trend? That sea level [6 meters higher at last interglacial max] is almost at end of that fluctuation and ready to start shifting back? That sea level was 450 ft lower when people were spreading across every continent? That whole cultures moved inland and to higher elevations as the coastlines became submerged?
Maybe we should be thinking of moving to higher ground? Maybe we should not support politicians who facilitate development in floodplains and on coastlines?
lh 56: Is it true that there was a time during the medieval period that was hotter than today?
BPL: No.
lh: That the Vikings settled in Greenland because it really was warm and inviting?
BPL: No again. They gave it that name to confuse potential rival settlers, the same reason they named the actually warm and inviting “Iceland” the way they did.
lh: That the North Atlantic oscillation is affected by melting sea ice and colder water is not dipping down because of less salinity?
BPL: Huh? What? Come again?
lh: That precession and variation in earth tilt, along with eleven year solar cycle is moving radiation into an opposite trend?
BPL: Again, what?
lh: That sea level [6 meters higher at last interglacial max] is almost at end of that fluctuation and ready to start shifting back?
BPL: No.
lh: That sea level was 450 ft lower when people were spreading across every continent?
BPL: Probably not, no.
lh: That whole cultures moved inland and to higher elevations as the coastlines became submerged?
BPL: No doubt.
climate change isn’t real my mom says so
lucille hino:
Ms. hino, why would sea level be ‘ready’ to start shifting back? Does sea level have a mind of its own?
First, on millennial timescales (i.e. ignoring continental drift), global mean or eustatic sea level is directly determined by two factors:
1) the mass of water in the ocean basins;
2) the average temperature of the seawater, which expands in volume when it warms and contracts when it cools.
Now, “anthropogenic global warming” refers to the rising mean surface temperature of the Earth, the result of increased retention of absorbed solar heat by the carbon dioxide humans have added to the atmosphere in the 3 centuries we’ve been burning fossil fuels on a large scale. That much, at least, is “settled science”.
Still with me? So, a rising eustatic sea level is an inevitable consequences of AGW because:
1) warmer annual temperatures are melting land ice, especially the Antarctic and Greenland icecaps, thus adding to the mass of the oceans (floating sea ice doesn’t add mass to the oceans when it melts);
2) a large fraction of the extra retained heat is being absorbed by the oceans, raising their average water temperature and causing them to expand.
With that knowledge, we’d be astonished if eustatic sea level were not rising. Direct satellite measurements show that it is, in fact, rising.
Does that answer your question, assuming you are asking sincerely?