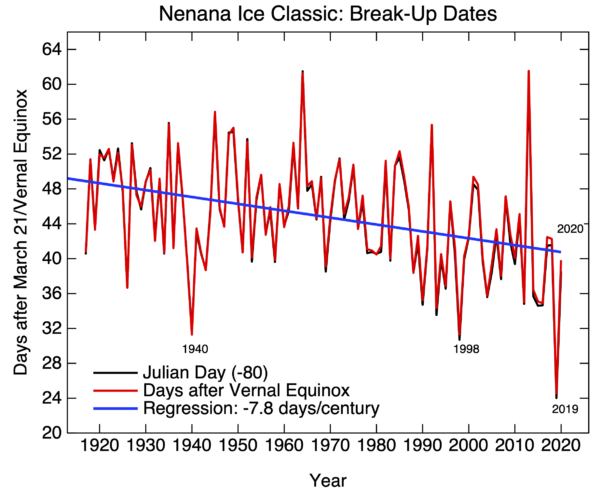
Readers may recall my interest in phenological indicators of climate change, and ones on which $300K rest are a particular favorite. The Nenana Ice Classic is an annual tradition since 1917, and provides a interesting glimpse into climate change in Alaska.
This year’s break-up of ice has just happened (unofficially, Apr 27, 12:56pm AKST), and, like in years past, it’s time to assess what the trends are. Last year was a record early break-up (on April 14th), and while this year was not as warm, it is still earlier than the linear trend (of ~8 days per century) would have predicted, and was still in the top 20 earliest break-ups.
A little side bet I have going is whether any of the contrarians mention this. They were all very excited in 2013 when the record for the latest break-up was set, but unsurprisingly not at all interested in any subsequent years (with one exception in 2018). This year, they could try something like ‘it’s cooling because the break up was two weeks later than last year (a record hot year)’, but that would be lame, even by their standards.
Gavin. we’re not even close to Peak Lame in the policy wars–
https://vvattsupwiththat.blogspot.com/2020/04/white-house-launches-strategic-virus.html
Lame??? No. It would be normal. Just like deniers “see” those “recoveries” in arctic sea ice cover every few years.
With a variance that huge, do you really think it’s an indicator of anything?
#3, Mark Ulmer–
When there’s consilience with many thousands of other such data points, do you really think a lack of statistical significance makes it not an “indicator?”
@3 Ulmer has a point, eyeballing the figure it’s not clear whether the negative slope of the fitted line has much statistical significance. Probably not enough to make it worth the trouble to pull up the raw numbers and do the math, anyway I’m lazy. The discussion of lameness etc. might be better without the line?
[Response: It is strongly significant 7.9±3.9 days/century (95% CI). – gavin]
Well, you CAN calculate the average.
“ The Nenana tripod went out yesterday, marking the break-up of the Tanana River at its confluence with the Nenana River. As I noted last week, it’s highly likely that the break-up was earlier than it would have been without such abundant run-off from excessive late winter snowfall across the region. This claim is supported by the fact that this year’s break-up occurred with the least number of thawing degree days (TDDs) on record in nearby Fairbanks: the total TDDs through yesterday in Fairbanks was 74.0, which narrowly beats out 2002 (74.5) and 2006 (75.0). We might say this year’s thaw season leading up to break-up was the coolest on record.”
See, https://ak-wx.blogspot.com/2020/04/tripod-out.html
It is pretty likely that KIA is running to a denier site right now to come up with some sort of non sequitur response. Or just hiding because he has nothing and can’t admit to being wrong about manmade climate change.:-)
Yes, I would certainly agree with Mark@3 and Spencer@5 – anyone who suggests a linear trend with an R-squared of 0.18 needs to hand back their statistics license
Keith Woollard@9: Just like a denialist to throw up his hands as soon as the data get a little noisy. Keith, here’s a concept for you to chew on. There are reasons to fit a linear trend even when we know the data are decidedly not linear. It’s a look at the first derivative of the series averaged over its duration. Literally no one is saying the series is linear.
Please see comment 4, above, and check the recent statistical literature on significance tests, e.g.:Wasserstein, R. L., A. L. Schirm, and N. A. Lazar. 2019. Moving to a world beyond “p < 0.05.” The American Statistician 73(S1):1-19.
The General Theory of Lame predicts Marc Morano will shortly attribute the ice break-up to the weight of Alaska’s burgeoning polar bear population
“This year, they could try something like ‘it’s cooling because the break up was two weeks later than last year (a record hot year)’, but that would be lame, even by their standards.”
Gavin, To paraphrase Mencken, you can never underestimate the denialists. One of their top scientific minds, a retired professor of climatology, Dr. Tim Ball, about Arctic sea-ice extent in July 2008, comparing it with the then lowest on record year 2007:
“The National Snow and Ice Data Center reports a continuation of the sea ice recovery.” https://friendsofscience.org/assets/documents/FOS%20Sea%20Ice.pdf
With Friends like these, who needs enemies …
But comes in handy in my class – when I want to illustrate that scientists too can sacrifice their integrity at the altar of ideology, or when I need a practical example of the manipulation techniques: “How to lie with true facts”, and “How to hijack the credibility of others (here: of NSIDC) to increase yours”.
And for the test I give them the graph of the global temp. anomaly and ask to use what they learned to “prove” that, in the words of another professor: “it has been [X] years and [Y] months without the so-called global warming”…
Keith Woollard@9: “Yes, I would certainly agree with Mark@3 and Spencer@5 – anyone who suggests a linear trend with an R-squared of 0.18 needs to hand back their statistics license”
Hmmm, I have thought that these are two different things – that I _can_ have low R^2 AND still have a significant slope. See for instance: https://blog.minitab.com/blog/adventures-in-statistics-2/how-to-interpret-a-regression-model-with-low-r-squared-and-low-p-values
In fact my, admittedly amateurish, understanding was that having high R^2 would be important for explaining/predicting the highly variable year-to-year fluctuations , but for proving a CLIMATE trend, i.e. changes at multidecadal scale, the year to year up and down fluctuations average each other out and what is left is the long-term, i.e. climatic, trend.In other words, it is no longer about high R^2, but about the significance of the regressions SLOPE.
So where did I go wrong, so I can join Gavin in handing our statistics licenses back to you, Mark and Spencer?
Piotr
I think that what some people are missing is that goodness of fit is not necessarily a test of statistical significance.
@9 And here I was just going to give Keith a copy of my roulette wheel prediction system that “only” can predict about 18% of the variance in the numbers coming up. But since it’s worthless to him, I guess I won’t.
Keith Woollard@9, a low R-squared value simply means there’s a lot of noise; it doesn’t mean that the trend is insignificant.
#13, piotr–
Or maybe, “With enemies like these, who needs Friends…”?
Lake Winnipesaukee in central New Hampshire, which I used to live in a beautiful spot high above on the south side in Gilford, also keeps track of their “ice-out” date. This year it was April 6th, the 14th earliest date out of 134 years.
The trend over all these years is -0.56 days/decade, and the 30-year trend is -1.70 days/decade.
https://www.winnipesaukee.com/index.php?pageid=iceout
19 David Appell
From your article: ” The setting of the exact date and time is non-scientific…..”
;)
Speaking of break-ups…when is someone going to intervene and help get this guy’s mental state patched-up? https://twitter.com/MichaelEMann/status/1257705606640787460/photo/1
Since 1990 the trend has been about the same. Linear “trends of death” are not real, climate actually cycles.
Just eyeballing the plot (obviously not a statistically meaningful operation) it looks like there might be a change point around the mid 1970s, with no trend prior to that, and a downward trend after that. Perhaps someone who has the numerical data and who knows how to do change point analysis could look at that.
Robert – yes, this point has been made pretty much every year Gavin puts up these pointless posts. If you split the record at 1970, the slope is -1.5 days/century before and -20 days/century afterwards. In fact move it a year earlier and the slope is slightly positive for the first half.
Wool*ard at 24: “[blah,blah,blah]…every year Gavin puts up these pointless posts…[blah,blah,blah]
This guy is completely numb between the ears. He appears to be ignoring the prime safety directive of a job in the petroleum industry – “Don’t snort the product.”
Gavin said nothing about the validity of the linear regression model. All he said is that this year’s date is earlier than the linear model’s prediction. His only statement about the model itself is “it’s time to assess what the trends are.”
Everybody can see that there is probably a breakpoint in the data, and that the recent trend is more extreme than the linear one. Lots of possibilities for exploring the relationship between the ice breakup date and temperature (which also has a mid-century breakpoint), carbon dioxide concentrations, etc.
Pointless, my arsch.
Taking bets that Arctic ice will bottom out at over four million sq km as usual next September. (As since 2007 save 2012). The Arctic is where iit was in 1935 and is not melting. Wake up everybody
RE. Coeur de Lion @26
Well right now for this year ice loss is tracking the same as 2012 so good luck with that bet.
BTW, minimum Arctic sea ice extents around 1935 were about seven million square miles, so no, the Arctic isn’t where it was in 1935.
https://neven1.typepad.com/blog/2016/01/september-arctic-sea-ice-extent-1935-2014.html
Climate denials is immoral, unethical, a Crime Against Nature and a Crime Against Humanity.
#EcoNuremberg
@26
Thank you for presenting your penetrating and insightful data and work.
#26, CdL–
Wake up, yourself. Contending that the “Arctic is where iit was in 1935” [sic] is either bullshit or an intentional lie.
To cite one example:
https://journals.ametsoc.org/jcli/article/32/15/4731/343909/Arctic-Sea-Ice-Volume-Variability-over-1901-2010-A
Coeur de Lion (26): “The Arctic is where iit was in 1935 and is not melting. Wake up everybody”
yeah, those satellites from 1935 – very reliable. For those that are not imaginary (i.e. since 1979) – see:
https://www.arcus.org/files/sim/briefs/figure1_pyramid4.png
Ice volume decline even worse: “over 60% of the ice volume lost in only 30 years”?
And going where the big money is (the oil multinationals, Russia and Saudi Arabia whose economy and geopolitical influence will collapse if we stop burning their oil and gas) – does not take the heart of a lion. So you may need another handle:
How about “Putin’s Useful Idiot”?