To no-one’s surprise 2024 was the warmest year on record – and by quite a clear margin.
Another year, another data point. Unlike the previous year, 2024 was anticipated to be a record breaker even before it began (I predicted a record – despite the huge anomaly in 2023 – with a 55% probability). It did fall at the higher end of the prediction, so maybe we are seeing the
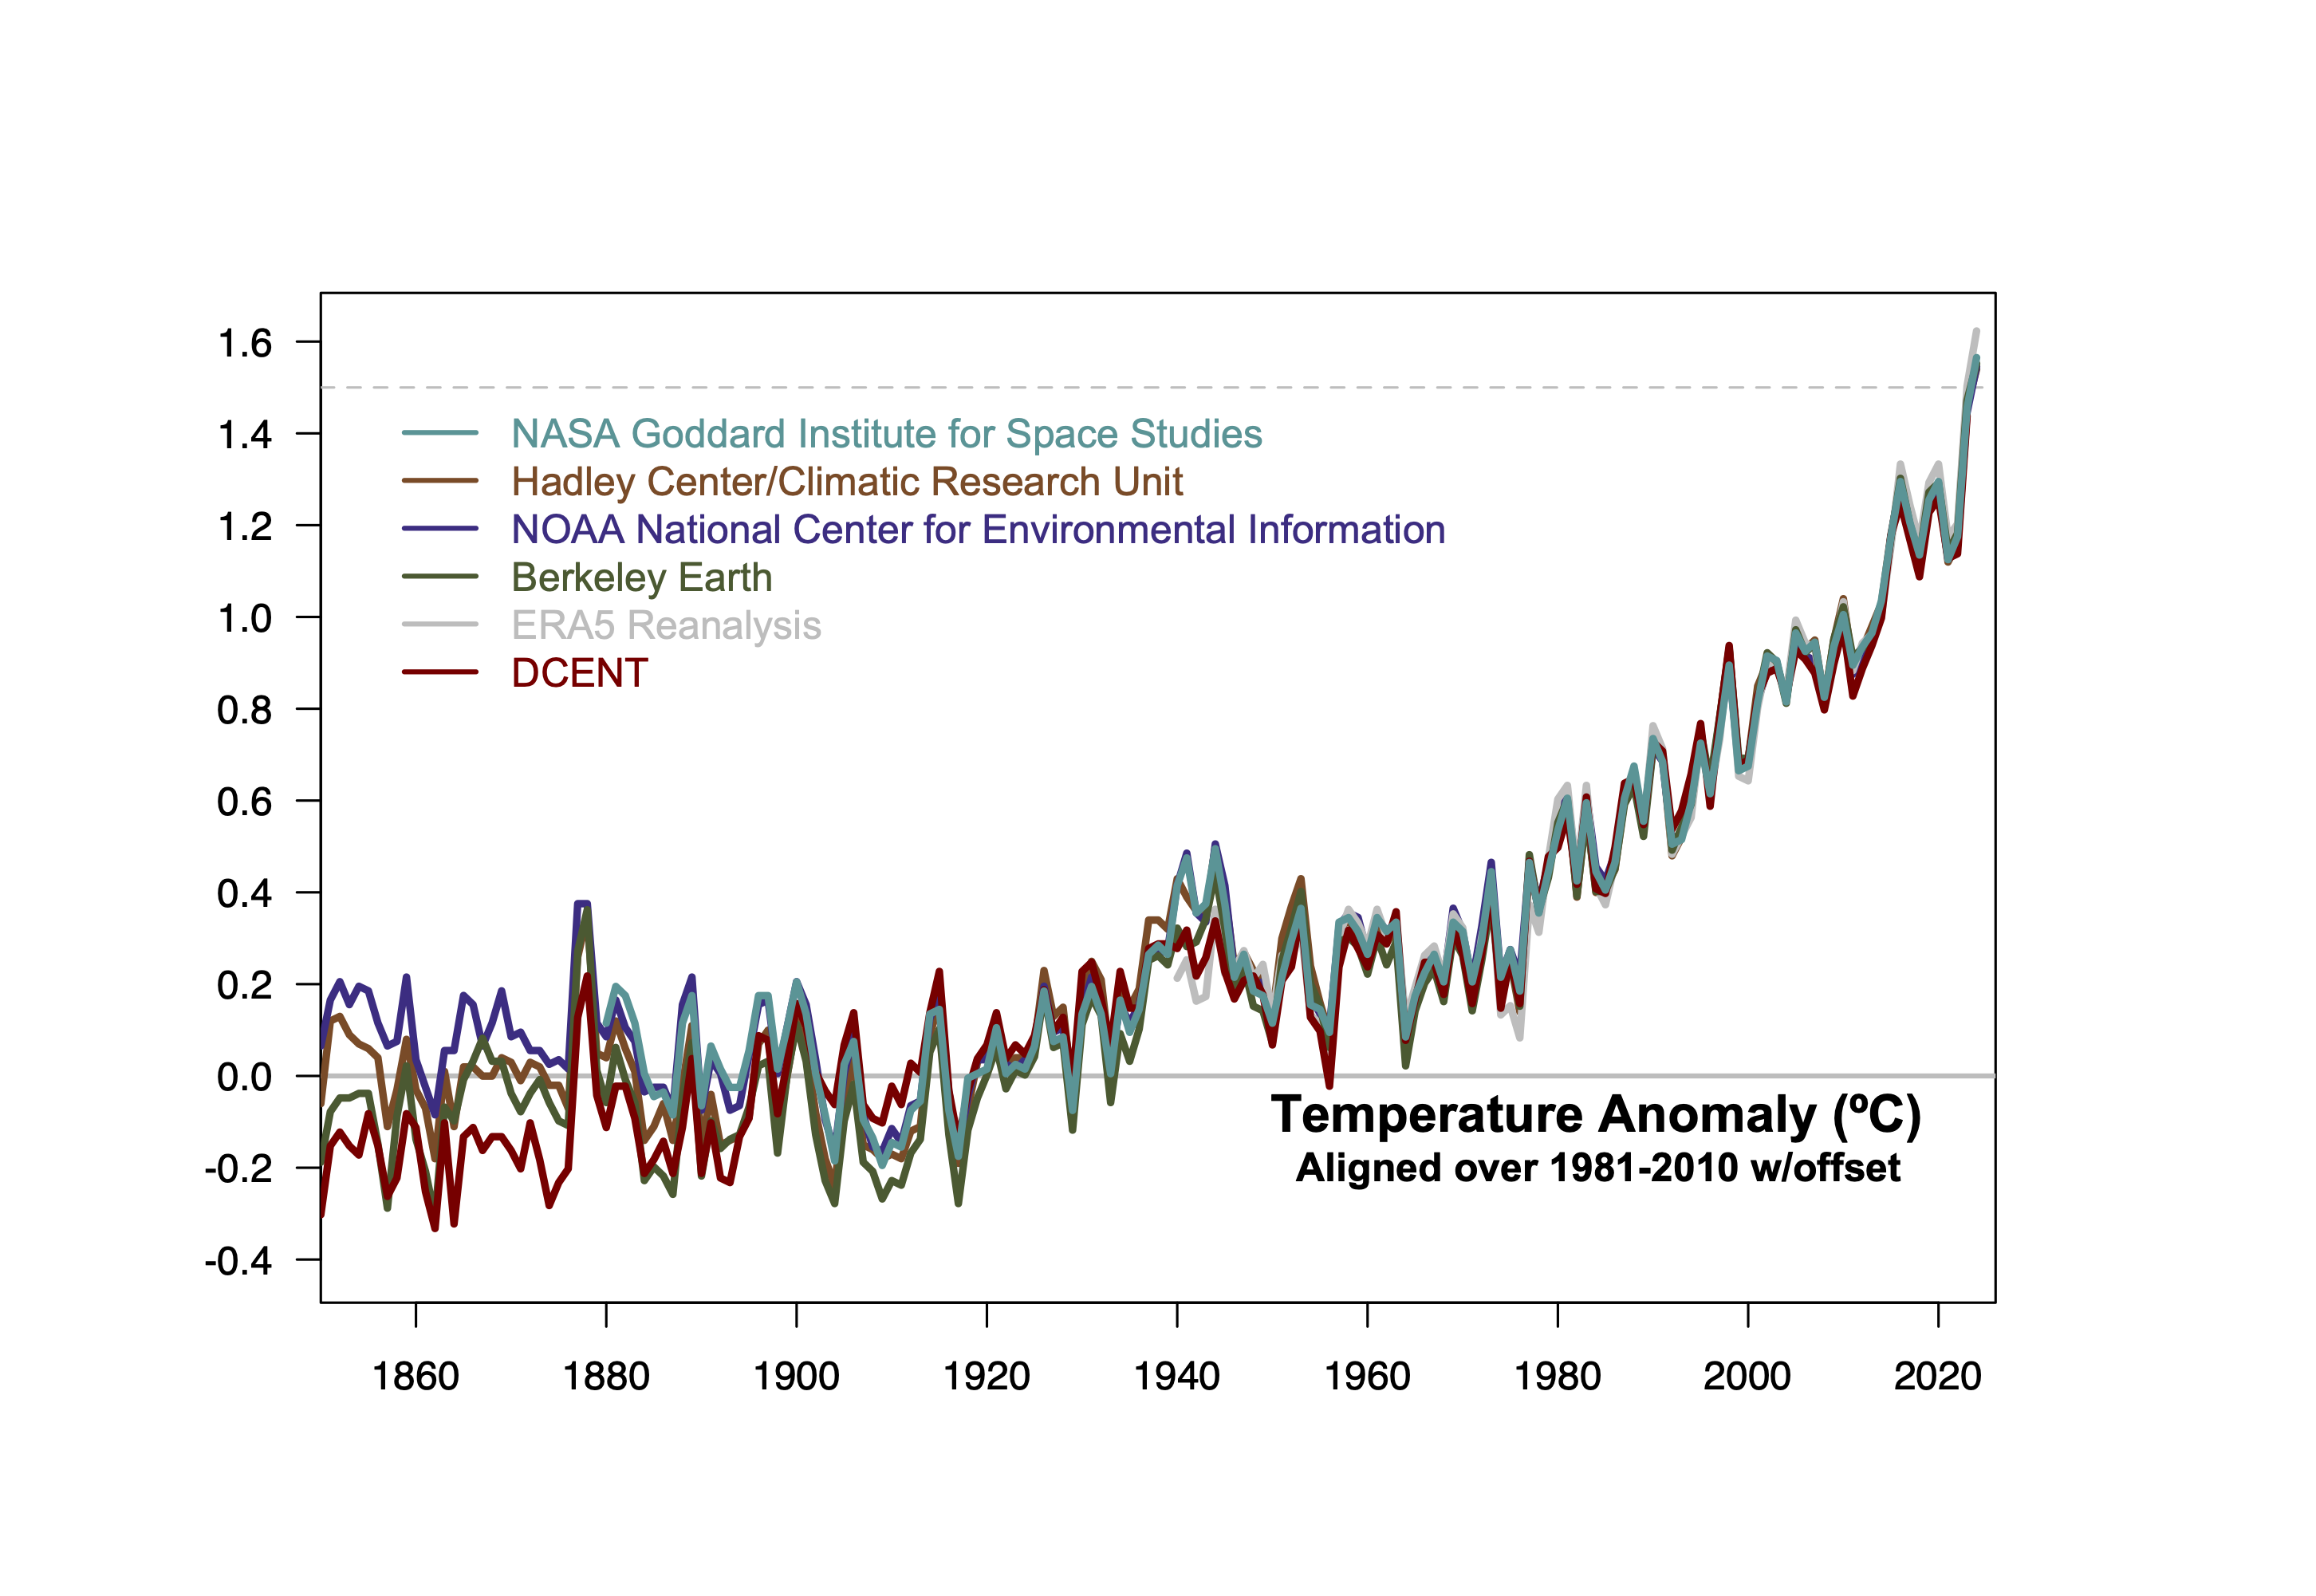
The value for 2024 in this graph is then 1.54±0.07ºC. However, this is sensitive to the inclusion of the DCENT record and to any further updates in the earlier parts of the records. There isn’t a perfect answer here, but comments on what to do (for different purposes) are welcome below.
Ummm… MSU
With much of the focus on the longer-term records, it seems to have flown under the radar a little how oddly the MSU/AMSU records have been behaving over the last year or so. As with the surface records, the satellite products (UAH, RSS, NOAA STAR) all have 2024 and 2023 as the warmest and second warmest years, but unlike the surface records, 2023 was not such a outlier (~0.06ºC above 2016), while 2024 was huge (with records broken by ~0.32ºC). Additionally, the time over which the peak temperatures have lasted (17 months or so) is much shorter than the peaks around 2016 or 1998 (7 months). I don’t have much insight into why this is happening, but it might hold some clues about the drivers of the recent anomalies.
Thanks for this excellent article.
Gavin says: ” I don’t have much insight into why this is happening, but it might hold some clues about the drivers of the recent anomalies. “End of the year, but before we start with the summaries of 2024, what does 2025 look like? These predictions are based on the long term trend plus an anomaly based on predicted ENSO for the DJ period.” https://bsky.app/profile/climateofgavin.bsky.social/post/3lemrq6jgcs2j
Please note Gavin’s graph does not even show Temps breaking the +1.5C anomaly line in 2025. Will it cool down? We will have to wait another year to find out, yet again. The same as every year.
And earlier has reported: “Gavin Schmidt @climateofgavin.bsky.social 21d
“Actual long term climate trends are being driven by a set of complex human and natural drivers that have no obligation to follow your simplistic formulae.”
https://bsky.app/profile/climateofgavin.bsky.social/post/3ldtuvcql3k2s
Excellent.
_________________________________________________________________
Summary of Climate Crisis Insights
1. Accelerating Global Temperature Increases:
Global temperatures in 2025 are starting off alarmingly high, with ocean surface temperatures already +0.25°C warmer than in 2023.
Ocean Heat Content (OHC) surged in 2024, adding approximately 15 Zettajoules (ZJ) of heat to the oceans. This equates to an energy release of 3.4 Hiroshima bombs per square mile of open water—a staggering amount.
2. Decreasing Global Albedo and Earth’s Energy Imbalance (EEI):
Earth’s albedo (reflectivity) has significantly diminished, amplifying energy absorption. Dr. James Hansen’s analysis equates this effect to a rise of over 100 ppm in CO₂ concentration.
The decreased albedo, along with greenhouse gas (GHG) emissions, has accelerated EEI, intensifying warming trends beyond what climate models predicted.
3. Oceanic and Ice Dynamics:
Despite a strong El Niño in 2024, which typically releases heat from the Pacific, the oceans have continued to absorb and retain heat.
The cooling effect of melting ice, which absorbs significant heat as latent energy, is being overwhelmed by other warming forces. Greenland alone has lost 6,000 billion tons of ice from 2002 to 2024.
The oceans are projected to warm further in 2025, indicating a persistent imbalance.
4. Forest Carbon Sink Failures:
Terrestrial carbon sinks, including forests, are failing. In 2023, forests absorbed far less CO₂, with some regions (e.g., Finland) becoming net carbon emitters. This reversal has negated decades of emissions reduction efforts globally.
5. Climate Models and Uncaptured Variables:
Observed warming (+1.6°C over baseline by 2024) has outpaced projections by mainstream climate models, exposing significant gaps:
Models fail to fully capture albedo variations and the impacts of ice-ocean interactions.
Cooling effects from La Niña cycles have not materialized as predicted.
Hansen’s 2023 projections anticipated these rapid temperature anomalies, contrasting with the underestimated risks in IPCC models.
6. The Illusion of “Net Zero”:
The failure of natural carbon sinks and increasing emissions from energy use (e.g., burning coal and oil) render the “net zero” target increasingly unattainable.
This underscores the inadequacy of current mitigation strategies in addressing the systemic and accelerating nature of the climate crisis.
7. Implications for the Future:
With the oceans heating relentlessly, a “monster” El Niño may emerge, exacerbating global temperatures further.
Hansen warns of a decadal acceleration in warming driven by aerosol climate forcing and unresolved ocean overturning dynamics.
The scientific community is grappling with models that are unable to account for sudden shifts, forcing a reassessment of predictions and strategies.
8. Call to Action:
Evidence suggests we are entering a catastrophic phase of climate change, driven by compounding feedback loops and systemic failures. Immediate and unprecedented action is required to address Earth’s energy imbalance and halt further degradation of natural climate buffers. And yet nothing is being said, nothing is happening. There is no global leadership for action of any kind.
AI ChatGTP maybe weak at calculating modelled climate and enso data but it is excellent at up to date summaries of what is. If you use it right.
One small observation:
> Cooling effects from La Niña cycles have not materialized as predicted.
>
AIUI, the cooling effect hasn’t materialised because La Niña itself didn’t materialise in 2024. It’s here now, but it’s a weak one.
The latest data from NOAA shows that the ENSO nino3.4 is still in the neutral condition, above the minus 0.5° threshold…
https://origin.cpc.ncep.noaa.gov/products/analysis_monitoring/ensostuff/ONI_v5.php
The same is true for the HadCRU data through November.
Mammon 11 Jan “Thanks for this excellent article”
Specifically, which part was “ excellent“?
– the 4/5 of the article about the reference preindustrial temp. that you ignored entirely?
– the remaining 1/5, the introduction, in which Gavin points were … opposite to what you argue in your “response”?
Gavin: “ 2024 was anticipated to be a record breaker even before it began (I predicted a record – despite the huge anomaly in 2023 – with a 55% probability)
You – compliment Gavin and then … proceed to eviscerate the credibility of Gavin and mainstream science for the inability to model and therefore failure to anticipate what
…. Gavin and other HAVE anticipated.
Therefore, it seems as if it …. does not matter what Gavin actually wrote – as if you have just looked for a pretext to plant your prepared in advance list of your talking points,
rushed it in to be the first post in the discussion (so anybody reading Gavin’s article will see yours), with the opening “ excellent article” compliment to soften any resistance and to suggest to the reader that Gavin has just validated your criticism of … him and the mainstream science.
The impression strengthened by your following with:
Mammon: “Please note Gavin’s graph does not even show Temps breaking the +1.5C anomaly line in 2025
The graph you speak of ends close to + 1.6C anomaly, so … what are you talking about?
Piotr: “eviscerate” implies success. Some kind of modifier showing the effort was sophomoric and failed is missing.
Dismissal of our knowledgeable, courteous hosts and assumption of privilege are boring, especially when they serve the proliferation of false information.
Susan Anderson: Piotr: “eviscerate” implies success. Some kind of modifier showing the effort was sophomoric and failed is missing.”
My analysis was about duplicitous nature of “Mammon’s” rhetoric – thus arguing from his vantage point: the contrast between his opening: “Thanks for this excellent article” and once the guard of the reader was lowered, followed with what he hoped for would be the “evisceration” of the credibility of Gavin and the climate science. But if anybody read it as a possible suggestion that he may have succeeded in that, I apologize for any confusion.
The irony is that he unwittingly gave away his intentions (using Gavin’ post as a chance to pin his PRE-PREPARED list of talking points having nothing to do with content of the post to which he pinned it), when he lectured Gavin that:
RDT-M (Resident Doomer Troll; current handle: “Mammon” ): “Please note Gavin’s graph does not even show Temps breaking the +1.5C anomaly line in 2025.
even though Gavin’s graph not only breaks this line, but goes half-way to +1.6C . Occam’s razor suggests that RDT’s response was prefabricated in response to SOMEBODY whose “graph does not even show Temps breaking the +1.5C anomaly line” and then simply attached to Gavin’s post without even bothering to check whether that canned doomers’ response … applies to Gavin’s post.
And on a general note, this and other RDT-M posts in this thread – should have put the outpouring of compassion toward him, following his “personal” post of Dec. 31, at rest. See the test of time I suggested to Mal:
Mal: Jan 1″: If Chen […] is actually grieving a son, I offer my own sincere condolences. I’ll let up on him, and apologize if he or anyone else is hurt by my comments.”
Piotr Jan 2: “I’ll guess we will see – by whether his 2025 posts will be like his 31 Dec. one, or like all those that came before.”
We didn’t have to wait long, have we?
Piotr, precision in language can be difficult; I take your point. However, many of my efforts are (I hope) directed at something a bit more accessible and obvious, since nobody who should be listening (reading) is doing so. Here’s Jgnfld, once again probably associated with rather than directly responsive to your explanation.
“Showing honestly the things of value in the data is actually pretty hard even for experts. However, as we have seen here through many, many years of posting cherry-picked, out-of-context factoids–as you do here–showing propaganda is comparatively quite easy for denial types. All it takes is simple ignorance or simple evil or both.”
On Chen, yes, some people (including you) did some digging and outed his dubious persona. I was more concerned by the ‘lists’ as I thought some naive lurker and/or layperson might happen upon this and think there was an equivalence based on the competing numbers, as if there were some validity to those using the generous hosting here to post cheap shots or clever sciency stuff that undermines RealClimate’s purpose.
There’s a whole other category of people who feel entitled to demand personal attention for their scientific shortcomings and/or refusal to accept they should go back to school (hence my frequent references to NASA global warming evidence site for basics).
Your analysis points to only one conclusion. We have passed threshholds for synergistic positive feedbacks and only rapid cessation of fossil fuel burning can prevent a global transition. See Trajectories of the Earth System in the Anthropocene Steffen et al.. 2018 http://www.pnas.org/cgi/doi/10.1073/pnas.1810141115
Since we are definitely NOT reducing burning of fossil fuels, but in fact fossil fuel burning is still increasing, we are on track to transition rapidly to an ice free world. Absent a silver bullet solution happening very soon, such as a sufficiently better battery that rapidly makes fossil fuels obsolete, because they cost more than solar and wind with battery backup, there is a vanishingly tiny chance of avoiding a rapid transition to a world that is ten degrees C warmer than pre industrial and that transition will be rapid. This is the result, absent rapid reduction in fossil fuel production and use, that is predicted by Hansen based on multiple papers in the past decade.
A battery that does not require scarce elements like nickel and cobalt or lithium (not scarce but economically efficient sources are limited), would at a stroke do what natural gas has done to the use of coal. Render coal plants and natural gas power plants too costly to compete, so US corporations decide to close them and build new. China is another matter now with many coal plants existing and slated to be completed, and to operate another 50 years. Because their demand for power is so great and their domestic coal is cheap, now all the solar and wind and nuclear they can build simply supplements fossil fuel plants. . National security considerations are another decision driver in China. However existing coal fired plants have closed in the US since building and operating a new natural gas plant is more economical than operating an existing plant in most locations. If China’s huge productive capacity for solar were combined with better battery systems even China would rapidly cease burning coal.
There is one strategy that would offer hope, namely a very large set of prizes as well as subsidies for better batteries, both stationary for power plants and mobile for transport. Prizes plus subsidies have been effective in spurring innovation. There is no prospect of this soon given Trump’s election.
Political considerations, NOT scientific data, drive the actions of the autocracies that produce most of the fossil fuels worldwide. Expecting Putin’s Russia or the middle eastern kingdoms and dictatorships to cut production is naive. The leaders depend on that income to hold power.
DC: there is a vanishingly tiny chance of avoiding a rapid transition to a world that is ten degrees C warmer than pre industrial
BPL: +10 C seems very unlikely to me, unless we burned all the fossil fuels available to mankind. 2 C, or 4 C by the end of the century, is bad enough.
Donald Condliffe wrote: “a sufficiently better battery that rapidly makes fossil fuels obsolete, because they cost more than solar and wind with battery backup”
It is ALREADY cheaper to build new solar power plants WITH batteries than it is to operate existing coal-fired power plants. This is one reason why solar power already provides the majority of new generating capacity being added to the US grid.
In Re to Secular Animist, 13 Jan 2025 at 6:28 PM,
https://www.realclimate.org/index.php/archives/2025/01/2024-hindsight/#comment-828974
Sir,
I am somewhat unsure that “It is ALREADY cheaper to build new solar power plants WITH batteries than it is to operate existing coal-fired power plants.”
Should it be so, then I would expect an epidemic-like shutting down fossil fuel power plants and replacing them with renewables supported by electricity storage. I believe that that providing a technology for a really cheap electricity storage would have been the most reliable way towards worldwide economy decarbonization.
Unfortunately, it is still a big challenge, because such a technology should have price tag at only a few USD per one kWh of storage capacity, combined with high efficiency about at least 70%. Batteries may fulfil the required efficiency, but for quite principial reasons can hardly ever become significantly cheaper than 100 USD/kWh of storage capacity.
Best regards
Tomáš
TK: I am somewhat unsure that “It is ALREADY cheaper to build new solar power plants WITH batteries than it is to operate existing coal-fired power plants.”
Should it be so, then I would expect an epidemic-like shutting down fossil fuel power plants and replacing them with renewables supported by electricity storage.
BPL: Coal provided 50% of American electricity around the year 2000. The present figure is something like 18%.
in Re to Barton Paul Levenson, 18 Jan 2025 at 4:29 PM,
https://www.realclimate.org/index.php/archives/2025/01/2024-hindsight/#comment-829213
Hallo Barton Paul,
I am afraid that the coal-fired power plants in the USA were mostly replaced with power plants powered by natural gas, rather than with renewables supported by electricity storage in batteries.
Therefore, I think that although your claim may be right, it does not disprove my doubts about correctness of the assertion “It is ALREADY cheaper to build new solar power plants WITH batteries than it is to operate existing coal-fired power plants.”
From another point of view, I would say that it at least does not appear yet that
“It is ALREADY cheaper to build new solar power plants WITH batteries than it is to operate prevailing classical electricity sources, including existing gas-fired power plants.”
Greetings
Tomáš
One can argue endlessly about the speed of global heating etc., politically the results so far in cutting the use of fossil fuels have been close to zero. The COPs are now fully controlled and even led by the fossil fuel lobbyists. What James Hansen said in november 2015 about the Paris socalled “agreement” (what is a voluntary agreement? No ageement! It’s just orwellian newspeak): “This is pure bullshit” has proved to be true, If the world passes 1.5 degrees C above the pre-industrial average temperature in two, five or ten years from now has obviously close to zero practical significance for the political goals being pursued by the huge majority of political and other socalled leaders. It has only been political symbolism and now even that is being thrown into the garbage bins, almost noone in power ever took it seriously, it was only theatrical costumes. In 1975 the fossil share of global energy consumption was around 75 pct., now it’s around 82 pct, and that’s out of an enormously higher total energy consumption!
The reason why the use of oil and other fossil fuels is still growing *at the same time as the consumption of non-fossil energy sources, is mainly that capitalist ideology sees exponential growth in production and sales/consumption as a necessity. This idea is seen by all mainstream economic theory as a fundamental dogma and never even discussed. Capitalism’s demand for infinite growth and therefore also for growth in the consumption of energy, is *insatiable*, and this is today seen as a kind of natural law like gravitation..
So it will be, until a clear majority realizes that continued exponential growth is impossible, because mankind is living on a planet with a limited amount of material resources. Unfortunately a clear majority of mankind, and especially of our leading “lights”, today more than ever, seem completely unable and/or unwilling to realize this, except maybe (!) in the future through enormous catastrophes.
You can’t solve the problem simply by using more renewable energy sources,
1) In the short run: because that won’t stop the growth in the consumption of fossil fuels, unless the latter are being priced clearly higher as the renewables, which must be done by some form of James Hansen’s carbon fee and dividend, to be socially just, and thus acceptable. Otherwise you get the yellow vests, truckdriver protests etc.
2) In the long run, because even exponential growth in the consumption of renewables is impossible: there are clear limits to the amounts of other resources we can consume: minerals, water, plant materials etc. without catastrophic results. Today the world is even lacking sand to make concrete. And no business leader or political leader dare to even murmur anything about the limits to growth, at least not about limits to growth in profits and payments to CEOs etc. The order of the day is rather shameless lying by openly corrupt leaders. Noone of course really believes Biden when he suddenly now, when leaving office, says that the president should not be above the law – after just having pardoned his own son’s breaking of the law. It’s at least a kind of deep mental corruption, and to say that Trump etc. are even worse, is really a very silly and invalid argument. Which is exactly why the democrats lost to Trump a second time: people are deeply tired of being taken for granted and then once again pulled around by their noses by sanctimonious hypocrits. Therefore many protest by voting for the openly corrupt and criminal types.
Mankind is so far living in a kind of “grown up”, more and more silly infancy, which is precisely what in its extreme forms characterizes the movements lead by postmodern “social” media oligarchs and “hippie”-generation fascists like Trump, Musk, Bezos, Thiel, Putin etc. etc. They simply do what a danish down-to-earth parlamentarian got famously ridiculed for saying in 1920: “If these are the facts, well, then I deny the facts!”
The historical experience so far with mankind’s ability to realize the limits to growth are unfortunately anything but encouraging (to put it mildly), as brilliantly explained and exemplified in this video lecture by Dr. Albert A. Bartlett https://m.youtube.com/watch?v=kZA9Hnp3aV4&pp=ygURYWxiZXJ0IGEgYmFydGxldHQ%3D . As someone said: it’s far easier to imagine the end of mankind than to imagine the end of the belief in limitless growth.
A typical slogan in the years around 1968 was “we want everything”, which is a capitalist slogan (and a communist!) Both ideologies in the old cold war were capitalist: the communist system was a form of “eastern” societal transformation from feudal tyranny to a state-controlled, bureaucratic and even more tyrannic form of capitalism, which then since the 1970’s (since the death of Mao) and especially since 1989 (fall of the Berlin wall) has been transformed to more westernized, but still tyrannic forms of market capitalism. In a way this is now affecting and “inspiring” the oligarchic leaders of Western capitalism in an totalitarian direction, as was also the case in more rude and barbaric forms with the old fascisms of Hitler, Mussolini etc. These themes are only being discussed in marginal intellectual circles in our now rapidly diminishing “freedom” of speech here in the West, fx. in the US by people like the historian Timothy Snyder. “Freedom” is being made synonymous with *the right of the rich and the right to lie*. Being a smart tyrant is now the name of the game, every petty-bourgeois now proclaim his or her admiration for lying smart, given that you are rich, powerfull, ruthless, famous and far to the right. The smirking and boot-licking is everywhere in the media, the voices of the people nowhere except for being relentlessly “interpreted” by opinion pollsters and “news” anchors etc., now mainly paid by the oligarchy, which is now (again…) above the law. To speak of any remaining sobering influence of scientific research in such a “freedom” and “society” is rather far from the reality.
In Re to Donald Conliffe, 12 Jan 2025 at 2:21 PM,
https://www.realclimate.org/index.php/archives/2025/01/2024-hindsight/#comment-828933
Dear Donald,
As I just wrote in my reply
https://www.realclimate.org/index.php/archives/2025/01/2024-hindsight/#comment-829170
to Secular Animist, I agree to you that a technology enabling a really cheap electricity storage might be the right clue towards a spontaneous and very quick worldwide economy decarbonization.
On the other hand, I strongly doubt that this goal can be achieved by any kind of batteries:
Although energy densities in best electrochemically active storage materials may be as high as several kWh/kg, these materials do usually form only a few per cent of the entire battery mass.
The supporting materials in a battery – electrolyte, membrane/separator, electrodes, housing – are not for free.
This is a quite fundamental reason why batteries cannot become particularly cheap. I therefore do not think that batteries can hardly ever become an economically feasible solution for seasonal electricity storage – which seems to be, however, a necessary condition for economically feasible replacement of classical energy sources with intermittent renewables in electricity production.
In this respect, I see any kind of subsidies for battery installations (or any other electricity storage technologies that are fundamentally unsuitable for enabling renewables as fossil fuel replacement in electricity production) as counter-productive and harmful. Such subsidies do in my opinion represent the most severe hindrance for fundamental innovation. Incremental improvements of established, commercially available electricity storage are unsuitable for turning renewables into an economically competitive substitute for established energy sources in a foreseeable future.
Greetings
Tomáš
TK: The supporting materials in a battery – electrolyte, membrane/separator, electrodes, housing – are not for free.
This is a quite fundamental reason why batteries cannot become particularly cheap.
BPL: Are you forgetting mass production and economies of scale? Also that materials can be recycled?
in re to Barton Paul Levenson, 18 Jan 2025 at 4:30 PM,
https://www.realclimate.org/index.php/archives/2025/01/2024-hindsight/#comment-829214
Hallo Barton Paul,
Thank you for question. I do not think that economy of scale could make batteries of any kind applicable as an economically feasible means for seasonal / large-scale electricity storage.
A quote for 1 kg sodium I obtained for a railway tank (ca 20 t Na) was 4 USD. Let us therefore assume that sodium price could become as low as 1 USD/kg, or that we can make sodium batteries using a sodium-containing compound that is significantly cheaper than metallic Na and in the built battery could be converted into sodium during its loading with electricity.
1 kg metallic sodium, if converted by its reaction with oxygen and water into sodium hydroxide NaOH, can theoretically release slightly more than 3 kWh electricity. Let us therefore assume that storage capacity of the assumed exemplary battery will be 3 kWh per 1 kg of sodium contained therein.
Let us assume that our battery has to enable storage of electricity produced from renewable energy sources at an average cost 0.04 USD/kWh, and keep it economically competitive with electricity produced from natural gas at average costs 0.05 USD/kWh, wherein the investment into our battery should return within 20 years. In a really seasonal storage regime, wherein the battery would charge and discharge only once annually, the overall load during 20 years would have been 60 kWh / 1 kg Na, and the cumulative benefit from using electricity from renewables instead more expensive electricity from classical power plants would have been 0.6 USD / 1 kg Na, still not covering the investment which was 1 USD.
This situation will, of course, change if there will be a more favourable price difference in favour of cheap “renewable” electricity. Let us assume the difference 0.05 USD/kWh. The cumulative benefit from using our battery for 20 years thus will rise to 3 USD, and the net benefit after subtracting the 1 USD investment will amount 2 USD for each kg of sodium we have put into our batteries.
Let us, however, further assume that our battery has not an ideal 100% efficiency but rather a more realistic 80 % efficiency only. In such a situation, we have to spend 1.25 kWh of the cheaper clean electricity for loading our battery, to be able to return back 1 kWh of clean electricity which we plan to consume instead of the more expensive and dirty “classical” electricity.
This way, our cumulative operational benefit becomes a function of the absolute prices of both the “classical” and “renewable” electricity, instead of the mere difference therebetween. Should both prices be 0.04 and 0.09 USD/kWh, our battery enables, during 20 years, replacing 60 kWh dirty electricity obtained for 5.4 USD with 75 kWh clean electricity obtained for 3 USD only, and the neat benefit after subtraction of 1 USD investment will be 1.4 USD per 1 kg Na. Should both prices be 0.08 and 0.13 USD/kWh instead, we replace 60 kwh dirty electricity obtained for 7.8 USD with 75 kWh clean electricity obtained for 6 USD, and the neat benefit after subtracting our 1 USD investment will be 0.8 USD per 1 kg Na.
As soon as we consider that for building functional batteries, each kg of sodium will have to be amended with about 20 kg of other materials, these numbers will change dramatically. I do not think there is any reason for a hope that economy of scale in battery production and/or in renewable electricity production can change it substantially. The same applies for various new battery concepts, irrespective how revolutionary they may be.
Nevertheless, a way how electrochemical electricity storage could enable an economically feasible seasonal electricity storage does exist. It is the concept of “electrofuels”, with a proviso that the undiluted electrochemically active medium for such a “concentrated electricity storage” can be produced by a highly efficient direct electricity conversion in a continually operating “flow” electrolyser, and can be converted back into electricity in a similarly highly efficient continually operating fuel cell.
This way, high energy densities of “electrofuels” combined with high efficiency of electricity storage therein can enable that sufficiently cheap electricity from renewables might stay competitive with electricity produced from fossil fuels. Although carbon-based fuels still have more favourable volume energy density than any conceivable “electrofuel”, they suffer from lower efficiency of their conversion into electricity in generators driven by combustion engines in comparison with efficiencies that can be achieved by direct conversion of chemical energy into electricity in electrochemical cells.
Greetings
Tomáš
–In response to Tomas, who opined that:
I think a BOTE “analysis” is, shall we say, less preferable than looking at the work of those who study these things as their day job–even illustratively. Take this forecast:
https://www.esource.com/report/130221hvfd/battery-market-forecast-2030-pricing-capacity-and-supply-and-demand
It foresees–or rather, foresaw, since it came out in ’22–a growth in the demand for battery storage to 2,725 GWH by 2030–roughly a tripling. It also agrees with other analyses in predicting that 2025 will likely see battery tech reaching the cost ‘tipping point’ of EV-ICE purchase price parity.
Before I go further, I want to acknowledge that, first, the Li battery data just linked is not “seasonal” at all; and second, that the TK analysis was for sodium, and the lithium is considerably pricier than good ol’ Na. But to the first point, the larger context isn’t seasonal storage, but rather, to once again quote TK, “enabling renewables as fossil fuel replacement in electricity production.” To the second, I point out that the logic also works the other way: if Li batteries are growing so rapidly, and expected to continue doing so, then one would expect Na-based batteries, should they become more common, to do even better where their characteristics are acceptable, or even perhaps preferable to Li.
That said, I’d also note this bit:
Now, there’s a big ol’ “Spherical cow!” I doubt anyone is ever going to run an actual system like that–or even close! Nobody is going to want to have a battery sitting idle for months at a time–not when there’s arbitrage and grid stabilization money to be made.
Nor is it likely that the limitations of any one technology are going to be determinative. On the horizon or in practice, for we have two types of flow batteries, as well as thermal storage and mechanical storage (including the venerable pumped storage.)
More on storage as its developing:
https://www.lazard.com/media/xemfey0k/lazards-lcoeplus-june-2024-_vf.pdf
Tomas Kalisz: I do not think [batteries] as an economically feasible means for seasonal / large-scale electricity storage means for seasonal / large-scale electricity storage.
Again you are locked in the binary “all or nothing” thinking – assuming that storage has to do ALL (account for ALL daily and seasonal periods when demand exceeds demand). In reality it is second-to-last resort (the last one being starting up the quick-ramp-up gas turbines). I have explained
this several times before but either you missed it or dismissed it as contrary to you a-priori “anything but the mitigation of GHGs” conclusions.
See for instance – mid-Nov 2024: where to zebras 3 points
1. Reduce energy demand.
2. Establish a very smart grid system, so that demand can be further limited to essential functions if conditions warrant.
3. Establish localized backup fuel-based generators (hence my “the quick-ramp-up gas turbines”)
I have added 5 mine:
4. have interconnected systems – if the wind doesn’t blow in England, it might be blowing hard in Scotland or France, or Spain may have more solar than it needs ^*
5. overbuild, if you double installed power, then running it at 50% is equivalent of running non-doubled system at 1oo%. When the supply exceeds demand – use it for time-non-sensitive application – like making ammonia, preferably to displace electricity needed to make it during higher demand/lower supply periods, or less energy effective – as a transportable form of green hydrogen.
6. energy storage – centralized and dispersed – electric F-150 pickup truck is advertised as able, in emergency, to run the electricity for your house for 3 days, also old EV batteries can be used for energy storage after they no longer keep high enough % charge to keep them on the road
7. “virtual storage” – running hydro when high demand, letting the water behind the dam rise when demand drops. = the same effect as pumped storage, without the cost of pumping
8, use a combination of the above (and other not listed here) solutions – since they are likely to have different temporal characteristics (if the sun does not shine, the wind may be blowing, if it does not blow in UK it may be blowing in France) and as such complement each other (“You complete me!”) so the mix of solutions would more resilient than their sum, or in a military parlance – using “force multiplier”
============================ end of quote ===========
So the storage need to be only a tiny fraction of the electricity generated by wind or solar. And the batteries are only a fraction storage technologies. So they would be needed in the isolated grids and a few girds with large spikes in time-inflexible demand and none of the 8 responses listed above sufficient.
But that’s a typical tactic of the deniers – make the demand for storage astronomically high – so you can throw the baby with the bathwater – claim storage will never be financially feasible – and therefore we should stick to oil and gas (and therefore support Russia’s ability to wage wars).
=======
^* That some grids – like that in Texas – are poorly connected to other grids – is just Texas energy producers lobby trying to keep out the outside competitors. For the same, financial reasons – they generation wasn’t winterized – hence barely escaping massive damage to the electric system after a few days of unusually cold weather.
In Re to Kevin McKinney, 24 Jan 2025 at 3:19 PM,
https://www.realclimate.org/index.php/archives/2025/01/2024-hindsight/#comment-829440
and Piotr, 24 Jan 2025 at 8:41 PM,
https://www.realclimate.org/index.php/archives/2025/01/2024-hindsight/#comment-829451
Sirs,
The only purpose of my post was showing that batteries are not suitable for large-scale seasonal electricity storage, and that economy of cost can hardly change it. I do not oppose that batteries may have a good commercial prospect in electrical vehicles or in storage for a short-term use (up to a few hours), wherein their high costs will amortize during several years thank to high number of loading-discharge cycles.
Thank you, Kevin, for provided information resources. I think that especially the battery market forecast shows that no other use is foreseen for batteries up to 2030. 4 hour storage is, however, insufficient for enabling full transition from classical electricity sources to intermittent renewables. If annual electricity consumption in Germany is about 600 TWh and duration of a usual “Dunkelflaute” with a negligible electricity production from renewables is 10 days, you may need at least 20 TWh reserve. That is why Germany with its almost 50% of renewables in their annual electricity production needs keeping coal and gas-fires power plants, subsidize their owners for idling, and rely on electricity imports from other EU countries with negligible share of renewables as a backup.
Piotr, I agree that there are other technically mature and commercially available electricity storage technologies. None of them, however, is economically feasible as a backup for an EU-wide replacement of classical electricity sources with renewables. It appears that the only difference between us is that you think this obstacle can be overcome by subsidies, and I do not believe that this way is societally and politically feasible.
Best regards
Tomáš
Tomas Kalisz Piotr, I agree that there are other technically mature and commercially available electricity storage technologies. None of them, however, is economically feasible as a backup for an EU-wide replacement of classical electricity sources with renewables.
Huh? The 8 points you are supposedly referring to – indicate the VERY OPPOSITE to your unsupported with any falsifiable arguments claim.
And isn’t this ironic that of all people it is YOU who proclaims on “ economical unfeasibility “? You do remember your Sahara scheme in which you DISMISSED the falsifiable estimates of the costs of YOUR scheme (“10s of TRILLIONS of $ annually, for 100s of 1000s of years for a fraction of 0.3K reduction in AGW”) with:
TK: I cannot confirm how accurate [these] quantitative estimations of the economical feasibility are
and as reason you gave that you never thought that money was an important consideration:
TK: “ I have never analyzed [your own proposal’s] technical and economical feasibility.”
In other words – first you dismissed the CALCULATIONS of the astronomical costs of YOUR denier’s proposal as not important to you, and now you dismiss the ALTERNATIVE to your scheme by simply …. DECLARING, without any proof, that it is “NOT economically feasible”?
Could you be more intellectually dishonest?
In Re to Piotr, 26 Jan 2025 at 12:50 PM,
https://www.realclimate.org/index.php/archives/2025/01/2024-hindsight/#comment-829534
Hallo Piotr,
I think if the energy storage methods, building renewables overcapacity and/or fossil fuel fired reserve sources according to your list could make the complete replacement of classical electricity sources with renewables economically favourable, a spontaneous transition towards renewables would be already full steam running.
As regards my Sahara watering scheme, I would like to remind you that its purpose was merely showing that artificial interventions into land hydrology can have glovbal effects on climate.
Greetings
Tomáš
TK: Piotr, I agree that there are other technically mature and commercially available electricity storage technologies. None of them, however, is economically feasible as a backup for an EU-wide replacement of classical electricity sources with renewables.
BPL: Pumped hydro has existed since the 1930s. Here are half a million potential building sites, in addition to the 100 or so GWe of existing plants:
https://energy.cornell.edu/news/anu-finds-530000-potential-pumped-hydro-sites-worldwide
Tomas Kalisz I think if [the 8 different ways to reduce the demand for battery storage] could make the complete replacement of classical electricity sources with renewables economically favourable, a spontaneous transition towards renewables would be already full steam running.
Because as the history teaches us – the superior technology spontaneously wins against entrenched inferior older technology that is a source of trillions of dollars in profits to the oligarchs controlling the politicians, and to the entire petro-states in which the survival of their regimes and ability to wage wars on others – DEPENDS on the world continuing to use that inferior technology.
And your concern about “economically favourability” – rather …. touching from
somebody who proposed converting Sahara into a swamp – and when I pointed at the massive technical problems and astronomic economic costs ($ trillions a year for 100s of years for a fraction of 0.3K reduction in AGW) – you “couldn’t say” whether my estimates of the costs were reasonable, because you never ….. bothered to look at economic costs of the massive geoengineering scheme you were advancing for a year(?) here.
And now – your entire criticism of the alternatives to your absurd proposal – are based on their supposed “economical unfavourability” ???
In Re to Piotr, 31 Jan 2025 at 9:30 PM,
https://www.realclimate.org/index.php/archives/2025/01/2024-hindsight/#comment-829781
Hallo Piotr,
I would like to remind you that I discussed the “Sahara irrigation” when I strived to show that such a massive regional change in land hydrology may have a measurable influence on global climate, whereas the present discussion is about relevance of key technical parameters of electricity storage, such as efficiency and volume energy density, for economical feasibility of the desired complete transition of electricity production to renewable energy sources.
I think that in this respect, it may be understandable why I desisted from any economic analysis in the first case, while I keep insisting that economy can be crucial for a success of the discussed transition towards renewable energy sources.
Greetings
Tomáš
TK: I think if the energy storage methods, building renewables overcapacity and/or fossil fuel fired reserve sources according to your list could make the complete replacement of classical electricity sources with renewables economically favourable, a spontaneous transition towards renewables would be already full steam running.
BPL: It sort of is already, though not as fast as I would like.
In Re to Barton Paul Levenson, 27 Jan 2025 at 12:57 PM,
https://www.realclimate.org/index.php/archives/2025/01/2024-hindsight/#comment-829582
and 27 Jan 2025 at 12:55 PM,
https://www.realclimate.org/index.php/archives/2025/01/2024-hindsight/#comment-829581
Hallo Barton Paul,
Thank you for your feedback.
You are certainly aware that in a typical pumped hydro facility, volume energy density of electricity storage is a fraction of its typical value in state-of-art batteries. In pumped hydro, this disadvantage is compensated by low cost of the storage medium (water), so that the investments depend mostly on costs of the necessary “vessel”.
The result is, however, comparable, although still in favour of pumped hydro. The biggest Czech pumped hydro facility Dlouhé Stráně,
https://cs.wikipedia.org/wiki/P%C5%99e%C4%8Derp%C3%A1vac%C3%AD_vodn%C3%AD_elektr%C3%A1rna_Dlouh%C3%A9_str%C3%A1n%C4%9B
https://www.dlouhe-strane.cz/
can deliver 650 MW electrical power for almost 6 hours. The investment for 3.7 GWh storage capacity was about 0.3 bln USD – in other words, 1 kWh of storage capacity was built for 81 USD.
With available energy storage technology, the share of overall electricity production that can be covered by renewable energy sources without a substantial penalty over classical electricity generation and supply is somewhere between 10-50% for various countries. For a bigger share, the costs rise sharply.
Greetings
Tomáš
Yes, that transition is indeed “full steam running”–though not currently (no pun intended, there) in the US.
Fun fact: growth in renewables in the developing world is now happening at a more rapid clip than in the developed world, per RMI:
https://rmi.org/insight/powering-up-the-global-south/
For more on how it’s going:
https://www.iea.org/reports/renewables-2024/executive-summary
IEA expects to see an increase of 2.7x by 2030–although as BPL says, that not as fast as we’d like; the goal was a clean tripling. Could still happen, but Trump won’t help, and that’s an understatement.
In Re to Kevin McKinney, 28 Jan 2025 at 12:33 PM,
https://www.realclimate.org/index.php/archives/2025/01/2024-hindsight/#comment-829633
Hallo Kevin,
As I wrote in my reply of 28 Jan 2025 at 5:50 AM to Barton Paul, replacement of a certain share of classical energy sources in electricity production is a relatively “low hanging fruit”, because it does not need much of expensive new infrastructure (transmission, storage). I think this is the process now running in the USA, and I am happy about it.
The full replacement of classical electricity sources with renewables, or even a compl,ete economy transition from classissical energy sources to renewable energy are completely different disciplines. I strived to show that it is much more challenging, hardly manageable with technical means that are currently commercially available.
I am going to write a little bit more in my foreseen reply to b fagan’s post of 27 Jan 2025 at 8:36 PM,
https://www.realclimate.org/index.php/archives/2025/01/2024-hindsight/#comment-829596
because I think it requires a detailed explanation.
Greetings
Tomáš
Re: “On the other hand, I strongly doubt that this goal can be achieved by any kind of batteries:
Although energy densities in best electrochemically active storage materials may be as high as several kWh/kg, these materials do usually form only a few per cent of the entire battery mass.”
You disregard flow batteries, which topped a recent Department of Energy list of long-term energy storage systems. “Flow batteries have the best rate between costs and performance according to today’s technological status, as low as $0.06/kWh, which is close to DOE’s $0.05/kWh target. Lithium-ion batteries hold the second place with $0.07/kWh, followed by zinc battery varieties, e.g. ZnMnO2, with $0.08/kWh and the first ever rechargeable battery, the lead-acid battery with $0.09/kWh.”
https://www.bestmag.co.uk/flow-batteries-top-does-long-duration-energy-storage-cost-comparison/
And Form Energy has built a factory in West Virginia to build iron-air batteries that use rusting/unrusting of iron as the energy storage. Since it is designed for grid systems, the density is unimportant as the devices will not power a smartwatch or a car. Load a bunch onto flatcars, truck them to the site and put them down.
They’ve broken ground on a very small system in Great River Energy in Minnesota, which will then evaluate the system. They’ve also announced an 85MW/100-hour battery for up in Maine, where their fossil constraints put winter heating at risk.
https://www.utilitydive.com/news/iron-air-battery-developer-long-duration-storage-form-energy-collaboration-ge-vernova/730633/
https://www.canarymedia.com/articles/long-duration-energy-storage/form-energy-set-to-build-worlds-biggest-battery-in-maine
The design point of the battery is to allow long-term storage of energy, which would then support a 100-hour discharge cycle. Their original target, I think, was 150 hours, based on the idea of maximum cloudy, cold, wind-free spells in Minnesota, but as others have pointed out, the US/Canada/Mexico grid, with appropriate transmission links to allow bulk power transmission, means that no region needs to provide itself a full season of stored electricity.
There’s already a very large HVDC line that connects the Columbia River’s hydro generation to Los Angeles – the Pacific Intertie, and that’s been operating since the 1970s. And recent studies found that the existing US transmission network could gain a 40% boost in capacity by replacing the existing conductor cables with newer, more efficient ones.
There’s no natural replacement of major players in the grid given the regulatory capture by some industries, and by the fact that capital investment in newer technologies (iron/air actually being old) is not taken up by industry spontaneously. But the investments are driving the costs of wind, solar, storage and more responsive power electronics all down – so the change isn’t coming quickly enough, but it’s coming.
If we could get more of the fracking drillers to focus on new approaches to geothermal, storage would become an even smaller requirement, but in the meantime, as EV batteries age off of vehicular use, they’ll have years more time on the grid before recycling.
https://www.canarymedia.com/articles/long-duration-energy-storage/the-biggest-grid-storage-project-using-old-batteries-is-online-in-texas
in Re to b fagan, 27 Jan 2025 at 8:36 PM,
https://www.realclimate.org/index.php/archives/2025/01/2024-hindsight/#comment-829596
Sir,
Thank you for your feedback and useful references, and apologies for a delayed reply.
I no way disregard redox-flow batteries, however, their volumetric energy density is, due to dilution of the electrochemically active medium with a solvent (which is necessary to enable the flow), in the same range as in pumped hydro facilities. Please note in this respect that the numeric values used in the cited report
https://www.energy.gov/sites/default/files/2024-08/Achieving%20the%20Promise%20of%20Low-Cost%20Long%20Duration%20Energy%20Storage_FINAL_08052024.pdf
for comparison of various storage technologies are LCOS, defined in note f on page iii of the report as
“The levelized cost of storage (LCOS) ($/kWh) metric compares the true cost of owning and operating various storage
assets. LCOS is the average price a unit of energy output would need to be sold at to cover all project costs (e.g.,
taxes, financing, operations and maintenance, and the cost to charge the storage system). See DOE’s 2022 Grid Energy
Storage Technology Cost and Performance Assessment (https://www.energy.gov/sites/default/files/2022-09/2022 Grid
Energy Storage Technology Cost and Performance Assessment.pdf).”
Accordingly, the costs for 1 kWh of storage capacity is also comparable. For the New England redox-flow battery with 8.5 GWh capacity (capable of 100 h grid supply with 85 MW power)
https://www.canarymedia.com/articles/long-duration-energy-storage/form-energy-set-to-build-worlds-biggest-battery-in-maine ,
it seems that the DOE granted 393 million USD support:
https://www.canarymedia.com/articles/transmission/new-england-grid-gets-389m-boost-to-help-plug-in-offshore-wind
If so, it does mean that corresponding costs for 1 kWh of the installed storage capacity will be 46 USD, provided that the entire investment is covered by this support and no further money will be required.
In other words, there is a progress in building electricity production from renewable sources, but I am afraid that this progress is slow just because it is somehow believed that subsidies for already commercially available electricity transmission and storage technologies are all we need to progress towards a successful replacement of classical energy sources with renewables, while this assumption is in fact economically unfeasible.
Greetings
Tomáš
Donald Condliffe “ there is a vanishingly tiny chance of avoiding a rapid transition to a world that is ten degrees C warmer than pre industrial. This is the result [….] by Hansen based on multiple papers in the past decade.”
Could you give the reference to that Hansen’s paper where he predicts +10C warming? What CO2 he anticipates and when – next century, 10,000 yrs from now?
“Immediate and unprecedented action is required to address Earth’s energy imbalance and halt further degradation of natural climate buffers. And yet nothing is being said, nothing is happening.”
The reason is very clear. Transportation fuels are required to take any action. Eight billion stakeholders need food and all of the materials required to complete the transition phase-in of renewables and Evs. That means more oil will be needed and not less during the lengthy phase-out.
KT: Transportation fuels are required to take any action. Eight billion stakeholders need food and all of the materials required to complete the transition phase-in of renewables and Evs. That means more oil will be needed and not less during the lengthy phase-out.
BPL: We also need to replace transportation fuels with renewables. This is happening, though not fast enough yet. You seem to feel there is some huge minimum amount of fossil fuels necessary to transition to renewables. But the faster we transition, the less fossil fuel needed.
Exactly right. Ken’s assertion is not, as far as I can tell, self-coherent.
KT: That means more oil will be needed and not less during the lengthy phase-out.
BPL: How many times are you going to post this?
You’re several decades out of date. (Jimmy Carter’s solar panels and Reagan’s removal come to mind as a marker of when work was ready to begin.) We’re in real trouble and pretending we have time is unhelpful at best.
Jimmy Carter’s solar panels ?
They were old tech 1970s solar hot water units, not “solar PV panels’.
The forgotten story of Jimmy Carter’s White House solar panels: More than four decades ago, President Carter said the U.S. could harness “the power of the sun to enrich our lives as we move away from our crippling dependence on foreign oil.” – https://yaleclimateconnections.org/2023/02/the-forgotten-story-of-jimmy-carters-white-house-solar-panels/ “The panels were primitive but serviceable. They heated water. They cost about $28,000 to install. According to the person who convinced Carter to put up the panels, George Szego, who died in 2008 at 88, they were models of industry. They cranked out hot water “a mile a minute,” he said.”
Where Did the Carter White House’s Solar Panels Go? One of the 32 solar-thermal panels that captured energy on the roof of the White House more than 30 years ago landed this week at a science museum in China – https://www.scientificamerican.com/article/carter-white-house-solar-panel-array/
Technically, your quibble is valid. In principle, you are wrong. BTW, ‘solar panels’ are not necessarily ‘solar PV panels’. We see way too much busyness which all too often is directed at changing the subject or undermining the basic thesis of RealClimate itself.
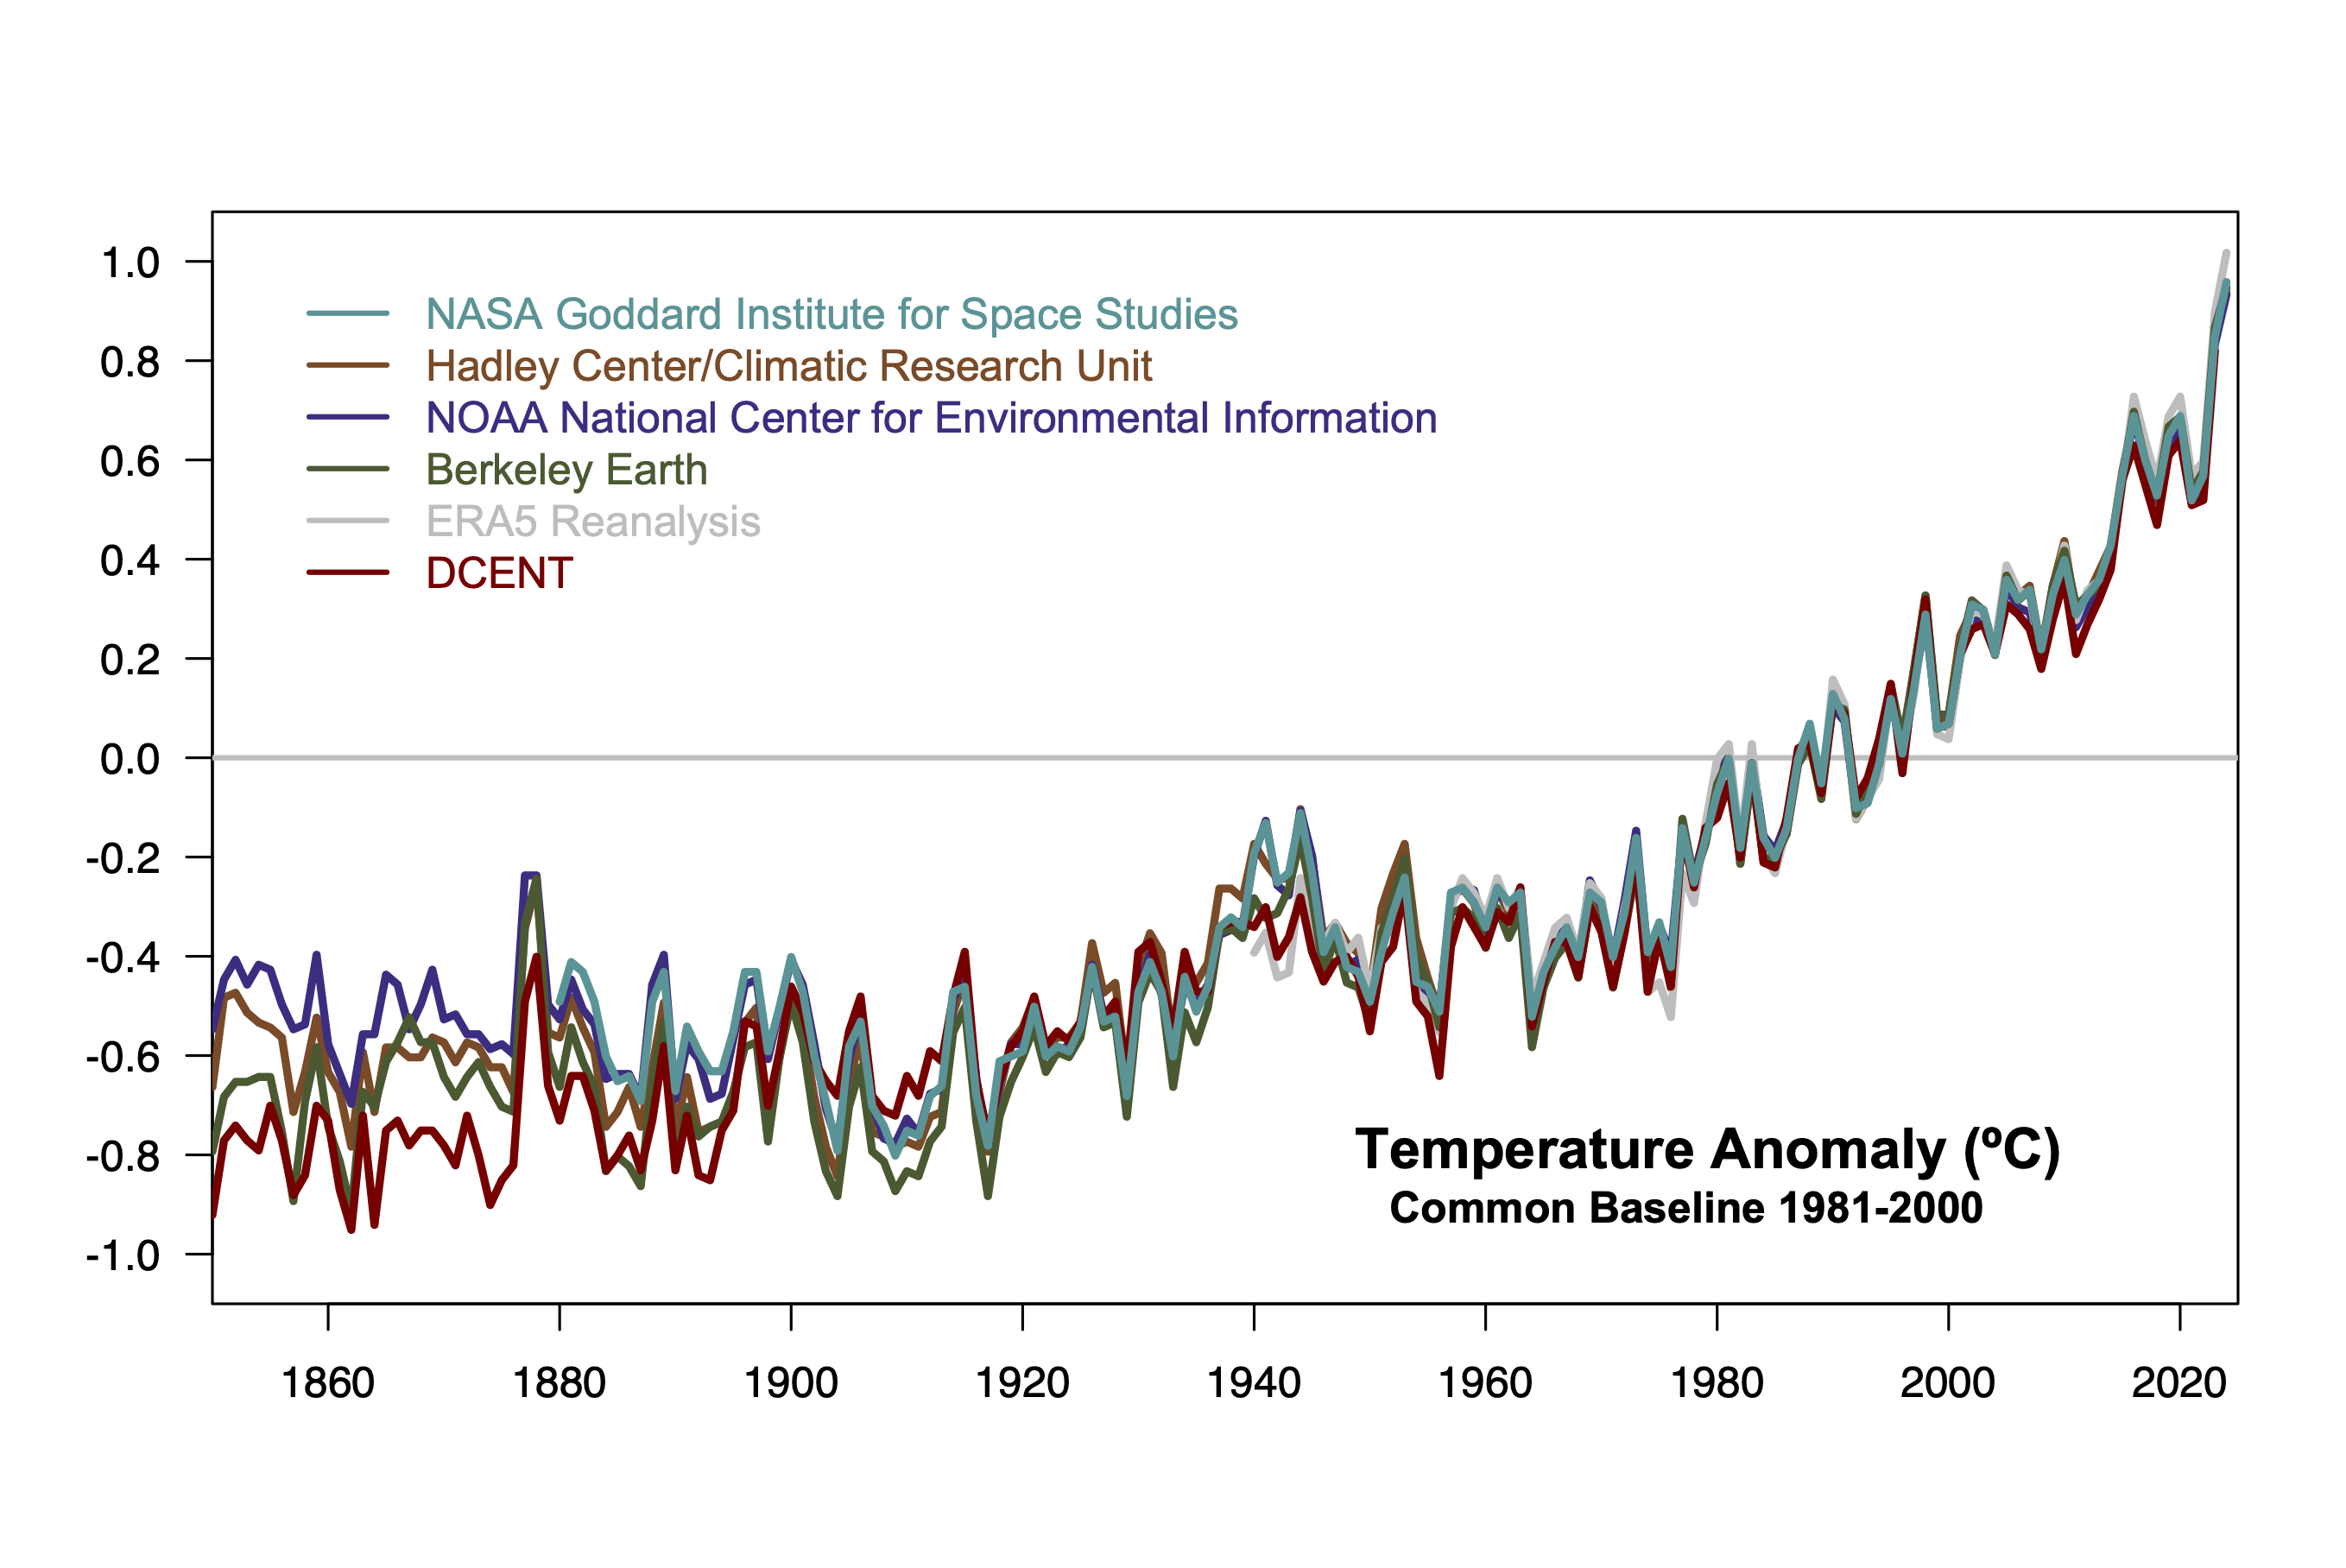
Mammon, just to amplify a point made by Piotr,… You stated, “Please note Gavin’s graph does not even show Temps breaking the +1.5C anomaly line in 2025.” What you are evidently looking at is just the first graph that aligns all of the temperature anomaly trends produced by different organizations relative to the period 1981-2000, a recent period where we have had sufficient instrumentation to accurately estimate temperature anomalies, albeit for the purpose of that chart, relative that period. Once adjusted in this manner the trendlines appear to be in close agreement from mid-20th century forward.
However, for the purpose of estimating the effects of industrial climate disruption on the global average we need to compare temperature anomalies against a preindustrial era. As such the second chart employs an offset so that we are essentially comparing temperatures against a “preindustrial baseline” of 1850 – 1900, a longer period of time which may in part have been picked to reduce the uncertainty of its average that otherwise results from there being fewer representative datapoints and more uncertainty in their values.
The offset shifts the aligned trendlines up to where the average temperature anomaly for last year is 1.54 ± 0.07 °C. This puts last year’s average temperature on the warm side of 1.5 °C, albeit still within the range of uncertainty. Although largely of only symbolic importance, more likely than not 2024 is the first year of the modern era above the 1.5 °C anomaly threshold.
Either way, it seems we are at the dreaded 1.5C ‘guardrail’, and poised to crash through it–if indeed we haven’t already done so–no? I know that some would say, probably correctly from a technical point of view, that you can’t really make such a call based on a couple of years. But honestly, how much of a decline are we likely to see in 2025, and how long is it likely to be before we once again exceed 1.5C? At the very least, as, IIRC, Ralph Keeling wrote about the 400 ppm milestone, we would seem to be experiencing the first ‘flickers’ of a post-1.5C reality.
Gavin says: – but the influence of IPCC AR6 is too strong to fight against. So, while I’ve been holding on to ‘late 19th Century’ (in practice 1880-1899) as a baseline, I have bowed to the inevitable and started producing anomalies with respect to the earlier baseline. But that raises a problem –
What a terrible conundrum.
I must agree though, the the influence of IPCC AR6 is too strong to fight against in every respect.
What have you done with Mr. Chen, Mr. Mammon ???
Can someone provide link to an updated temperature time series plot at what Wikipedia reports to be worlds longest running meteorological station with mention of no urban heat island effect? Plot at Wikipedia looks to end before 2010:
https://en.m.wikipedia.org/wiki/Hohenpei%C3%9Fenberg_Meteorological_Observatory
This record begins in 1781 and provides a visual of temperatures (aka kinetic energy of molecules) for decades before the 1850-1900 pre-industrial baseline.
p: This record begins in 1781 and provides a visual of temperatures (aka kinetic energy of molecules) for decades before the 1850-1900 pre-industrial baseline.
BPL: It’s a record of temperatures in one place, and therefore highly unlikely to be representative.
The figure in blog post is based on data from an increasing number of places. It totally lacks accompanying maps that depict temporal evolution of the point data used in its development. Early input data is representative of small regions of the globe. The is no spatial standardization in the data being represented for the time series.
Response: Total nonsense – go to the GISTEMP site and look at the spatial trends. – Gavin
https://data.giss.nasa.gov/gistemp/maps/
-suggest GISTEMP add option to toggle on/off the locations of temperature measurements for map outputs. This allows the observer to scrutinize the broad brush stokes of the spatial interpolation.
1) GISTEMP shows a high temperature anomaly for the Arctic region – a concern due to the threat of melting permafrost becoming a tipping point,
2) I had wondered what was the data basis for this since Canada’s Northwest Territories/Nunavut had very sparse populations up to 1940 (e.g 9000 in 1931). Their surface area is 1.2 million square miles, most of the European population was collected into small towns and I would think few natives would have been reading thermometers while hunting.
3) That also seems to be indicated by the GISTEMP globe showing data sources:
https://data.giss.nasa.gov/gistemp/station_data_v4_globe/
Looking are areas north of 60 deg latitude in the above Canadian Provinces, in Alaska and In Siberia east of 68 deg East Longitude:
a) 1880-1890: 0 , 0 in Alaska , 0 in Siberia
b) 1890-1900: 0, 1 in Alaska, 2 in Siberia
c) 1900-1910: 5, 6, 5
d) 1910-1920: 6, 12, 9 (All between 60 and 70 deg N Latitude)
e) 1920-1930: 8, 14, 11 ( only 1 station –in Russia –above 70 deg Lat )
4) Also, what was the instrument measurement uncertainty in that time frame –given the expansion and contraction of the Arctic extreme temperature swings?
5) My understanding (which may be wrong) is that Lenssen et al developed an estimate of GISTEMP uncertainty in a 2024 report:
https://d197for5662m48.cloudfront.net/documents/publicationstatus/211267/preprint_pdf/cbbc7d22b3e1e33f3133f5093e4c4a09.pdf (Figure 9 )
However, Figure 9’s estimate for temperature anomaly in the NH Polar region (64-90 deg N) for the period 1880-1930 seems much less than I would have expected. Note, e.g, the SH Polar uncertainty even up to the present day. How was Lanssen able to reduce NH Polar uncertainty to this level?
Also, the vast empty areas of northern Canada and Siberia is split up by Lanssen between NH Polar region (64-90 degrees latitude) and NH Mid-Lat (44-64 deg). However, while there were a lot of stations down around 44 deg, there were few at 60-64 deg. Did 44 deg data really represent the uncertainty in data for 60-64 deg latitude? Most of the polar data seems to be based on stations in coastal areas of Greenland, Iceland and Norway plus some being added in western Russia as time progressed.
I think this series of measurements from this station is representative of the entire region. If you read the data from the green curve, smoothed over 30 years, from the graph, you can see a very close correlation with the global temperature: temperatures rose by around 1.7 °C from 1880 to around 2000.
What is surprising, however, is that temperatures fell by around 0.8 °C from 1780 to 1880 and rose by around 0.8 °C from 1880 to 1980. It was only in 1980 that temperatures here rose above a previously measured level, by around 0.9 °C. This also corresponds to the fact that the current global warming only began around 1980.
The Hohenpeisenberg record is updated in CRUTEM5 to 2024. Because CRUTEM5 only begins in 1850, our datafile and plot only run from 1850 to present, but you can combine it with the wikipedia plot to see that recent decades exceed the warmth in the early part of this record.
The annual plot is here:
https://crudata.uea.ac.uk/cru/data/crutem/ge/crutem5-2024-12/N47.5E012.5/109620_ann.png
The data are here:
https://crudata.uea.ac.uk/cru/data/crutem/ge/crutem5-2024-12/N47.5E012.5/109620_data.txt
You can access this and all other stations used in CRUTEM5 via google earth — just google ‘CRUTEM5 google earth’ to find the page where you can access it.
This has the data to 2024 https://en.wikipedia.org/wiki/Hohenpeißenberg_Meteorological_Observatory
I do not know why en.wikipedia.org is different than en.m.wikipedia.org
Thank you for alternative wikipedia plot. I observe a “swing” towards warmer temps prior to the 1850. The updated dataset plot of annual temp by CRU to 2024 shows temp exceeding the Hohenpeisenberg spike between 1810 and 1820. The full Hohenpeisenberg temp time series to my eyes show what can be interpreted as a cyclic pattern (rise-fall-rise). The plot is also evidence to suggest that ‘post industrial’ warming research investigate factors beyond the obvious. I appreciate the climate research community is active with the current “cottage industry” to explain the last few years “extremes”.
Rise-fall-rise is what spikes do, whether they’re “cyclic” or not.
“Ce qu’il faut faire”, c’est avant tout que la vérité sur le climat soit dite, que TOUS les avis scientifiques soient pris en compte, et pas uniquement les avis alarmistes-carbocentristes, des milliers de scientifiques ne sont pas d’accord avec les thèses du GIEC et les avis comme celui de Monsieur Gavin.
Il faut pouvoir expliquer clairement, dans le détail, comment et par quels procédés une trace anthropique de CO2, (principalement évoquée), peut contribuer à l’augmentation de la température moyenne globale et être le “bouton de commande du climat mondial”. Il faut aussi, entre autres, montrer une formule qui permettrait de donner la température à partir de la concentration en CO2, et arrêter de dire que “l’effet de serre est bien connu, sur des principes scientifiques bien établis”, en prenant comme référence des chercheurs du XIXe siècle, comme Fourier, Tyndall ou Arrhenius, qui eux, n’ont JAMAIS évoqué le terme “effet de serre” ! Et en parlant de ce dernier, il serait plus correct de dire “effet thermique atmosphérique”, car même s’il peut y avoir quelques similitudes, l’atmosphère n’est pas une serre en verre ou en plastique, et ce qui s’y passe est bien plus complexe que ce qui se passe dans une serre.
J-DD: que TOUS les avis scientifiques soient pris en compte
BPL: Ne confondez pas les opinions scientifiques avec la pseudoscience. Lorsque les astronomes tiennent une conférence, ils n’invitent pas de géocentristes ou de partisans de la Terre plate.
“(See https://ourworldindata.org/emissions-by-fuel for a great chart of CO2 sources over time and not the Arrhenius paper falls to the LEFT of 1900.” should read:
(See https://ourworldindata.org/emissions-by-fuel for a great chart of CO2 sources over time and note the Arrhenius paper falls to the LEFT of 1900.)
Cela fait très “réponse automatique” issue du livre du “Parfait carbocentriste”, je préfèrerais des arguments plus convaincants que des allusions faciles.. Un exemple au passage, en plus de ma question précédente : dans l’AR6 WGI -SPM A.1.1. il est écrit : “La croissance du CO2 dans l’atmosphère serait “sans équivoque” la conséquence des émissions de CO2 dues à l’homme. Niveau de confiance élevé”. Si cette affirmation était correcte, on devrait observer une excellente corrélation entre les deux séries de données : émissions anthropiques (cause selon le GIEC) et croissance du CO2 atmosphérique (la conséquence selon le GIEC). Or, et assez étrangement pour un rapport qui se veut scientifique et complet, AUCUNE COMPARAISON entre ces deux séries n’a été développée dans les 2400 pages de ce dernier rapport du GIEC ! Parmi les 459 figures du rapport “scientifique”, on peut s’étonner de trouver UNE SEULE FIGURE (FAQ 5.1 Figure 1) rapprochant les deux séries d’observations modernes. Et “hélas”, un filtrage/lissage (“the five years running mean”) dénature cette unique figure : les tendances restent visibles, mais la variabilité est masquée. C’est quoi, “oubli” des rédacteurs, ou volonté de tromper le public et le lecteur “lambda” ?
Forgive my non-French.
Actually Arrhenius DID predict global warming _could_ happen if enough coal and other “atmospheric carbonic acid” producing fuels were burned, he just didn’t think civilization could burn that much when he wrote the paper. See discussion at the top of p. 270 of the original paper. He reports coal use of 5×10^8 tonnes/yr at that time where it is 9×10^9 tonnes/yr these days, And of course liquid and gas fossil fuels weren’t really around in quantity yet either and contribute in aggregate even more than coal. (See https://ourworldindata.org/emissions-by-fuel for a great chart of CO2 sources over time and not the Arrhenius paper falls to the LEFT of 1900.
THAT is why Arrhenius had no reason to predict anthropogenic global warming. His models could handle it, he just didn’t see the 20th Century coming.
I completely agree with you that we are facing a climate crisis and as the Los Angeles catastrophe is showing we as a society are not remotely prepared. I have recorded the local weather in my part of Canberra Australia for 33 years. The occurrence of above average temperatures has increased markedly in the last decade. We have less frost days than 30 years ago which is affecting our fruit trees which need frost days to produce a good crop. Last year a very late severe frost wiped out our peaches, apples and apricot crops and impacted citrus and figs too. The weather is far more changeable these days with extreme rain events quickly followed by snap droughts. We have seen flooding rains in Queensland while the rest of the country is experiencing heatwave and drought!
When are policy makers going to wake up and act or will we see repeats of Barcelona floods or Los Angeles bush fires the like of which has never been recommended before?
Gavin O’Brien FRMetS
Gavin O’B
I have no idea where you live so I cannot be specific, but a statement like “The weather is far more changeable these days” is very anecdotal, but easy to verify.
Just go to http://www.bom.gov.au/climate/data/ and find the nearest long term station, download the data for all years and do a simple 60 day running standard deviation on the min or max temp. Is there a trend to higher standard deviations? I have done this before for about 20 sites in Australia and there has mostly been a very small reduction. I have just looked at a couple of Queensland sites with > 70 year records, Townsville has a small decrease and Amberly has an equally small increase.
Let’s see, you propose to statistically examine a time series for significant changes in the variation parameter with a sliding 60 day window over decades of time in order to “prove” variability has, or has not, changed over time??? Talk about autocorrelation to the 60th power!!!
Run that idea by any statistician friend…should you have one. If they like you for the beers you buy, they may not at least call you foolish. Sliding windows can be analyzed with proper techniques and do have uses especially as FILTERS for variability. Your notion simply isn’t one of them.
Now _tumbling_ windows, on the other hand might be of use given an interval more suited to climate variables (say of 3-5 years/window minimum…I’ll leave the exact best interval to define to actual climate experts, though) rather than weather variables. But absolutely not at short 60 day intervals and absolutely not without seasonal and other adjustments if your windows are so small. Sliding _count_ windows at proper, large enough counts of events would be even a better idea to study changes in variation over decades as the counts of specific events per unit time are the actual thing of interest here, after all. With a long enough defined count cutoff, adjustments might not even be necessary. Finally, _hopping_ windows would be better than sliding windows, at least, but would be quite complex both to analyze and to explain.
Showing honestly the things of value in the data is actually pretty hard even for experts. However, as we have seen here through many, many years of posting cherry-picked, out-of-context factoids–as you do here–showing propaganda is comparatively quite easy for denial types. All it takes is simple ignorance or simple evil or both.
To try to put it more clearly (this ain’t all that easy sort of stuff): Why exactly would you expect to see significant changes in the variability of temperatures over time after employing a 60 day filter ON that variability?
Do notice BTW–I did–that the OP was speaking of a _# of specific events/season_ NOT filtered out with your 60 day filter. So it kinda’ looks that unlike you OP has some notion of NOT filtering out variation before–surprisingly!–asserting there is none.)
I have no earthly idea what a competent analysis would show in Canberra in particular WRT climate changes. But I can say counts of defined “extreme events” would be a far more powerful stat to examine than 60-day filtered data if the object is to detect, well, er, the counts of extreme events as was the OP’s assertion in the first place–(doh)..
Geoff O’B was looking at changes in weather variability, not climate. The 60 day was chosen for that reason
Weather variability??? Yes. So you go and pick filtered hi temps not corrected for seasonality, ENSO, etc., etc., etc. as your SOLE measure of “weather variability”???! Nice try, but patently ridicullous.
Here are his quotes:
“we have less frost days than 30 years ago” Whoops, fitered.
“The occurrence of above average temperatures has increased markedly” Whoops, Any short term highs filtered unless the highs stay for a significant period in ytour 60 day window.
“We have less frost days than 30 years ago which is affecting our fruit trees” Whoops, filtered unless the frosts last for a couple of weeks enough to shift the averavges.
“Last year a very late severe frost wiped out our peaches, apples and apricot crops and impacted citrus and figs too” Filtered.
“The weather is far more changeable these days with extreme rain events quickly followed by snap droughts. […NOTE: He does NOT assert temperature variability here as you apparently assert…] Not even examined, yet you assert “evidence” when you provide zero.
I have no idea what the actual conditions are on OPs farm, though I suspect OPs checkbook records and harvest records are FAR more telling than your factoids are given your history here. OP may well be mistaken.
HOWEVER, I do know very well that precisely NONE of these are directly and in most cases these are not even indirectly addressed by filtering 60 day intervals of high temps and presenting that factoid as “evidence” of no climate change. Only a complete stats idiot would assert that they do.
Weather variability??? Yes. So you go and pick filtered hi temps not corrected for seasonality, ENSO, etc., etc., etc. as your SOLE measure of “weather variability”???! Nice try, but patently ridiculous.
Here are his quotes:
“we have less frost days than 30 years ago” Whoops, fitered.
“The occurrence of above average temperatures has increased markedly” Whoops, Any short term highs filtered unless the highs stay for a significant period in ytour 60 day window.
“We have less frost days than 30 years ago which is affecting our fruit trees” Whoops, filtered unless the frosts last for a couple of weeks enough to shift the averavges.
“Last year a very late severe frost wiped out our peaches, apples and apricot crops and impacted citrus and figs too” Filtered.
“The weather is far more changeable these days with extreme rain events quickly followed by snap droughts. […NOTE: He does NOT assert temperature variability here as you apparently assert…] Not even examined, yet you assert “evidence” when you provide zero.
I have no idea what the actual conditions are on OPs farm, though I suspect OPs checkbook records and harvest records are FAR more telling than your factoids are given your history here. OP may well be mistaken.
HOWEVER, I do know very well that precisely NONE of these are directly and in most cases these are not even indirectly addressed by filtering 60 day intervals of high temps and presenting that factoid as “evidence” of no climate change. Only a complete stats idiot would assert that they do.
Never.
Really sorry Gavin O/B, I have to apologise for two things.
I have no idea how I missed the fact that you live near Canberra. So I should have just done this myself.
And secondly, you are correct, the minimum temperature (using the 70 year airport data) does show a small increase in variability over that period. The max temp shows a smaller decrease.
Here is the graph of the change in SD over time
https://photos.app.goo.gl/VWxEJJGwkjCsjbYs7
> the time over which the peak temperatures have lasted (17 months or so) is much
> shorter than the peaks around 2016 or 1998 (7 months)
s/shorter/longer/ ?
is there anything you can’t fix with one line of vi?
“The people have spoken, and they have collectively agreed that ‘pre-industrial’ can be thought of as the average of 1850 to 1900.”
What was that average value…and what should be added to that number to obtain the current value? NOAA says that the 20th century average is 13.9°C. 57°F.
About the different behavior of MSU vs. Surface: MSU data usually show a much stronger deviation during El Niño events (especially for strong ones) than surface temperature. A possible reason might be that the heat over the tropical Pacific is spread over a larger area in higher layers (e.g. by the zonal circulation over the tropics and the Hadley cell) than at the surface (just guessing …).
And a second observation concerning El Niño that struck me was the unusual difference between the Nino3.4 index and the MEI index during the recent Niño event: MEI index was only about half of Nino3.4 and started later, while during earlier strong Niños the two indices were very similar. Since the MEI index involves a much larger region and other variables than Nino3.4 this might point out that the larger-scale atmosphere (and ocean) over the Pacific was in a rather unusual state during 2023/2024.
However, this doesn’t give a clearer picture of “what has been (or still) is unusual and why” either … maybe just another piece of the puzzle.
Dear Dr. Schmidt,
As a layman, I had to Google what does the acronym MSU / AMSU actually mean.
Perhaps you could, for the sake of clarity, any time you use such terms that may be unfamiliar for a broader public, add (analogously as did ChatGPT in the comment of 11 Jan 2025 at 7:47 PM above) also a “full text” reading of the acronym.
Or, alternatively, an explanatory link, e.g.
https://www.remss.com/missions/amsu/
Thank you in advance and best regards
Tomáš
Yes, these do seem to be missing from the RealClimate acronym index:
https://www.realclimate.org/index.php/acronym-index/
While we’re at it, here’s the RealClimate index of responses to contrarian arguments:
https://www.realclimate.org/index.php/archives/2004/12/index/#Responses
Both of those links can be found at the bottom of this and other RealClimate pages.
The Start Here page link can be found at the top of RealClimate pages:
https://www.realclimate.org/index.php/archives/2007/05/start-here/
In 1875 an Icelandic volcano named Askja had a wet eruption. What followed was a large temperature spike which, so far, is almost identical to the one following the HT volcano. The similarities cannot be ignored. I can’t find any evidence that this connection has ever been discussed in this forum.
https://localartist.org/media/HTvAkjsa.png
I plan on monitoring any discussion on this, but don’t plan on participating further on this topic. Water vapor injected at low, or high latitudes into the stratosphere is not really an area I’m qualified to discuss. However, I would not be surprised if we return to 2016 temperatures by early 2026 and stay there, or even cool slightly for the next decade.
The 1877/1878 spike was considered to be due to a massive El Nino, and that also appeared as a spike in the AMO time-series ENSO has a characteristic signature, which is a differential reading in the SOI. ENSO is well known to be insensitive to volcanic activities. Perhaps it’s different here
There was discussion about the here in one of the main articles a few months back, and there were updates about the revised data over time. I did find this for you: https://eos.org/research-spotlights/atmospheric-effects-of-hunga-tonga-eruption-lingered-for-years
Although the eruption did affect Earth’s radiative balance briefly, that change was very small: a global decrease in radiative flux of less than 0.25 watt per square meter over the 2-year period before it returned to preeruption levels. (Globally, Earth’s surface, oceans, and atmosphere absorb an average of about 240 watts of solar power per square meter over the course of a year.) This brief change means that Hunga’s eruption may have caused slight cooling in the Southern Hemisphere, but the researchers say it would be challenging to glean that same information from meteorological observations alone. (Journal of Geophysical Research: Atmospheres, https://doi.org/10.1029/2024JD041296, 2024)
Your suggestion of cooling for a decade is nonsense.
However, the cooling effect of a degraded AMOC may have some unexpected effects in northern Europe.
Paul, I’m aware of the unusual El Nino. I think the question is what happens when water vapor is injected into the stratosphere, especially near polar regions. Would reduced upwelling radiation affect El Nino? Here’s a plot with the ENSO for comparison.
https://localartist.org/media/HTvAkjsaENSO.png
Susan, sorry if I implied that a decade of cooling was due to a wet volcano. I have other reasons to make that prediction. Let’s see if the current spike is a spike and not a step. I can always be proven wrong, but unfortunately, never right — even if my predictions (not projections) are correct.
Er, except it clearly does, if you are talking about the second one shown–the one with the 1981-2010 offset. And if the helpful dotted 1.5C line isn’t enough, then you have the accompanying text which says, “The value for 2024 in this graph is then 1.54±0.07ºC.”
In hindsight, it appears that Edgar saved countless lives:
https://localnewspasadena.com/2025/how-two-words-from-a-24-year-old-pasadena-climate-specialist-saved-hundreds-of-lives/
Thanks E McG
Some surprising (at least to me) comments above.
Noam Chomsky Reveals How Much Time Is Left Until the End of Organized Humanity–and Climate Catastrophes by Wise Daily Reflections — https://www.youtube.com/watch?v=nphuPGERejQ
In this video, Noam Chomsky, now in his 90’s, explores the deep causes of the global crisis, analyzing the role of political and economic institutions and offering concrete solutions to address humanity’s uncertain future.
MY RECAP of the Key Points from Chomsky’s Ideas on the Looming End of Society and Civilization:
A Profoundly Sick Society:
Chomsky’s reflections align with Jiddu Krishnamurti’s quote: “It is no sign of health to be well-adjusted to a profoundly sick society.”
He emphasizes that humanity’s current choices determine not only the future of coming generations but also the survival of organized humanity itself.
The Climate Crisis and Institutional Failures:
Chomsky identifies the climate crisis as one of the greatest emergencies in human history.
He highlights the role of political and economic systems in perpetuating environmental degradation, specifically blaming fossil fuel lobbies for spreading disinformation and influencing policy to prioritize profits over sustainability.
Institutions like NATO are criticized for protecting oil and gas infrastructure rather than addressing the environmental harm caused by the energy industry.
Moral Divide in Human Progress:
Chomsky warns of a significant moral divide: while humanity has achieved extraordinary technological progress, it has failed to develop the ethical responsibility to govern it.
The nuclear age exemplifies this gap, demonstrating humanity’s power to destroy itself without the collective wisdom to prevent catastrophic outcomes.
This moral failing extends to ecological destruction, where short-term profit motives drive humanity closer to environmental collapse.
Systemic and Ethical Challenges:
Chomsky argues that the root causes of these crises are not merely technical but deeply embedded in the social and economic structures of modern society.
Decisions are often shaped by political and corporate interests, ignoring long-term consequences for the planet and humanity.
Humanity at a Crossroads:
Humanity faces a critical choice: continue on the path of self-destruction or adopt a new awareness centered on sustainability and collective well-being.
This involves a radical shift in priorities, rejecting the dominant economic model that prioritizes short-term gains.
Proposed Solutions:
Transform fossil fuel companies into public utilities, redirecting their influence and resources toward sustainable solutions.
Advocate for public ownership of environmentally destructive industries to align their operations with the common good.
Promote the ethical use of technology, emphasizing its potential to solve global problems if guided by moral responsibility.
Call for Collective Action and Mentality Shift:
Chomsky stresses the need for a change in collective mentality, focusing on cooperation and solidarity over competition and greed.
Solutions require global commitment, ethical reform, and a reorganization of societal priorities to create a more just and sustainable world.
Urgency of Action:
Humanity’s survival depends on learning from past mistakes and acting decisively to bridge the moral gap.
Chomsky concludes with a hopeful message: while time is limited, solutions are within reach if society is willing to act now.
This perspective calls for reflection on Einstein’s wisdom: “We cannot solve our problems with the same kind of thinking that created them.” Chomsky’s vision urges a transformative approach to ensure a better future.
Do you have better ideas or more practical solutions to offer than this?
MY = ChatGPT given the organization and sentence structure.
“This perspective calls for reflection on Einstein’s wisdom: “We cannot solve our problems with the same kind of thinking that created them.”
While MIT was the locus classicus of all too many of the problems of the present day , I don’t recall anyone during his long and hegemonic reign over language and the humanities there complaining that while Einstein’s favorite contemplative recreation was climate friendly dinghy sailing, Chomsky tore around the Charles basin in a 200 horsepower speedboat.
In Re to Russell Seitz, 17 Jan 2025 at 11:58 AM,
https://www.realclimate.org/index.php/archives/2025/01/2024-hindsight/#comment-829162
Dear Russell,
Thank you for your remark about Einstein and Chomsky.
I remember that equally as “Mammon”, also a subject appearing herein as “Dharma” loved citing both Chomsky and Einstein in his/her/its posts.
A while ago, I opened the link to an Einstein’s article about socialism provided in one of these posts and read it. I appreciate that despite his sympathy for socialism and lack of any practical experience with life in the Soviet Union and/or in its satellites, Einstein correctly recognized that the “real socialism” has not much common with humanity.
I am not sure that the same has ever been recognized by Chomsky, and I am even less sure that it has ever been recognized by Mammon aka Dharma. It is well possible that this subject loves Chomsky just because he criticizes NATO, which does represent an embodiment of evil in present Russian propaganda.
Best regards
Tomáš
Robert: rain.
I’d be so surprised if your fantasy transpires that I wouldn’t just eat my hat, I’d eat my coat and shoes as well.
I agree that the only way to solve the Climate Problem is by political means. However, it is not going to happen anytime soon. Consider the pressure Rachel Reeves (UK minister of finance) is under to ‘produce more growth’ at any cost. Only the 1% of the worlds population have the spare financial capacity to consider change of lifestyles to reduce their carbon footprint. So where does this leave us ? Only one hope…… the men & women in white coats. Engineers and scientists. Put enough of them in a room with a near infinite budget and anything is possible. New or upgraded batteries, transmission lines, fusion etc.
What you are ignoring is the most important aspect–time. Humans have squandered nearly 50 years of this precious commodity, and now, even if you think we can rely on a technological fix, that work won’t have time to unfold unless we buy time by reducing ghg emissions. Everybody has a role in this. Every kW you don’t use actually saves 3 kW. Many of the actions you can take–e.g. more energy efficient appliance, light bulbs, etc.–actually save you money. And if you are hoping to be bailed out by the 1%, I suspect they will be too busy raping the planet and trying to strip it of whatever they can haul away to Mars.
Jonny, I share your optimism about science and invention. However, what are needed are policy changes. We know what we want to achieve; what is lacking is not new inventions, but brakes on fossil fuel use and the deployment of already-available renewable energy.
One of the problems we have in the UK is nowhere near enough renewable energy generation. To compound that issue, we have currently gone through another prolonged period of dull stagnant weather with little wind, little rain, and little sun. Those combined are dreadful for renewable energy generation. This is ending now with the other extreme of a severe windstorm barrelling across Ireland and the northern half of the UK bringing 90-100 mph peak gusts (very bad for wind turbines), Ireland earlier today recorded a gust of 114 mph which if officially confirmed will be a new record for the country.
I know there have been articles published on how to transition to renewable energy but I still don’t have high hopes for the UK. The country’s economy is performing badly, there isn’t enough money to go around, there are a lot of people who oppose wind farms because they spoil the view in areas of outstanding natural beauty, and our current contribution from renewable energy is down into the low single digits percent during these stagnant periods of weather (anticyclonic gloom). The task of building up enough capacity at the moment feels like a Herculean if not impossible task, sorry if that sounds defeatest but much as I would like there to be a solution, I am not seeing it anytime soon. The government is more concerned about immigration, economic activity and the NHS at the moment.
AL: The task of building up enough capacity at the moment feels like a Herculean if not impossible task, sorry if that sounds defeatest but much as I would like there to be a solution, I am not seeing it anytime soon.
BPL: Renewable power now accounts for 42% of the UK’s electricity, and it is still growing. In addition, 15% comes from nuclear, for a total of 57% non-carbon energy. I don’t see the problem.
I wonder what the ratio of FF power plant failures from all causes from all causes* to the failure of winds across the lands and coastal regions of England is?
I don’t have the figures myself but I’d bet heavily that the ratio, if formed, is > 1.
____________
*FF plants don’t work well in a large number of events during embargoes/labor strikes/weather events, etc. But since you are used to fossil fuels, I guess you forgot about that.
Back in early November during the two week period of anticyclonic gloom it was down below 10%. That is your first problem. The second problem is where to build the extra renewable capacity that makes it both resiliant to periods of sub-optimal weather and can be built in places that doesn’t antagonise the masses. I know the vast majority of the UK population are in support of renewable energy, but that doesn’t mean they would be in support of putting wind farms on the Cumbrian fells or the Pennines, or be happy with damning Scottish glens to generate hydroelectricity.
https://www.msn.com/en-in/news/world/how-britains-anticyclonic-gloom-is-putting-damper-on-power-output/ar-AA1tQzJm
The third problem is the government persuading the population it is a good way of spending billions of pounds even with the NHS at near breaking point.
I doubt tapping into Europe’s renewable energy will be a solution at least in the near future given the UK voted to leave the EU, which makes UK-European collaboration far more difficult.
Dismissing issues doesn’t make them go away, no matter how much you would like them to.
AL: I note in the Nov time period I don’t see that renewable generation from wind suffered all that greatly in GB dropping from 36% in Nov 2023 to 30% in Nov 2024. As well, in Nov 2023 39% came from FF sources. You should also know from reading the article that England now has more battery storage and diverse generation sources had no severe problem through this period.
In Nov 2024 FF provided 44% of the energy with the other 56% coming from various non-FF sources.
https://www.statista.com/statistics/1403738/united-kingdom-monthly-distribution-of-electricity-production-by-source/
Two points here:
1. Perhaps you should go by power generation stats instead of weather stats when making statements about power generation falloffs??? Or at least one could note the largest falloffs in wind were measured in SINGLE hours in your linked article. Even on the worst reported week wind still generated 10% of GBs power. according to your link. This is why one has batteries.
2. A mix of sources + sufficient batteries is a GOOD thing.
A third point might be to note that most any tabloid publication will pretty much routinely cherrypick well-covered-by-the-system low single hours of power generation and blow those single hours into two week continental blackout :-O !
Finally (and again) you seem to think that FF plants are never off line en masse. If one has TX relatives, one might ask them about THAT one! Wind power was about all they had for a goodly while during the freeze a while ago.
Jonny A: I agree that the only way to solve the Climate Problem is by political means. However, it is not going to happen anytime soon.
It depends on what you mean by “soon”. From the global, decadal perspective, the future trajectory of global emissions will be determined by the interaction of politics, economics and technology. The temporary political setback in the US is disappointing, but the outgoing Administration enacted America’s first national decarbonization policy two years ago, then lost the 2024 election by 1.5%. The next election can just as easily turn things around again. Meanwhile, the rest of the world, especially China, seems to be moving ahead with decarbonization
Despite the increase in 2024, total CO2 emissions have largely plateaued over the past decade, a sign that the world is making some modest progress tackling emissions.
But a flattening of emissions is far from what is needed to bring global emissions down to zero and stabilise global temperatures in-line with Paris Agreement goals.
That last sentence is undeniably true, but a wide range of emissions scenarios through 2050 are possible, from rapid, relatively peaceful decarbonization, to global mass death and economic collapse. The astounding drop in LCOE for new solar-PV and onshore wind power in the last 15 years, is a compelling illustration of the difficulty of making global emissions predictions even a decade out. Three years ago, Hannah Ritchie said (my bolding):
before we even think about reducing global emissions, we need them to stop growing. We need to peak.
We do have one glimmer of hope that this might not be too far off. Global per capita CO₂ emissions have already peaked. In fact, they probably peaked around a decade ago.
I’m with Ms. Ritchie: “before we even think about reducing global emissions, we need them to stop growing“.If per-capita emissions have peaked, annual emissions growth will decline along with the population growth rate, with peak population now projected before 2100.
while the US and EU are historically the largest emitters, their annual emissions have declined in this century. China has now surpassed both the US and EU in annual emissions, but evidence suggests its annual emissions have peaked (my bolding):
On one hand, China now far outpaces the rest of the world in installing new solar and wind capacity, cutting emissions growth. But the country also leads the world in firing up new coal-fueled power plants, a major source of planet-warming CO2.
The competing efforts have created “a lot of uncertainty” in projecting the future of China’s emissions, which now account for 31% of the world’s total, says Glen Peters, an analyst at the Center for International Climate Research in Norway.
Since there are no professional economists or political scientists offering their expertise on RC, that “a lot of uncertainty” leaves me room for hope. If I make it to 2050, I’ll know I was right!
Describing the recent US election result as a temporary setback limited to the US seems very naive. Worsening weather disasters has not moved the political needle at all, and Trump’s victory was in part due to a large vote of support from young voters, the ones who were supposed to prioritize this issue. The progress of the IRA was matched by the US becoming the largest producer and exporter of carbon-based fuels in history, as some have described, we are now a petrostate.
And not only are corporations falling over themselves to walk away from climate commitments, but Europe is following us politically rather than resisting. Not all of it, but many parts.
Basically it looks to me that there is no political momentum towards decarbonizing at all, let alone on schedule. Add in energy demands for AI and crypto, and it seems that the great growth in renewables will do little to actually reduce carbon energy production, just maybe slow it’s growth.
Then there is the Arctic becoming a source instead of a sink. It really looks to me like we lost and it will take a political miracle to avoid 3 degrees rise. The underlying problem is that there is no truth any more in the public sphere. Climate disasters are blamed on diversity programs. In the post-truth age there can be no rational debate or planning.
Despite all this, I am not giving up. I will still keep trying because even at long odds, it is worth it. But all the tech isn’t going to do us any good if we resist using it to good effect.
Dean Myserson, I tend to think the US election result is mostly a temporary setback, and confined to the USA. The Trump effect seems to be influencing Europe in regard to pushing Europe towards trade protectionism and anti -immigrant policies, but Europe has not left The Paris Accords or abandoned efforts to mitigate climate change and theres no sign its proposing to do that. So I think the Trump effect on climate policy is mostly confined to the USA.
It’s not clear that Trumps crazy policies will do a whole lot to slow down adoption of renewable energy anywhere, because it’s become so cost competitive. He would have to completely ban renewables and he hasn’t proposed that, and he presumably knows it would antagonise a lot of people including his own supporters, especially as the Red States have benefited from renewables in terms of job creation.
And Republican Administrations are unlikely to be permanently in government. It tends to go in cycles. Trump is basically an extremist and a clever con man, and Kamala Harris was a moderate and not a very compelling candidate. That combination is not likely to repeat, especially as Trump can only serve two terms. That said the GOP has created momentum, and the Democrats will have to work hard to counter that.
I agree keeping warming under 3 degrees still looks very difficult, for various other reasons you mention.
The low Democratic turnout which gave Trump the election was driven by voter suppression in the majority of states. Ballot drops were removed in black neighborhoods, people were struck off the voter list, mail-in ballots were rejected because of forgetting to include the date, etc. If Democrats ever get back into power again (a big if), they need to pass laws about this–preferably a constitutional amendment that says every competent adult has the right to vote.
Dean Myerson: Describing the recent US election result as a temporary setback limited to the US seems very naive.
Nigelj: I tend to think the US election result is mostly a temporary setback, and confined to the USA.
Thanks for engaging, guys. AFAICT, we’re having a classic “half-empty vs. half-full” argument. Dean is of the half-empty sort. We’re looking at the same data, but drawing divergent conclusions. Dean says I’m naïve. I maintain I’m not ignoring the danger signs, I simply choose to be more optimistic than he does.
Would Dean and I vote differently, however? Nigel, though not a US citizen, is a keen observer of our political climate (yes, yes). He sees how evenly matched Democratic and Republican voters have been in the last several election cycles. Last fall that was expressed in the victor’s 1.5% voting margin. The previous POTUS was elected by only a 4% margin. Even with gerrymandering, voter exclusion and other Republican machinations, there are about equally many Democratic and Republican voters nationally. I presume the campaign operatives of both parties will strive mightily to split the vote down the middle again next time. The next Democrat to win can reasonably be expected to promote collective intervention to decarbonize our national economy. I don’t have any privileged knowledge of future election results, but while I live, I hope for a better-than-worst-case scenario, with the certainty it will be worse without collective intervention: 3 degrees of warming is bad enough, but I trust we agree it’s better than 5 degrees!
Meanwhile, if we are data-driven, we’ll acknowledge that the globally worst-case emissions scenarios of even 10 years ago are increasingly unlikely. I’m drawing on multiple data sources and expert analyses here, but especially Hausfather and Friedlingstein on CarbonBrief last November (carbonbrief.org/analysis-global-co2-emissions-will-reach-new-high-in-2024-despite-slower-growth) to conclude as Nigel has, that the EU has actually reduced its emissions in the last 10 years. And this article in Science (science.org/content/article/have-china-s-carbon-emissions-peaked-answer-critical-limiting-global-warming) allows me to hope China’s emissions already have peaked. Yes, the US government is now in the hands of denialists. But as a result of the “free rider” phenomenon, we’ll at least get the same benefit of China’s and the EU’s emissions reductions they will, in slower global warming.
Here’s where our subjective interpretations may diverge, due to differences in personality and mood. My own mood-congruent ideation has changed within the last 5 years, upon seeing the declines in global TFR and in LCOE for renewable energy. I sympathize with my fellow Americans who’ve nearly lost hope. All I can say is, don’t the the bastards get you down; and make sure to vote Democratic at every opportunity, at least until some Republican candidate publicly supports a rational US climate policy.
I think that what both the glass-half-full and glass-half-empty arguments are ignoring are the levers of power and who controls them in the US. For the next 4 years at least, the Presidency is in the hands of reactionary forces–so reactionary that they are trying to resurrect the economy of the 1800s, complete with reliance on tariffs rather than income tax for funding, saber-rattling colonialism (Panama, Greenland and even Canada) and a completely outdated reliance on a fossil-fuel based energy economy. The thing is that due to the antidemocratic nature of the electoral college and the state control of elections, Republicans will always have a huge advantage over Dems for the Presidency.
Then there is the legislative branch. Given the current make-up of this branch, it is virtually impossible for any substantive legislation to make it through, and if it does, it will merely be overturned the next time power shifts (which will always be soon). Now you might think that the closeness of the divisions in the two chambers would make legislators very sensitive to public sentiment, but you would be mistaken. The expensive nature of campaigning in the US makes lawmakers more beholden to special interests than to the voters. This is why even extremely popular measures like common-sense gun control go nowhere, and why meaningful climate legislation is not just dead on arrival, it never arrives at all.
And then there is the Judiciary. This branch has made it clear that the rule of law is dead in the US–that even the founding documents of the country (e.g the 14th amendment) can be ignored if they stand in the way of a pro-oligarch or ersatz populist agenda. Rulings like Citizens United and Shelby County (b’bye voting rights act) have ensured gridlock in the other branches of government and the thwarting of democratic will. And the evisceration of the Chevron doctrine has ensured that the courts will play an even greater role in the future, extending rulings into areas where they are even more incompetent than they are at the law. And this is about to get much worse over the next 4 years, as Trump judicial nominees sail through without having their suitability, ethics, competence or even their heartbeat examined.
OK, what about the states? Republicans control all levers of power in 23 of the 50 states, and hold governorships in another 3. Dems wield any control in only 22 states. And the longer Republicans stay in control, the more they change the rules to ensure perpetual domination–viz. N. Carolina and Wisconsin and more recently the takeover in MN.
The “free” press–entirely dominated by conservatives and tech bros.
The economy? It’s Galt’s Gulch all the way.
So the problem is that even if America were to decide it wants to come back from the brink, there is no one to lead it off the ledge. The glass isn’t half full or half empty. It’s shattered.
Ray, I for one am not ignoring who controls the levers of power in the US. Concentrated carbon capital has enormous political consequences, but that’s due to its influence over what the public knows, and of course its ability to suborn politicians directly, by bribery and/or extortion. The ultimate power for collective action in the US resides in the aggregate of our individual votes. The founders set it up that way because they trusted no one who wanted power, specifically each other. The Constitution isn’t a purely political sausage, nonetheless. For one thing, when the currency is votes, dollars don’t always win. Popular sovereignty may be chaotic at best and often horrific, but no higher authority exists. On a more practical level, I think you’re overlooking the fundamental problem with American democracy today: too many Republicans and not enough Democrats!
Yet despite all Republican chicanery, Trump won last year by only 2.3 million votes, out of 152.3 million. Biden beat Trump by more than that in the previous cycle, and the IRA of 2022 was subsequently enacted. The ensuing flood of mitigation-alarmist disinformation and faux outrage from astroturf professionals and volunteer useful idiots is proportional to the threat collective intervention presents to their profits. Taking the profit out of selling fossil fuels is what decarbonization means!
Yes, the people who didn’t vote Democratic last year may have been misled by “the media”, including proliferating social media, with their additive din of pernicious nonsense. Yes, too many Trump voters were impelled by the irrational fears and prejudices of their shared cultural identities, while too many of our fellow Americans who are concerned or even alarmed about climate change were insufficiently inspired to vote that way. Yes, our decarbonization progress has been set back at least two years. I’m laying the blame at the feet of my neighbors in rural Oregon, who stubbornly evince private agency independent of my opinions. I’m not dead yet though, and barring bloody civil war within the next four years, which frankly I can’t rule out, I insist it’s not naïve to hope that a Democratic leader like Kamala Harris but marginally more charismatic will appear on a later ballot, able to persuade just 2.3 million more voters than last November to follow her! I would expect her at least to sustain and extend the decarbonization provisions of Biden’s IRA. Gotta start somewhere, and every decrement in our aggregate emissions below what they would be without collective intervention, diminishes the power of fossil fuel profits!
And again: even with this American plutocratic counter-assault, other countries appear to be on an irreversible path toward building out their own carbon-neutral economies. That’s clearly indicated by the continuing decline in LCOE and scale up in capacity of renewable energy (ourworldindata.org/renewable-energy) and battery storage (ourworldindata.org/battery-price-decline) worldwide.
My underlying point is that both optimism and pessimism are mood-congruent. Science is insensitive to our moods, favoring neither fear nor hope. We’re existentially free to choose.
I guess I’m rather leaning in RL’s position on the aesthetic interpretation of volumes in a glass. Put it this way, Trump, who has all the character and charm of Ubu Roi, has been using the glass as his personal toilet, and the proper mood is disgust. The whole situation is absurdist.
The executive has been captured, the legislature has more or less been captured, the judiciary is hooked. Key media have been captured, certain religious institutions have been captured (“cult” isn’t too strong a word in some instances). If the situation were in anyway normal, Trump would never have even made it into his first primary, He would never have been elected. He would never have been in a position to return after that. He would never have won a second term–this time with the popular vote! And he’d be facing a lot more resistance to the mess he’s currently making. In short the pawn level players are being side-lined and disempowered, and the people who should know better can’t seem to figure out what happened or what to do about it. This has been decades in the making.
We don’t know what state the country will be in in four years. He may try to run again after shredding the constitution, if that is, in the meantime he doesn’t have a massive coronary from burger ingestion. Or MAGA may take over. Or the Dems may win and spend most of the following four years cleaning up and repairing damage when they could be addressing critical issues, like climate change, which will always be an issue in one way or another. I wouldn’t rule out street level unrest either– leading to what? We. Don’t. Know. None of it looks very good. And I’m a little disheartened to think that maybe the dominant response could be dismissive, self-calming soporifics leading to inaction.
RH: He would never have been in a position to return after that. He would never have won a second term–this time with the popular vote!
BPL: 6 million fewer Democratic votes were recorded this time; 75 million instead of 81 million in 2020. Voter suppression may have been responsible. People were cut from voter rolls, dropboxes were removed from heavily black or student areas, etc.
BPL,
Indeed!
Bad links (overzealous cropping): “while the US and EU are historically the largest emitters, their annual emissions have declined in this century. China has now surpassed both the US and EU in annual emissions, but evidence suggests its annual emissions have peaked”
Should be “while the US and EU are historically the largest emitters, their annual emissions have declined in this century. China has now surpassed both the US and EU in annual emissions, but evidence suggests its annual emissions have peaked”
Just in case any of y’all follow up!
Emissions per capita are larger in the U.S. than China by a wide margin.
JA: My earlier hopes for UK Labour appear to have been ill founded. The latest, the third runway for Heathrow, is an appalling embrace of stupid. That would cancel a hard-fought environmental victory. It is an insult to intelligence and to the principles of working for the benefit of ordinary people which used to be Labour’s strength. Here’s some good snark on that: Back by unpopular demand, the great Heathrow expansion show. If only planes ran on hot air
https://www.theguardian.com/commentisfree/2025/jan/24/heathrow-third-runway-labour-rachel-reeves
I have trouble with throwing a hail mary of over 20 billion at CCS (where progress has been slim) when that’s almost the exact size of the debt left by Tories. They seen to feel snipping away at benefits for ordinary people is a great way to finance more benefits for top heavy business interests.
Davos has become a true insult to said humanity: a schmooze party for out of touch greedpocalypse supporters. Jet setters united against our future.
Pre-emptive journalism, she hasn’t actually approved it yet, merely hinted at it. Of course, if the population claim to be opposed to it, perhaps they could put their money where their mouth is and drop the multiple overseas holidays every year which would lessen the need for another runway. People are very good at claiming to care about climate change up to the point where doing anything worthwhile at an individual level involves giving up something enjoyable/convenient/comfortable.
AL: I stopped flying to the UK over 20 years ago. It was neither convenient nor comfortable. But it was obvious.
You may have done, well done, I have minimised flying over the same period so not quite as good as you, but it is not about what you or I do, it is about what everyone does collectively. When I went car free many years ago it made no difference to the local air pollution or traffic congestion, but it made my life more difficult. Similarly, you or me giving up flying hasn’t stopped the UK government from deciding we need to expand Heathrow and maybe even upgrade a few more airports as well in the name of economic stimulation, because (almost) everyone else is still flying. This highlights one of the biggest problems, that doing anything on an individual level in the grand scheme of things achieves nothing, but it can make some areas of life more difficult or uncomfortable, and I suspect those who have taken the biggest cuts to their carbon footprint are largely the extreme enthusiasts i.e. a niche section of the population. We need the bulk of the population to be enthused about combatting climate change and avoiding the worst consequences, but I cannot control other people and my sphere of influence is tiny relative to the size of the population. What is the roadmap to large scale change and where do I look for signs of optimism?
Adam Lea: People are very good at claiming to care about climate change up to the point where doing anything worthwhile at an individual level involves giving up something enjoyable/convenient/comfortable.
This is the very definition of the Tragedy of the Commons. People have always been unwilling to give up something enjoyable/convenient/comfortable: that is, having a net private benefit to them and/or their families, in an ancient global marketplace that allows them to socialize a portion of their private costs and risks. And it’s the very reason why mitigating global warming requires “mutual coercion, mutually agreed upon” (G. Hardin).
One more time for the record: I’m urging optimistic collective decarbonization advocacy, not complacency! Though I was, like y’all, deeply dismayed by the last election, my targets in the next one (yes, assuming there is a next one) are the 2.3 million US voters who put Trump over the top by failing to vote for Harris. I’m optimistic that, as happened just four years ago, a skillful enough politician on the climate-reality side can overcome the denialists’ previous, paltry voting advantage, and persuade enough additional Americans to emerge from their bunkers and vote to collectively intervene on behalf of the public good. But all my optimism is provisional on getting out the vote! My aim here is to counter defeatism among climate realists, because unless enough people vote Democratic in every coming election, decarbonization will take a lot longer, and the globe will get hotter. All you “nattering nabobs of negativism” (LOL) should draw on whatever fear and anger you need, to motivate you to vote against open-ended fossil carbon emissions. But please don’t surrender to despair, or you will only enable greater tragedy!
I’ve said this several times already, so I don’t know why I’m bothering again. I nonetheless maintain that optimism about decarbonizing the US economy sooner or later can find justification in facts. I won’t cite those here, because I already have elsewhere. But I, for one, see meliorative social/political trends, driven by the ever-more-costly physical/economic trend of severe weather around the world, as well as the growing drumbeat from climate-adjacent scientists and responsible journalists. Simultaneously, the global market advantage of carbon-neutral energy, as producers learn how to make it cheaper and more reliable, clearly shows a path to “net-zero” or close to it within a few decades. My brief now is to counter the climate-defeatism that contributed to Trump’s victory, because it will potentially discourage too many Democratic voters from going to the polls next time!
Was this a partisan harangue? Only instrumentally: in this case, reality happens to have a liberal bias.
And it will continue to go up, the question is will it go down in time to prevent the major feedbacks kicking in? Looking at today and reading that the Nord stream gas pipeline released up to 485,000 tonnes of methane, which ended mostly in the atmosphere https://www.nature.com/articles/s41586-024-08396-8 or all the other preventable combustions through various wars from around the world, the prospects are bleak when assuming that things could get even more out of control moving forward.
The question I would like to be answered, how long can we stay above 1.5C and poke the beast?
The 1.5’C change was a temporary thing, but does reflect a tipping point for the global climate. As with the previous El-Nino periods over the last few decades, temperatures will decline in the several years following the peak, but never back to the level they were before the peak.
It represents another step in a noisy stepwise trend upward.
Gavin – “1.5ºC or not 1.5ºC” Followed by lots of analizing about the fine hairs.
All this refencing temps to a ‘nominal’ pre-industial values is understandable – you want a figure that reflects the warming since GHGs began to increase. But then you get people saying things like “I can’t get excited about a 1.5C increase in 175 years” and then it’s left left to plebs like me to point out most of the warming has occurred since the 1970s – concomittant with rocketing GHGs. since mid-20th century
It seems to me the ubiquitous focus on warming since pre-industrial is an exercise in taking your eye off the ball and you’re selling the public short by not pressing home the nature of the warming and GHG radiative forcing increase – 72% of which has occurred since 1950
Agreed, Phil.
If we assume that there are people who will listen, the message needs to be one that they can better relate to… I’ve been saying that a while, and more so lately because the technology has moved on some from tree rings and ice cores and buckets from the back of ships. (And all that previous work was necessary, and remarkable in effort and sophistication.)
But now that we can measure the energy increase in the climate system directly, my experience tells me that relating what we observe and experience to that fact is much easier for “the public” to understand and accept. An example is this sub-thread:
https://www.realclimate.org/index.php/archives/2025/01/unforced-variations-jan-2025/#comment-829037
PB: Followed by lots of analizing about the fine hairs.
BPL: Analysis, or analyzing. “[A]nalizing about the fine hairs” would be something completely different.
Particularly when one talks about “analizing about fine hairs.”
This is a family blog!
Ray L: what kid doesn’t love scatological jokes? [looking it up will contribute to their education; and wow, extra benefit from me checking spelling, mizewell look of eschatological as well]
heh, there are numerous typos in my post but that isn’t one of them ;-)
If anyone wants a dose of frightening climate history, take a look at the case of the Doji bara famine (also Skull famine) of 1791–1792 in India.
https://en.wikipedia.org/wiki/Doji_bara_famine
Apparently it has been linked to a possibly prolonged El Nino that
“caused the failure of the South Asian monsoon for four consecutive years”.
“According to one study, a total of 11 million people may have died during the years 1789–1792 as a result of starvation or accompanying epidemics of disease.”
That followed from another El Nino-caused famine a decade earlier, with a similar outcome.
https://en.wikipedia.org/wiki/Chalisa_famine
Was not aware of the El Nino linkage to these famines (and others) until someone on Bluesky pointed it out.
– Piotr: “And isn’t this ironic that of all people it is YOU who proclaims on “ economical unfeasibility “? You do remember your Sahara scheme in which you DISMISSED the falsifiable estimates of the costs of YOUR scheme (“10s of TRILLIONS of $ annually, for 100s of 1000s of years for a fraction of 0.3K reduction in AGW”)“ I have never analyzed [your own proposal’s] technical and economical feasibility.”
Tomas Kalisz: “ Hallo Piotr, I would like to remind you that I discussed the “Sahara irrigation” when I strived to show that such a massive regional change in land hydrology may have a measurable influence on global climate.”
which would be an entirely MEANINGLESS exercise UNLESS you could prove that altering water cycle could offset the entire or part of the GHGs warming. Which you attempted – first calculating how much water would need to evaporate to cancel the ENTIRE warming by the GHGs, and given the absolutely ridiculous volume of water needed for that – you then scaled it down to your half-a-Sahara irrigation to achieve the “0.3 K cooling” i.e., which has the only meaning as an ALTERNATIVE to reduction of enough GHGs to cause equivalent 0.3K cooling.
And the ONLY argument in favour of that ALTERNATIVE can be economic, since ecologically evaporation schemes are inferior (unlike CO2 reductions, they don’t reduce ocean acidification). Yet when I challenged the astronomic costs of your scheme – you tried to seed doubt in my estimates with: “ I cannot confirm how accurate [these] quantitative estimations of the economical feasibility are ” and as reason you gave that you never give any thought to he costs, i.e. to the ONLY reason why would we may even look at your scheme.
All which is a classic “Tomas Kalisz” – your contribution to this group is based on your intellectual arrogance (you assume again and again that you are so brilliant that you come up with questions and ideas that NO professional scientist ever thought of),
you ask your never-ending, never amounting to anything, “questions” which you were too lazy to think through, or too lazy to pick up a textbook or do a google search – and use your uninformed “opinions” and “feelings” to push the “anything but GHG” deniers narrative and to question the credibility of climate science and scientists.
When challenged – unable to defend your actions – you don’t have the balls to stand by them, nor admit of being wrong. Instead, you try wiggle out on a technicality and/or on lies (like in your current post) and compensate with an arrogant tone ( “I would like to remind you that”; “some prominent climate scientists still like feeding media with dire mentions of “runaway warming” )
And you are bound to sink deeper and deeper: if you can’t admit your errors – you will never learn from them.
a few remarks to Piotr, 1 Feb 2025 at 11:07 PM,
https://www.realclimate.org/index.php/archives/2025/01/2024-hindsight/#comment-829820
1) Sahara irrigation
I would like to put Piotr’s quotes into context of the respective thread above. Piotr’s sentence comes from his post of 26 Jan 2025 at 12:50 PM,
https://www.realclimate.org/index.php/archives/2025/01/2024-hindsight/#comment-829534
and my sentence from my post of 1 Feb 2025 at 1:12 PM,
https://www.realclimate.org/index.php/archives/2025/01/2024-hindsight/#comment-829801
I do not think that omitting the exchange that happened in between (and thus putting together distant fragments of the exchange that actually do not belong directly together) makes much sense.
2) runaway warming
My objection to ambiguous and potentially confusing use of the term “runaway warming”, mentioned in the penultimate paragraph of Piotr’s post, comes from still another thread, see my posts of 27 Jan 2025 at 10:52 AM,
https://www.realclimate.org/index.php/archives/2024/12/ai-caramba/#comment-829575
and of 29 Jan 2025 at 11:19 AM,
https://www.realclimate.org/index.php/archives/2024/12/ai-caramba/#comment-829678
that in my opinion should be, moreover, read in the broader context of preceding and following posts of other participants, including also Piotr, in the respective discussion.
Greetings
Tomáš
Tomas Kalisz: “ I do not think that omitting the exchange that happened in between makes much sense. ”
That’s called: “being able to focus on the discussion at hand”. A skill fundamental to any discussion. I refer and quote only to the parts of your posts that are RELEVANT to the point I am making, ignoring the rest of your irrelevant vacuous logorrhea.
Throwing around a bunch of links AS IF they contained something that completely changed the discussion – WITHOUT BEING ABLE to actually show the specific quotes doing so – is a sign of the intellectual impotence.
Not to waste more time on you, I’ll just paste the conclusion of my previous post (the falsifiable arguments LEADING to that conclusion – in my previous post)
========= Piotr Feb. 1 ===================
All which is a classic “Tomas Kalisz” – your contribution to this group is based on your intellectual arrogance (you assume again and again that you are so brilliant that you come up with questions and ideas that NO professional scientist ever thought of), you ask your never-ending, never amounting to anything, “questions” which you were too lazy to think through, or too lazy to pick up a textbook or do a google search – and use your uninformed “opinions” and “feelings” to push the “anything but GHG” deniers narrative and to question the credibility of climate science and scientists.
And when challenged – unable to defend your actions – you don’t have the balls to stand by them, nor admit of being wrong. Instead, you try wiggle out on a technicality and/or on lies (like in your current post) and compensate with an arrogant tone ( “I would like to remind you that”; “some prominent climate scientists still like feeding media with dire mentions of “runaway warming” )
If you can’t even admit your errors – you will never learn from them.
=============