Over multiple generations of CMIP models Arctic sea ice trend predictions have gone from much too stable to about right. Why?
The diagnostics highlighted in our model-observations comparison page are currently all temperature based, and show overall that climate models have being doing well on these trends for decades. But there has been increasing attention to trends in non-temperature variables, and there, model performance is more mixed (Simpson et al., 2025). As we’ve discussed before, model-observation discrepancies can arise from three causes: the observations could be wrong (unrealized biases etc.), the models are wrong (which can encompass errors in forcings as well as physics), or the comparison could be inappropriate.
One of the most high profile ‘misses’ in coupled modeling over the last few decades was the failure of the model projections in CMIP3 (circa 2003/4 vintage) to match the rapid losses in Arctic sea ice that started to become apparent in the middle of that decade (Stroeve et al., 2007), and were compounded by the summertime record losses of sea ice in 2007 and then 2012. With an additional decade, how does that look now?
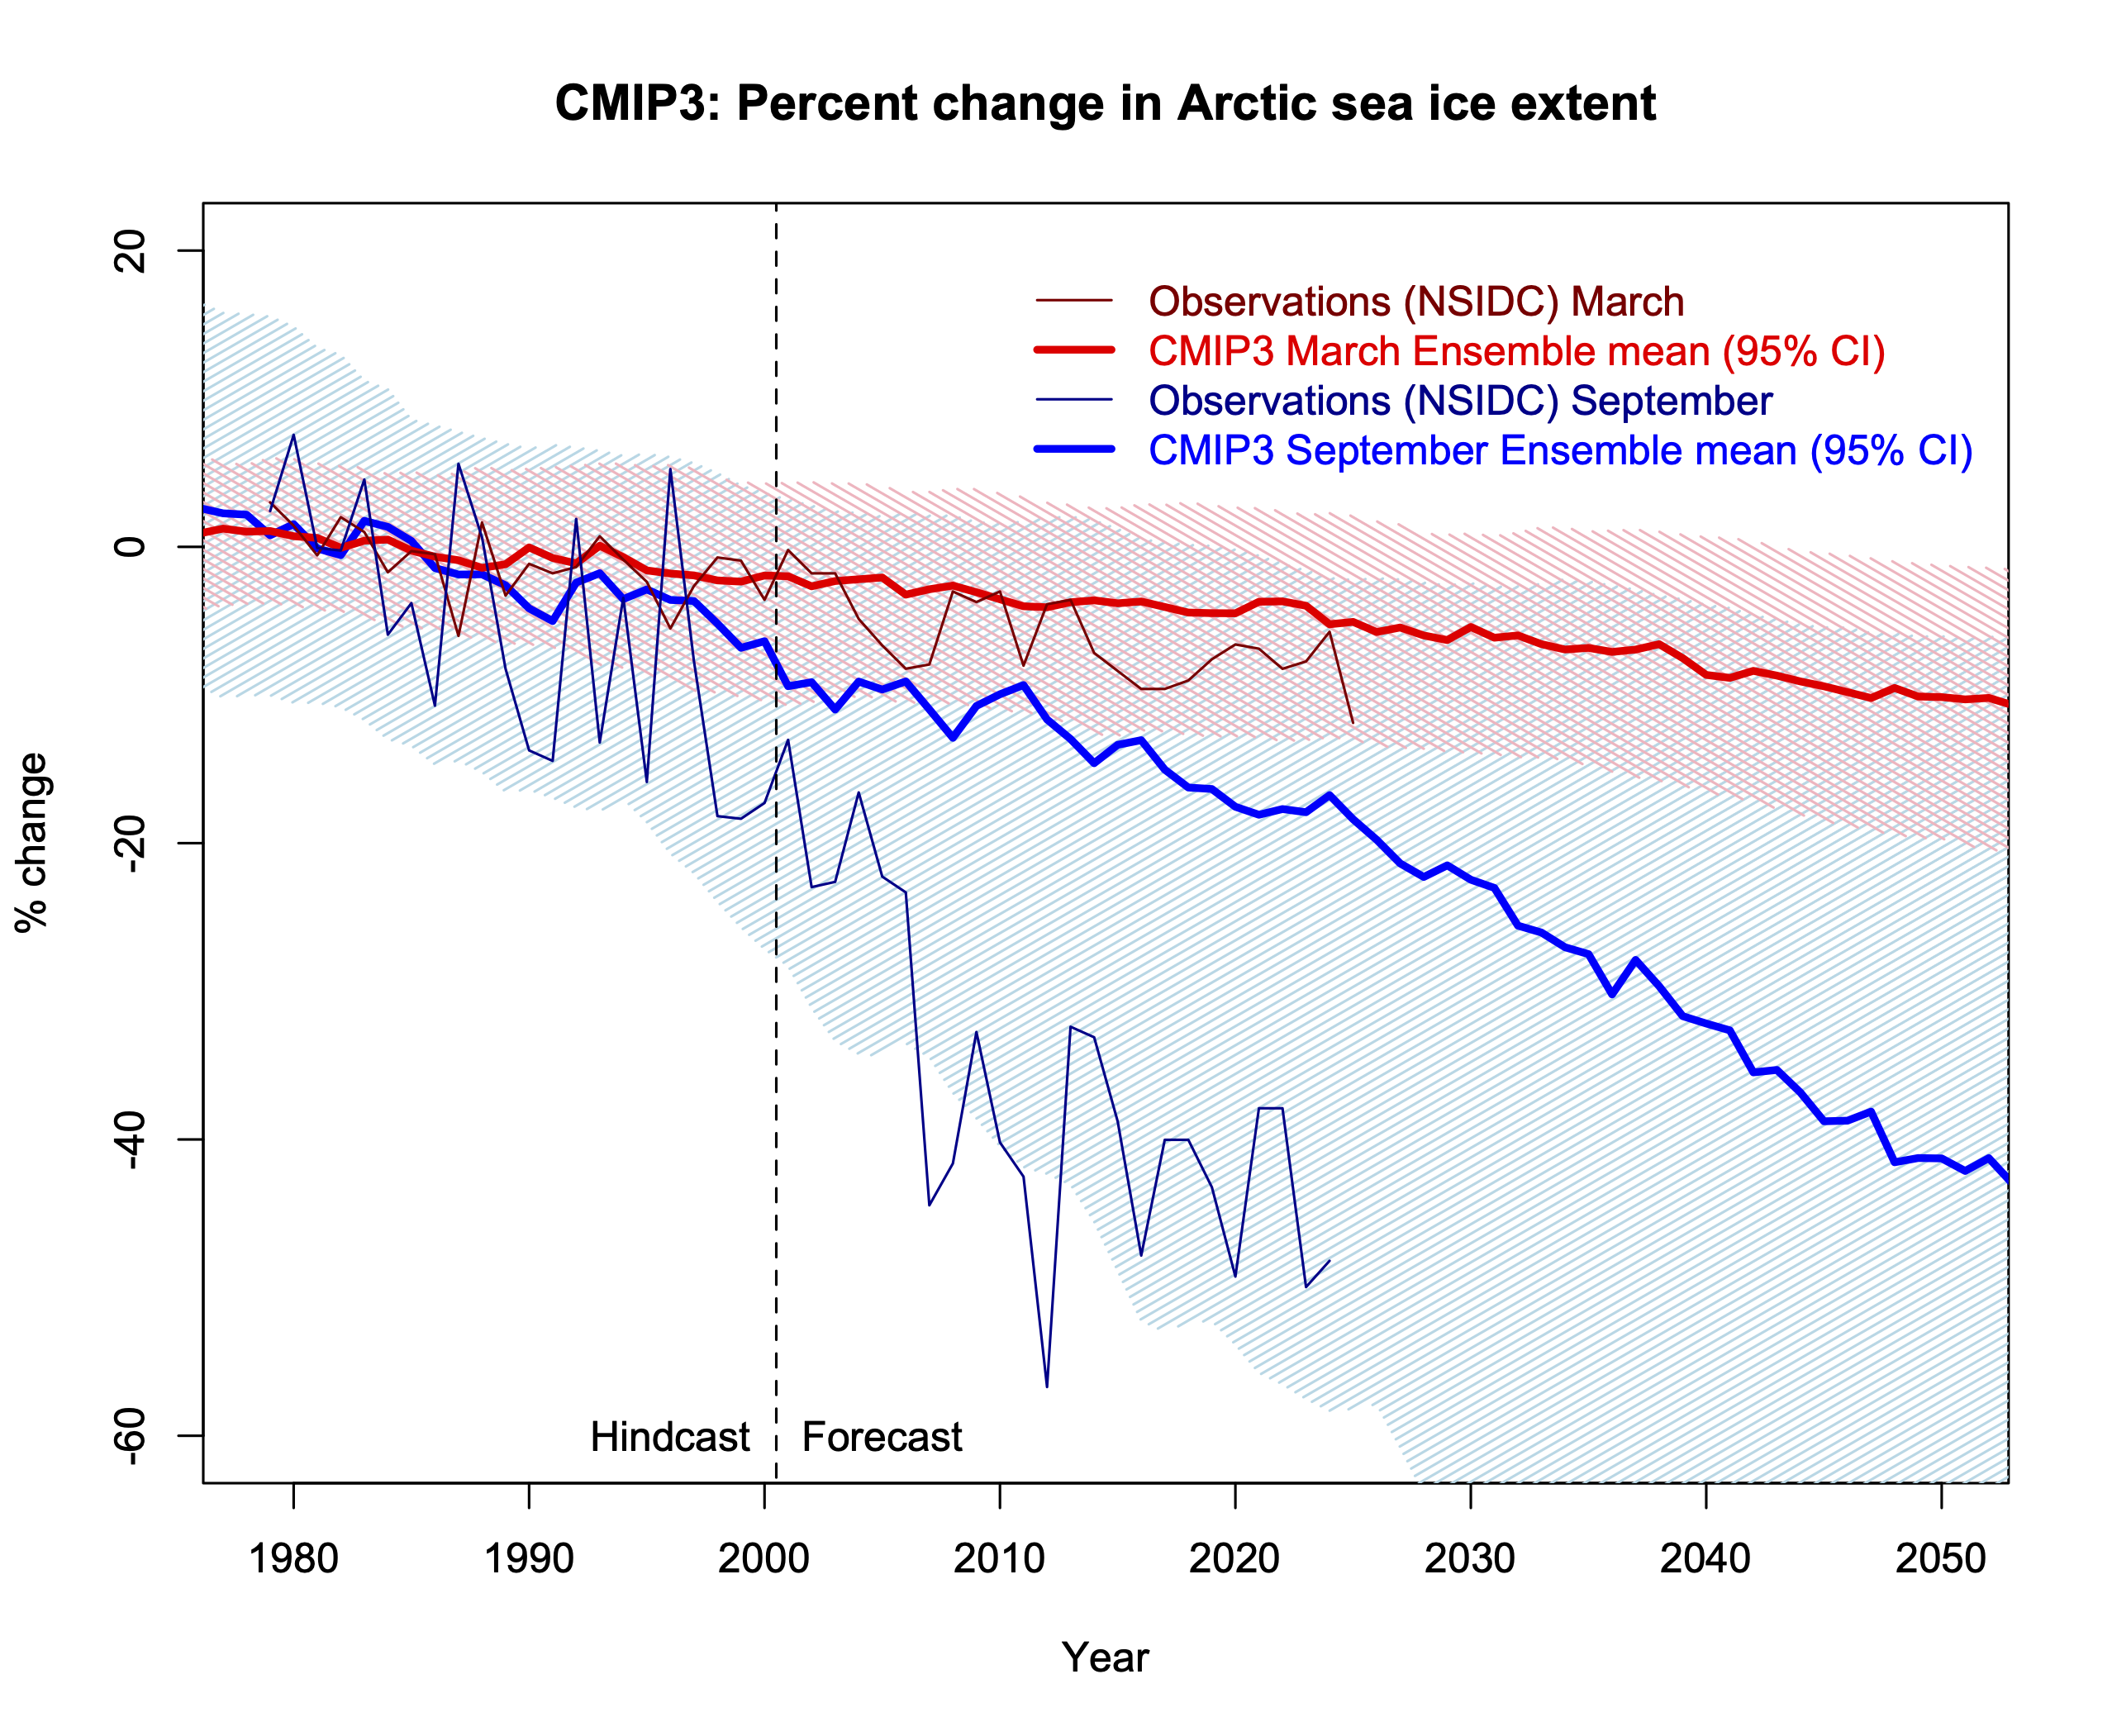
In a word, the CMIP3 Arctic sea ice projections were, and remain, terrible. The ensemble mean predicted rate of change of September Arctic sea ice extent is less than half that observed (-4.5 %/decade vs. -11 %/decade for 1979-2024), and there are only five single individual model simulations (out of 46) that have a loss rate greater than 10 %/decade (95% spread is [-12,-0.7] %/decade). The March trends are also under-predicted, but by a lesser degree. There is no real ambiguity in the observed trends, nor in the comparison (though extent is a little trickier than area to compare to), and so these discrepancies were very likely due to model failures – insufficient resolution to capture the polar sea ice dynamics, too simple sea ice physics, biases in the Arctic ocean simulations etc. Analyses have shown that errors in the absolute amount of sea ice were correlated to the errors in the trends as well.
Development of the CMIP5 models was ongoing as these discrepancies were manifesting, and there were improvements in sea ice physics and dynamics, increased resolution and a reduction in the overall climate biases. The simulations in CMIP5 were conducted around 2011-2013, and used historical forcings from to 2005, and scenarios subsequently. Did that make any difference?
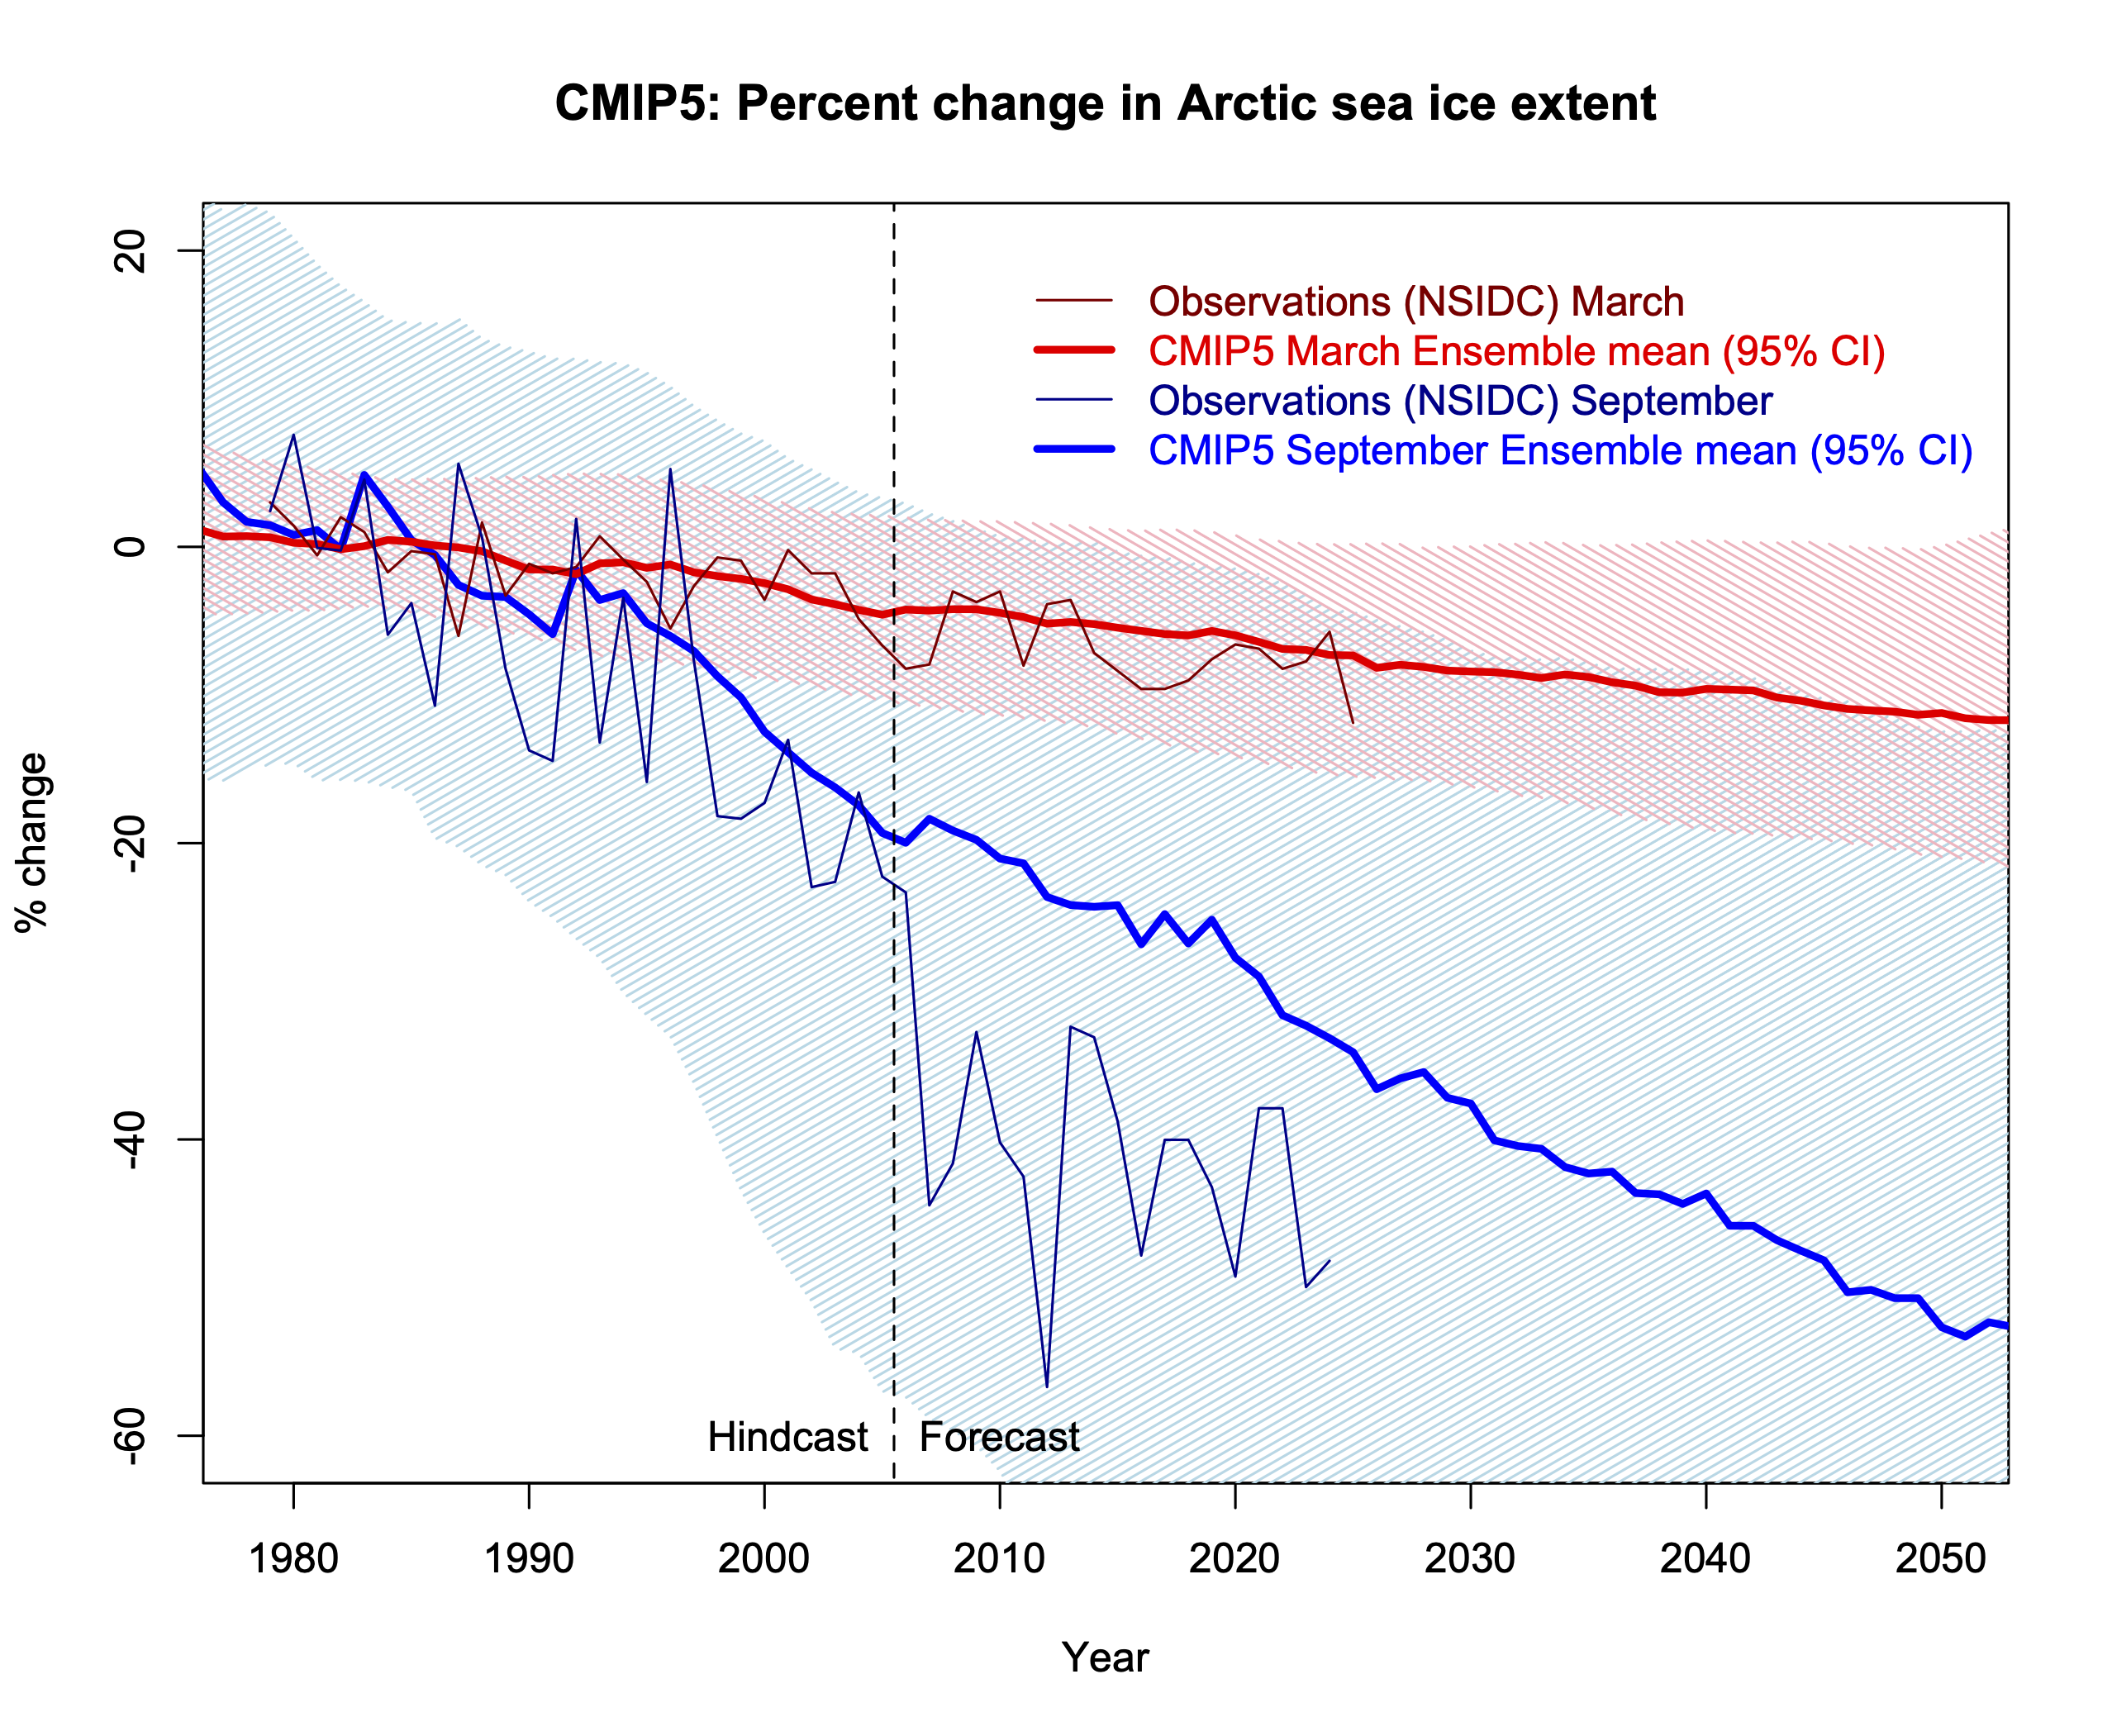
Closer, but no cigar. The spread in the CMIP5 models is larger (a function of greater variability), and the observations are now more within the spread, but the September ensemble mean trend (-8%/decade) is still a bit too low. But nearly 40% of the 107 individual simulations (95% CI is [-20,-1.4]%/decade) now have losses greater than 10%/decade. The March trends are mostly well represented, but there are still large variations in the absolute extent.
There was a longer gap before CMIP6, but those models were developed through to 2017/8 or so, and so developers were well aware of the ongoing discrepancies (Stroeve et al., 2012). Again, there were improvements in sea ice physics, dynamical schemes, forcings (the addition of black carbon impacts on snow and ice albedo for instance), and again, improvements in resolution and in the base climatology.
As a minor aside, from 2007 to 2014 there was a spate of un-peer reviewed claims from a few scientists (Peter Wadhams and Wiesław Masłowski notably) that used non-linear statistical fits to the observed sea ice indices to predict essentially ice-free conditions by 2013, or 2016 or so. These predictions were not based on any physical insight or model, were heavily criticised by other scientists at the time (I recall a particularly spicy meeting at the Royal Society in 2014 for instance!), and (unsurprisingly) were not validated. But this kind of stuff is perhaps to be expected when the mainstream models are not providing credible projections?
Anyway, back to CMIP6. Third time’s a charm?

Actually, this isn’t bad. The CMIP6 ensemble mean for September area trends is now -11 %/decade (observed 13 %/decade) and the March trends are spot on. Note that the observed loss in ‘area’ is slightly larger than the trend in ‘extent’ (13 %/decade vs. 11 %/decade) and I’m using area here because that is what is available. The spread for September trends is [21,3] %/decade which is slightly tighter than in CMIP5, and 40% (again) have losses greater than 10 %/decade.
What lessons can be drawn here?
As we have often stated, models are always wrong, but the degree to which they can be useful needs to be addressed – by variable or by model generation or by model completeness etc. The utility of the CMIP6 ensemble (and presumably the upcoming CMIP7 models) for Arctic sea ice is clearly higher than the CMIP3 ensemble, but there doesn’t appear to be a single thing that needed to be fixed for that to happen. Rather, an accumulation of improvements – in physics, resolution, completeness, forcings – have led to a gradual improvement in skill (not just in the sea ice trends!).
As Simpson et al (2025) noted, there are increasing numbers of climate quality diagnostics that have long enough time series and emerging signals of change, such that there are an increasing number of tests for the model trends. The history of Arctic sea ice comparisons shows that it might be premature to conclude that any specific discrepancies imply that something is fundamentally wrong, or that climate modeling is in a ‘crisis’ (Shaw and Stevens, 2025), it may well be that these discrepancies will resolve themselves in the course of ‘normal’ model development (and as the observed signals become clearer). Or not ;-).
Note on sources: CMIP3 (Mar, Sep) and CMIP5 (historical, rcp45) processed extent data are from Jacob Dörr (Notz et al, 2020) and Alex Jahn (via Julienne Stroeve and Patricia Derepentigny), and the CMIP6 area data is from the U. of Hamburg data portal (courtesy of Dirk Notz). Ensemble means are over the whole ensemble with one simulation = one vote. Also I haven’t screened the CMIP6 models by climate sensitivity (as I’ve done for the temperatures). These choices might make small differences, but not effect the main conclusions.
References
- I.R. Simpson, T.A. Shaw, P. Ceppi, A.C. Clement, E. Fischer, K.M. Grise, A.G. Pendergrass, J.A. Screen, R.C.J. Wills, T. Woollings, R. Blackport, J.M. Kang, and S. Po-Chedley, "Confronting Earth System Model trends with observations", Science Advances, vol. 11, 2025. http://dx.doi.org/10.1126/sciadv.adt8035
- J. Stroeve, M.M. Holland, W. Meier, T. Scambos, and M. Serreze, "Arctic sea ice decline: Faster than forecast", Geophysical Research Letters, vol. 34, 2007. http://dx.doi.org/10.1029/2007GL029703
- J.C. Stroeve, V. Kattsov, A. Barrett, M. Serreze, T. Pavlova, M. Holland, and W.N. Meier, "Trends in Arctic sea ice extent from CMIP5, CMIP3 and observations", Geophysical Research Letters, vol. 39, 2012. http://dx.doi.org/10.1029/2012GL052676
- T.A. Shaw, and B. Stevens, "The other climate crisis", Nature, vol. 639, pp. 877-887, 2025. http://dx.doi.org/10.1038/s41586-025-08680-1
- D. Notz, and S. Community, "Arctic Sea Ice in CMIP6", Geophysical Research Letters, vol. 47, 2020. http://dx.doi.org/10.1029/2019GL086749
Thanks, Gavin! This reminds me of conversations past, in which I tried to explain that 1), more than one climate variable matters; 2) that yes, climate science was and is cognizant of errors, 3) is willing to admit that errors happen, and 4) works to learn from them. Also that, as Ray has said in the past, errors are not always overpredictions, and by extension that “uncertainty is not a friend.”
GAVIN SAYS:
The utility of the CMIP6 ensemble (and presumably the upcoming CMIP7 models) for Arctic sea ice is clearly higher than the CMIP3 ensemble, but there doesn’t appear to be a single thing that needed to be fixed for that to happen. Rather, an accumulation of improvements – in physics, resolution, completeness, forcings – have led to a gradual improvement in skill (not just in the sea ice trends!).
Title:
Have Climate Models Earned Their Arctic Sea Ice “Improvement” — Or Are We Just Smoothing Over 23 Years of Failure?
The recent RealClimate article reviewing predicted Arctic sea ice trends across CMIP ensembles (CMIP3 through CMIP6) raises some troubling questions about how the modeling community is now reframing past model failures as part of a “gradual improvement” narrative.
Let’s be clear: for over two decades, CMIP3, CMIP4, and CMIP5 generated Arctic sea ice projections that were not just slightly off — they were deeply, persistently, and systematically wrong. Most of those models predicted summer sea ice persisting well into the late 21st century, yet we now face plausible scenarios of an ice-free Arctic September in the 2030s or earlier. That’s not a minor deviation — that’s a massive forecasting failure for a major climate system component.
And now, suddenly, we’re told that CMIP6 is doing better — as though this were the natural result of steady scientific progress. But this glosses over some vital issues:
1. Where Is the Post-Mortem on CMIP3–5?
There is zero transparency in most public-facing articles about why CMIP3–5 failed so badly on sea ice. What specific physics, parameterizations, forcings, or feedbacks were missing or mishandled? Without a detailed diagnosis, how can we be sure CMIP6 isn’t just accidentally “right” — or worse, tuned to appear so?
Science is supposed to be about falsifiability and explanation. Yet there’s been no real accounting for how those older ensembles went so wrong, just vague talk of “improvements in resolution and physics.”
2. Improvement… or Post-Hoc Tuning?
The fact that CMIP6 now better aligns with observations after years of criticism about underestimation naturally raises the question: are models now being subtly calibrated or post-tuned to fit the observed data more closely? That’s not inherently unscientific, but it is problematic if:
— It’s not disclosed.
— It gives a false sense of predictive skill.
— It masks ongoing weaknesses within individual models.
3. The Ensemble Mean Hides the Outliers
The RealClimate article relies heavily on smoothed ensemble means, which — while useful for broad comparison — can obscure the fact that many individual model runs still perform poorly. This statistical smoothing flattens out the actual spread and makes the results look more robust than they are.
Even Gavin Schmidt and Roger Pielke Jr. have, in other contexts, pointed out that over-reliance on ensemble means can hide critical flaws. The question isn’t whether the average is better — it’s whether the individual models have learned to capture key dynamics, or whether we’re just cherry-picking those that happen to now align with observation.
4. Coincidence or Competence?
If CMIP6 now “gets it right,” we must ask: is this a real validation of the physical models — or just a statistical coincidence? After 23 years of flawed outputs, we’re owed more than hand-waving and retrospective optimism.
Where’s the evidence that these improvements stem from first-principles physics, and not just smarter curve-fitting or scenario tweaking?
Final Thought
We’re talking about one of the most sensitive climate indicators on Earth — Arctic sea ice — and the narrative now seems to be: “We underestimated it for two decades, but trust us, CMIP6 is better.”
Fine. Then prove it — with transparency, with detailed analysis of past errors, and with testable physical justifications for current model success.
Until then, it’s not denialism to question whether this “success story” is being oversold. It’s just responsible skepticism — the foundation of good science and high public communication standards.
William why do you fill this page up with so many words which don’t actually say much. You could have instead asked Gavin or whomever for examples of how the understanding of physics related to ice sheets has improved. I asked the Google AI search tool and got a detailed answer.
Model Improvement or Statistical Coincidence?
I posed the questions as suggested to niglej (in my prior comment) to Google’s Gemini.
An Assessment of Predicted Arctic Sea Ice Trends and the Discourse on Climate Model Evolution
Ultimately, the commenter’s inquiry into whether improvements stem from genuine physical validation or statistical coincidence underscores a legitimate scientific demand for rigorous attribution of model success.
This report concludes that the commenter’s points are valuable for fostering responsible skepticism and advocating for enhanced transparency in climate science communication.
Please let me know of you would like see the assessment in full. I could share a link to it.
Nigelj says
2 Jun 2025 at 1:44 AM
Nigelj — you asked Gemini a question and got a good answer. Great! That’s the point. Most of us now use AI to clarify technical points — and I did exactly that, too. Instead of throwing shade, try comparing insights. Maybe you’ll learn something.
Meanwhile, if you ever feel ready to engage with the actual points I raised — like model tuning, physical diagnostics, or sea ice divergence — the floor is yours.
This hopefully replaces my original comment which was culled before the 5 Jun 2025 at 12:24 AM post.
Addendum – Following Up on Arctic Sea Ice Model Skill
Gavin writes:
“One of the most high profile ‘misses’ in coupled modeling over the last few decades was the failure of the model projections in CMIP3 […] to match the rapid losses in Arctic sea ice.”
Yes — and that’s putting it mildly. The ensemble mean and most individual CMIP3–5 model runs not only failed to capture the magnitude of sea ice loss, they fundamentally misunderstood its timing, trajectory, and sensitivity. This was not a minor calibration error — this was a systemic failure, sustained over multiple generations of models.
CMIP6: A Step Forward?
Figure 3 now presents percent change in sea ice area, not extent — yet the CMIP6 ensemble still fails to match the observed trajectory.
The 2007–2012 collapse remains a clear outlier, still not captured by the mean, nor bounded by plausible confidence intervals.
The spread of model projections is disturbingly wide. For 2014, the 95% CI for September ice area ranges from ~3% to over 90% loss. By 2038, it ranges from 15% to well over 100%. These are not scientifically defensible bounds — they suggest fundamental incoherence, not physical realism.
Why is there no work done on Arctic Sea Volume PIOMASS, surely the most critical component for forecasting a blue ocean event and everything else.
Why Invoke Wadhams?
Introducing extreme lowball forecasts (e.g. from Wadhams) serves only to make flawed model ensembles appear “reasonable” by comparison. But this rhetorical tactic distracts from the central issue: the models meant to inform policy, the IPCC, and public understanding have not performed well — and still don’t.
If mainstream models lack credibility, say that plainly. Don’t frame it as a hypothetical:
“Perhaps to be expected when the mainstream models are not providing credible projections?”
That should have been the subtitle:
“Mainstream CMIP models still do not provide credible projections for Arctic Sea Ice.”
Backward-Averaged Success?
You cite -11%/decade September sea ice area trend in CMIP6 (vs -13% observed) from 1979–2025 as evidence of “not bad” performance. But that’s a post hoc average, folding in newer data into older models. It tells us nothing about the forecasting skill of these models in real time. And it masks critical errors during the key period (2007–2012) when the models were most needed.
The issue isn’t whether CMIP6 looks better when smoothed over 45 years — it’s whether it can tell us anything reliable about 2025–2040. From the September % change spread you cite — clearly, it can’t.
Usefulness?
You quote the classic line:
“All models are wrong, but some are useful.”
Then please — quantify the usefulness. How useful were CMIP3–5 for Arctic sea ice? What impact did they have on IPCC projections, or on the scientific literature? What decisions were based on them?
More importantly: how is CMIP6 useful now — when the projected 2025 Arctic September ice loss ranges from ~5% to >100%? That isn’t predictive power — it’s noise. It suggests no practical understanding of how Arctic sea ice will behave in the next 12 months, let alone decades.
Discrepancies “Resolving Themselves”?
Gavin concludes:
“…these discrepancies will resolve themselves in the course of ‘normal’ model development… Or not ;-)”
This sounds flippant. Discrepancies don’t “resolve themselves.” Either:
— The physics improves,
— The parameters are constrained,
— The resolution is refined,
— Or the tuning is made more explicit.
Or else, the model remains wrong.
Worse, your statement seems to simultaneously defend the current ensemble and anticipate its future irrelevance. That’s not scientific humility — that’s hedging. And it weakens public trust.
Final Thoughts
You ask us to continue treating CMIP as the foundation of climate projection — yet when major failures persist for over 20 years, the response is: “They’re improving. Probably. Maybe. Let’s wait.”
That’s not good enough. We deserve:
— A clear technical post-mortem on CMIP3–5 sea ice errors;
— A transparent discussion of how CMIP6 was corrected (or tuned) in response;
— And a candid assessment of what confidence we should place in CMIP7.
Until then, it’s hard to see this as anything more than an exercise in statistical cosmetics.
It doesn’t matter how much lipstick you put on a pig — it’s still a pig.
The ensemble mean might look smoother now, but the model’s skill remains unresolved.
Accuracy is not the same as aesthetic.
Thank you for your scientific elaboration on the ‘coupled” issue that persists. The expression ” have your cake and eat it too” comes to mind.
Follow-up: Persistent Divergence Between Observations and CMIP6 Projections
One detail that still doesn’t get the attention it deserves: the last 18 years of observed September Arctic Sea Ice minimum trends (2007–2024) remain consistently out of step with the CMIP6 ensemble mean — not just as isolated years, but in the overall trajectory, both in magnitude and rate of change.
The observed decline is more stepwise and abrupt, especially around the 2007 and 2012 minima.
CMIP6 continues to show a smoother, more linear descent that fails to capture the inflection points of real-world losses.
Even today, the ensemble mean lags behind, while the observed data have flattened somewhat in recent years — a nuance CMIP6 doesn’t reflect either.
This persistent mismatch raises two key concerns:
Is CMIP6 tuned only to capture long-term averages, rather than decadal-scale dynamics, tipping points, or variability?
If so, how can it be considered useful for real-world policy, where near-term changes (like the prospect of ice-free Septembers before 2040) carry enormous implications?
We are not talking about modest noise here. The divergence is systematic and enduring, and yet rarely addressed in detail. Why? Until that gap is explained or reconciled, confidence in CMIP’s ASI projections seems… aspirational at best.
For instance, Stroeve et al. (2012) highlighted that earlier models underestimated the rate of sea ice loss, a trend that continues with CMIP6. Furthermore, Notz and SIMIP Community (2020) found that while CMIP6 models offer improved sensitivity estimates, they still fail to simulate a plausible evolution of sea-ice area alongside global mean surface temperature.
MPG.PuRe+7eesm.science.energy.gov+7NOAA Institutional Repository+7
This persistent mismatch raises questions about the models’ ability to accurately represent key processes affecting sea ice dynamics. Until these discrepancies are addressed, reliance on CMIP6 projections for policy-making and climate forecasting remains problematic.
Source Refs
https://eesm.science.energy.gov/publications/arctic-sea-ice-cmip6
https://repository.library.noaa.gov/view/noaa/29934
https://www.osti.gov/pages/biblio/1618526
https://epic.awi.de/id/eprint/51815/
https://link.springer.com/article/10.1007/s00376-022-1460-4
https://scispace.com/papers/arctic-sea-ice-in-cmip6-1t3idhfbxw
https://www.sciencedirect.com/science/article/pii/S1674927824000844
https://pure.mpg.de/rest/items/item_3221097_3/component/file_3231260/content
An assessment of the CMIP6 performance in simulating Arctic sea ice volume flux via Fram Strait
Evaluating the simulation capabilities of the most recent CMIP6 models in sea ice volume flux provides references for model applications and improvements. Meanwhile, reliable long-term simulation results of the ice volume flux contribute to a deeper understanding of the sea ice response to global climate change.
And note Fig.1
https://www.sciencedirect.com/science/article/pii/S1674927824000844
“Until these discrepancies are addressed, reliance on CMIP6 projections for policy-making and climate forecasting remains problematic.”
A question. What sort of policy-making might result from better sea ice model projections and improvements…a deeper understanding of global climate change?
Reply to Ken Towe
Great question — and you’re right to sense there’s a deeper conversation that should be occurring here. Here’s a response off the top of my head to:
> “What sort of policy-making might result from better sea ice model projections and improvements… a deeper understanding of global climate change?
—
Improved sea ice projections wouldn’t just refine academic understanding — they could significantly influence a range of policy decisions, especially those tied to regional risk management, climate adaptation, and strategic planning. Specifically:
1. **Shipping and Arctic Navigation**
Reliable sea ice forecasts are crucial for commercial and military navigation through the Arctic (e.g., the Northern Sea Route or Northwest Passage). Better projections inform infrastructure investments, safety protocols, and insurance risk calculations for Arctic shipping.
2. **National Security and Geopolitics**
Nations with Arctic interests (Russia, Canada, the U.S., China, etc.) rely on long-term projections to shape defense postures and territorial claims. Sea ice decline forecasts influence everything from military base placement to submarine patrol routes and sovereignty disputes.
3. **Indigenous and Coastal Communities**
Accurate modeling affects community planning for northern populations that depend on sea ice for transportation, hunting, and cultural survival. It also influences relocation policies and climate resilience funding.
4. **Climate Feedbacks and Carbon Budgets**
Arctic sea ice loss affects albedo (reflectivity), regional amplification, and atmospheric circulation patterns. Getting those dynamics right is key to projecting downstream climate impacts elsewhere — which in turn affects global carbon budget calculations, timelines for net-zero targets, and urgency behind emission cuts.
5. **Biodiversity and Ecosystem Protections**
Sea ice governs key marine ecosystems. Policy on fisheries management, marine protected areas, and species conservation — from polar bears to krill — depends on reliable predictions of habitat change.
6. **Credibility and Communication of Climate Risk**
When models repeatedly under- or over-predict key features like sea ice, it erodes public trust in climate science. More accurate, verifiable sea ice projections help rebuild that trust and improve how risks are communicated to policymakers and the public.
Over and above all that ASI changes influence global temperatures and our ability to provide short to medium term global temperature projections. Such knowledge should be feeding into everything from the IPCC work to understanding why the Paris Agreement and actions by the UNFCCC and COP system are deeply broken. The ASI and Antarctic SI projections of this CMIP6 remain so wrong. they not fit for any purpose.
So yes — better projections wouldn’t just be about “understanding” climate change. They would refine *practical, real-world decision-making* in domains that touch energy policy, defense, trade, indigenous rights, environmental protection. Along with global climate diplomacy and potentially practical action plans to address global warming itself.
Would you like to follow with your own points? I’d love to compare.
William said “Great question — and you’re right to sense there’s a deeper conversation that should be occurring here. Here’s a response off the top of my head to:
> “What sort of policy-making might result from better sea ice model projections and improvements… a deeper understanding of global climate change?”
Williams response that he claims is off the top of his head looks like it’s written by AI. I just asked google gemini the same question to test this, and got a remarkably similar response.
Does this mean that everything coming out of AI is wrong? Except when nigelj uses it. Maybe it means I was right and scientifically well grounded in my answers about Policy making. And maybe it means I have the finely tuned knowledge level of a Google Gemini AI on this particular topic. Because the answers I gave above were essentially off the top of my head. I certainly did not use Google Gemini as niglej did to create that comment-it was my very own thinking and knowledge that produced it.
On climate policy making:
Gemini agrees that if models used for Arctic sea ice projection — like those in CMIP6 — can’t capture abrupt events or exhibit extreme divergence across scenarios (e.g., from 5% to 100% ice loss by 2025), then their use in real-world planning is deeply compromised.
William’s comment shows how RealClimate fails to connect model claims to practical policy implications — and how communication gaps undercut informed decision-making across domains like shipping, national security, Indigenous livelihoods, biodiversity, and tipping points.
Gemini notes that William’s push for fitness-for-purpose — models that match the demands of real-world timing, scale, and risk sensitivity — is scientifically grounded and ethically urgent.
I note others on this forum have alternative opinions.
William: Does this mean that everything coming out of AI is wrong?”
It’s like DoGE firing all the air-traffic controllers and replacing them with an AI system known to malfunction and hallucinate, and then defending their action with: “Does this mean that everything coming out of AI is wrong?” You see the problem with this logic, right?
William, you miss the point, which is stop pretending information written by AI and copied and pasted is just “off the top of your head” – as in is you own piece of writing.
About “William, you miss the point, which is stop pretending information written by AI and copied and pasted is just “off the top of your head” – as in is you own piece of writing.”
nigelj has inverted the issue. The comment in question was my own original work—written and edited like any serious contribution. See William says 1 Jun 2025 at 6:29 PM above. Accusing it of being copied from AI is baseless, and more importantly, avoids the real topic.
The questions are:
1) How reliable are CMIP6 sea-ice projections?
2) What policy risks follow from inaccurate outputs?
3) What specific improvements might make them more useful?
Those questions were raised. Six policy examples were given. Rather than engaging them, the focus shifted to whether it was plausible someone could generate that answer without assistance—followed by accusations and deflection. That’s not scientific discussion. That’s misdirection.
And it proves the point: when the content is inconvenient, the tactic becomes to question the authorship, not the substance. If the models matter, then so do the critiques.
William: “This persistent mismatch raises questions about the models’ ability to accurately represent key processes affecting sea ice dynamics. Until these discrepancies are addressed, reliance on CMIP6 projections for policy-making and climate forecasting remains problematic.”
I can’t quite decide if this argument is an example of a Ignoratio elenchi (irrelevant conclusion, missing the point) fallacy, a straw man fallacy. or a logic chopping fallacy (nit-picking, trivial objections). In any case, the conclusion is unsupported by the given evidence.
Reply to Steven Emmerson
In your opinion — which, unlike William’s comments, is not supported by any actual evidence.
And that is assuming you even read (let alone understood) the references provided and the specific points William was drawing from. ( I don’t) Easier, I suppose, to wave it all away with a vague Hubristic Sniff about fallacies, while offering none of your own substantive counterpoints.
Prevarication isn’t rebuttal.
So… no counter-evidence, no engagement with the citations, no analysis of the actual claim — just a vague gesture at fallacies and a dismissive shrug. It doesn’t work — especially when the post you’re brushing off is better referenced and more rigorous than your own unsubstantiated opinions.
Gavin’s rhetorical fog was bad enough. Now it’s pea soup. Can’t see a thing. A forum being true to form.
PP: Gavin’s rhetorical fog was bad enough. Now it’s pea soup. Can’t see a thing. A forum being true to form.
BPL: You’re right, this is a horrible forum. If I were you, I’d leave and never come back. That’ll show ’em!
Pedro Prieto, William presented no credible evidence that discrepancies in current projections of Arctic sea ice necessarily implies that CMIP6 projections are problematic for policy-making in general. When to start shipping through the Arctic, perhaps. but not for addressing global warming.
Steven Emmerson says
1 Jun 2025 at 4:29 PM
William: “This persistent mismatch raises questions about the models’ ability to accurately represent key processes affecting sea ice dynamics. Until these discrepancies are addressed, reliance on CMIP6 projections for policy-making and climate forecasting remains problematic.”
SE: I can’t quite decide if this argument is an example of a Ignoratio elenchi (irrelevant conclusion, missing the point) fallacy, a straw man fallacy. or a logic chopping fallacy (nit-picking, trivial objections). In any case, the conclusion is unsupported by the given evidence.
Reply to Steven Emmerson
William: Dear Steven, please let me know if you would like a link to Google Gemini’s 13 page –
An Assessment of Predicted Arctic Sea Ice Trends and the Discourse on Climate Model Evolution
I believe it may assist you making a better informed decision. I’m happy to provide a specific assessment of “Follow-up: Persistent Divergence Between Observations and CMIP6 Projections” if you’d prefer. Please let me know.
William, Hitchen’s razor states “What can be asserted without evidence can also be dismissed without evidence”.
You’ve provided no credible evidence for your assertion that discrepancies in modeling Arctic sea ice necessarily implies that CMIP6 projections are problematic for policy-making in general.
Google Gemini output isn’t peer-reviewed.
Please post references to specific instances in the peer-reviewed scientific literature that support your assertion (quotations would be appreciated); otherwise, your assertion will be dismissed.
Steven Emmerson says
5 Jun 2025 at 2:14 PM
1) Hitchen’s razor states “What can be asserted without evidence can also be dismissed without evidence”.
Steven et al, that razor cuts both ways.
2) You’ve provided no credible evidence for your assertion that discrepancies in modeling Arctic sea ice necessarily implies that CMIP6 projections are problematic for policy-making in general.
Steven you are correct there. Yet barely anyone provides credible evidence for their assertions or opinions here. Why single me out? I must already have a target on my back, despite not ever engaging with you before.
I have posited my opinions on the matter, yes, opinions powerfully based on the science. You seem nonplussed. Content. No problem, but this does not mean I’m wrong though.
3) Google Gemini output isn’t peer-reviewed. Please post references to specific instances in the peer-reviewed scientific literature that support your assertion (quotations would be appreciated); otherwise, your assertion will be dismissed.
That is correct Steven. Nor are any of the dismissals in comments directed to me peer reviewed either. However, the Gemini output, and others like it (see Paul Pukite), do provide powerful references to specific instances in the peer-reviewed scientific literature that support my many assertions and opinions about this latest article. Some powerfully confirm my understanding of what net zero means is the correct one.
Steven I am more than happy to provide all those citations and quotations in due course. If I can get them past the ‘censor’. I can only do my my best Steven. It is a work in progress.
The question remains, even if I can get the material posted here, what will happen? Will it still be:
Dismissed without addressing the substance.
Generate more snark or insult in lieu of engagement.
Be ignored or slow-walked in mod approvals.
Have “tone” or “style” used as an excuse to avoid the content.
This is the pattern — not because I’m wrong, or proven wrong, but because what I share is inconvenient. What I have laid out is serious, informed, and deeply grounded in the scientific literature. It still always generates significant push back here–references to peer-reviewed scientific literature or not.
I have contributed much to the discourse here in a very short time. The pattern is I’m being continually baited with false accusations, with snark, ad hominem, veiled superiority. I cannot control any of that.
You may well say “quotations would be appreciated”, but I have no faith you or anyone else will look at them. I will provide them anyway. People will make their own choices, of course, which will reflect upon them, not me. Let’s see what happens then.
Are we still on net-zero? William, AIUI you ‘re conflating different things.
If I am piercing your fog of words, you think that CO2 concentrations will keep increasing until we hit net zero. Presumably that is because you think that net zero means that human emissions would equal removals from the atmosphere. But as Gavin explained, and IIRC, you yourself quoted:
So, net zero is NOT when total emissions balance total removals–which is tautologically the point at which concentrations begin to fall. It’s about the specifically anthropogenic components on each side of the ledger.
Actually, net zero has, strictly speaking, no logically necessary connection to rising or falling concentrations whatever. Let’s break it down.
First, let E denote total emissions, and R denote withdrawals. We’ll call the change in concentration delta(C), and ignore the mathematico-physical complications we’d need for a quantitatively accurate computation. Then, trivially if schematically:
E + R * -1 = delta(C)
But as stated, there are anthropogenic and natural fluxes both. I’m going to simplify by noting that currently at least, natural sinks exceed additions, so we can treat the net as a single quantity. falling under the ‘removals’ heading. Then:
(E(anthro) + (R(anthro) + R(natural)) * -1 = delta(C)
Right now, E(anthro) exceeds total R, of course, so delta(C) must be positive.
If we cut emissions–pray that that day comes soon!–there will come a point when removals equal those falling emissions. If emissions cuts continue past that point, then delta(C) turns negative. In practice, it’s likely that sinks will continue to function at some level; Gavin has told us that per modeling, the best estimate is that we would bring delta(C) to zero with an emissions cut of approximately 70%. You have responded, correctly, that we can’t know with a high degree of certainty whether or not sinks will be operating in the same manner as modelers are currently projecting.
In fact, it’s conceivable that the natural fluxes could turn positive. We think that’s an extreme possibility, but it’s a contingency that as far as we know is at least possible, even if it isn’t seen as probable in the next decade or so. Then, of course, we could be at net zero, and concentrations would still be rising. I’ll spare us all the mathematical formalism at this point; I think we all get the idea.
This is of course the dreaded “tipping points” scenario: the Amazon converts to savannah and releases a big pulse of CO2, or large quantities of clathrates outgas releasing methane by the teratonne into the water column of the Arctic ocean, or whatever the case. For a time, at least, there’s nothing we can do to mitigate the rising concentrations. (It doesn’t necessarily go on forever; the Amazon basin is big, but at some point conversion stops. Of course, it may trigger other tipping points; IIRC, there are something like 17 that have been identified.)
Contrariwise, maybe we’ve missed a negative feedback, or underestimated it significantly. In that case, presumably we’d see concentrations start to fall with a smaller cut to emissions than the estimated 70%. That’d qualify as a lucky break, and we obviously shouldn’t proceed on that basis: we need to cut emissions as fast as we can.
So, we don’t think that we need to get to net zero to see concentrations start to fall; we think that we need to get below about 70% of current emissions. (We can’t stop there, though, because as Gavin also pointed out, temperatures won’t stabilize at that point, and feedbacks are driven by those temps, meaning sinks may be impaired while temps are still rising.)
But scenarios in which we could be at net zero and still see concentrations rising are also possible.
I fear I’ve created a bit of a fog of words myself here. But I hope it does demonstrate that, as Gavin said, net zero and rising or falling concentrations of CO2 are indeed “different things.”
Now, can we please move on?
Kevin McKinney says
6 Jun 2025 at 8:41 PM
Are we still on net-zero?
Well Steven and William weren’t. So it’s only you on this page talking about Net Zero.
No one else is. Or did see a big red target on William’s back?
(Due to nesting limitations, I’m having to reply to my own post.)
Quotes are from William.
Not really. Hitchen’s razor is asymmetric because it puts the onus of providing evidence on the person making the assertion and not the other way around.
You’re “singled out” because you made an assertion without providing any evidence. Application of Hitchen’s razor is common practice in Science (as anyone who’s ever defended a thesis or dissertation can attest).
It means that your opinion can be dismissed.
Irrelevant because it doesn’t address the issue, which is your assertion that discrepancies in modeling Arctic sea ice necessarily implies that CMIP6 projections are problematic for policy-making in general.
Irrelevant for the same reason.
It’s a shame how the small error with the url derailed Pedro’s comment as the points he was making and referencing were good ones. Including this- Scrutiny is not denial. Critiquing poor model performance is scientific due diligence, not heresy. And holding public scientists to higher standards of clarity, transparency, and engagement only strengthens public trust — it doesn’t erode it.
I’d suggest doing the opposite does. To that end, this comment now also relates to what John N-G says 1 Jun 2025 at 1:24 PM had to say below to Pedro.
Despite the key findings from the paper (Notz et al., 2020) mentioned below the post just by me, already pointed to multiple other CMIP6 evaluation sources. I think there is no hard ‘consensus’ on the efficacy on everything to do with CMIP6 and ASI. I mean even Dirk Notz’s conclusions and highlights vary across his own analyses.
for example, one of the links I posted above already pointed to this Geophysical Research Letter.
Arctic Sea Ice in CMIP6
2020
By Notz, Dirk ; Community, SIMIP ORCID ICON IMG
Source: GeophysicalResearch Letters,47, e2019GL086749.
https://repository.library.noaa.gov/view/noaa/29934
Which among many things worth being aware of is the Conclusion:
• CMIP6 model performance in simulating Arctic sea ice is similar to CMIP3 and CMIP5 model performance in many aspects.
-This includes models simulating a wide spread of mean sea-ice area and volume in March and September;
-the models’ general underestimation of the sensitivity of September sea-ice area to a given amount of global warming;
-and most models’ failure to simulate at the same time a plausible evolution of sea-ice area and of GMST.
and
• CMIP6 model performance differs from CMIP3 and CMIP5 in some aspects.
-It is unclear to what degree these improvements are caused by a change in the forcing versus improvement of model physics.
Improved, yes, definitely fit for purpose, and performance above and beyond the CMIP3/5 results; Not so much.
And it’s worth realizing this Abstract note from another of the links I posted above:
“Still, most CMIP6 models fail to simulate at the same time a plausible evolution of sea‐ice area and of global mean surface temperature.”
https://epic.awi.de/id/eprint/51815/
Oh sorry, it’s from the very same Notz article. Is it not ironic how so many things are sitting there in plain sight? I leant this from all the papers I used to read decades past. Sometimes your eyes can just glaze over and you can so easily miss things.
I wonder what new technical tools we could develop that would be more reliable to capture important points across domains, sources from the millions of science articles and peer-reviewed scientific research papers?
Maybe one day they will think of something that is far superior to internet google searches.
WIlliam: “ It’s a shame how the small error with the url derailed Pedro’s comment as [his] points were good ones”
The problem was not your wrong url – but with the claims your declare “good”. Details in: 3 Jun 2025 at 1:26 PM. And in the follow-up immediately below ( Piotr 5 Jun 2025 at 9:05 PM).
Thanks for an article on my favourite topic Gavin!
I heartily recommend an additional reference, which perhaps goes some way to explaining the significant excursions below the September trend in 2007 and 2012?
0. C. M. Bitz and G. H. Roe, “A Mechanism for the High Rate of Sea Ice Thinning in the Arctic Ocean”, Journal of Climate 2004
https://www.atmos.washington.edu/~bitz/Bitz_and_Roe_2004.pdf
“A general theory is developed to describe the thinning of sea ice subjected to climate perturbations, and it is found that the leading component of the thickness dependence of the thinning is due to the basic thermodynamics of sea ice. When perturbed, sea ice returns to its equilibrium thickness by adjusting its growth rate. The growth–thickness relationship is stabilizing and hence can be reckoned as a negative feedback. The feedback is stronger for thinner ice, which is known to adjust more quickly to perturbations than thicker ice. In addition, thinner ice need not thin much to increase its growth rate a great deal, thereby establishing a new equilibrium with relatively little change in thickness. In contrast, thicker ice must thin much more. An analysis of a series of models, with physics ranging from very simple to highly complex, indicates that this growth–thickness feedback is the key to explaining the models’ relatively high rate of thinning in the central Arctic compared to thinner ice in the subpolar seas.”
”
Perhaps it also helps explain the alleged “pause” in Arctic sea ice decline, so popular in cryodenialistic echo chambers at the moment?
Link: https://agupubs.onlinelibrary.wiley.com/doi/pdf/10.1029/2020GL087965
Key findings from the paper (Notz et al., 2020):
No significant improvement in Arctic sea ice projections between CMIP5 and CMIP6.
“Models that participate in CMIP6 do not show a clear improvement in simulating observed sea‐ice trends over recent decades compared to models from earlier phases of CMIP.”
Still too much Arctic sea ice in CMIP6 simulations for recent decades.
The models systematically overestimate September sea ice extent compared to observations. Same problem as before.
Antarctic sea ice is still mishandled:
The observed increase from 1979 to ~2015 is not captured in the models — which instead show a decrease. That’s a complete miss.
So… What Is Going On? What is the purpose of this article here now?
It’s a little suspicious:
Damage control / reputation management: CMIP3–5 have been (rightly) criticized for years — particularly in terms of Arctic sea ice projections. CMIP6 was supposed to be better. It’s not — at least not clearly — so some scientists may now be trying to massage that narrative.
Preemptive narrative setting: With CMIP7 now being discussed, this may be a way to gently sweep past failures under the rug and frame them as “normal model evolution” — a soft reset, rather than an admission of serious structural flaws or poor tuning.
Defensive posture disguised as openness: Gavin’s tone seems reflective and modest — but the actual content is evasive, hand-wavy, and deflects scrutiny. Mentioning Peter Wadhams as a foil is a distraction tactic, not a serious engagement with past model failure.
Audience management: RC serves both policymakers and laypeople, many of whom are not model specialists. A vaguely reassuring tone — “things are improving” — reduces anxiety and protects institutional credibility, even if it glosses over fundamental problems.
Combine that with vague language like:
“…discrepancies will resolve themselves… Or not ;-)”
and
“…models are always wrong, but still useful…”
— and you’re left with a kind of rhetorical fog machine: soften the failures, spotlight only the ensemble mean, and dodge the hard accounting.
The framing of this post — and the timing — doesn’t quite add up. Compared to dozens of other pressing climate concerns, why this topic, and why now? Five years on from CMIP6, its performance in simulating Arctic and Antarctic sea ice (extent, concentration, and trends) remains poor. It has shown little demonstrable skill in predicting critical inflection points like blue ocean events — and the record hasn’t meaningfully improved since CMIP5.
That the 2020 paper linked here flatly contradicts any claim of serious CMIP6 improvement is telling. The issues have all been covered before in dozens of similar papers.
One of the quieter scandals in climate science communication — particularly around modeling — is how little post-hoc accountability or rigorous performance review takes place. For all the resources poured into CMIP modeling, almost no one in the mainstream is willing to step back and plainly ask:
“How well did these projections actually match reality over the past 10 to 20 years?”
Even serious published critiques (like Notz et al. 2020) are rarely engaged with in public-facing commentary. The pressure to preserve institutional credibility — and to avoid feeding denialist talking points — often leads to a kind of professional omertà: silence, spin, or deflection.
But here’s the truth:
Scrutiny is not denial.
Critiquing poor model performance is scientific due diligence, not heresy.
And holding public scientists to higher standards of clarity, transparency, and engagement only strengthens public trust — it doesn’t erode it.
One day it might begin to happen. Until then there will be no looking under the climate models hood.
Multi-troll: “Key findings from the paper (Notz et al., 2020): No significant improvement in Arctic sea ice projections between CMIP5 and CMIP6.”
and … what statistical criteria have you, or your source, used to determine the “insignificance” of the improvement? Because if you/your source didn’t – then you are using this word in the unscientific, colloquial meaning, of how it LOOKS to you. Which would make it a SUBJECTIVE (i.e. untestable) OPINION. Something along the lines of Chico Marx chiding a women surprised to see him in her bedroom:
– But I saw you [leaving the bedroom] with my own eyes!
– Well, who ya gonna believe me or your own eyes [Fig. 2 vs Fig. 3]?”
Multi-troll: “But here’s the truth: Scrutiny is not denial. Critiquing poor model performance is scientific due diligence, not heresy.”
But using the imperfect model representation of one of the most difficult to replicate outcomes of AGW (change in the sea-ice cover area) to question the credibility of ALL AGW modelling, in order to DISMISS the sense of reductions in GHG emissions using existing technologies and implementable mechanisms (price on GHG emissions) – is a MAINSTAY of DENIALISM – deniers focus on some not necessarily crucial aspect – to throw the entire AGW modelling, and the need to reduce GHGs, with the bathwater.
But it is been already discussed on RC to death, E.g.
==== UV, May 2025 =============
– William: “ I’m not a denier”
– me: “We don’t have to rely on your self-serving declarations, your posts would do: you have just tried to discredit the only feasible way to mitigate AGW (by calling the reductions in GHGs NEITHER “ feasible [nor] wise“, and justified it by saying that they merely “treat symptoms, not causes“) in favour of an alternative [rapid deindustrialization and reduction of population by many billions] THAT YOU KNOW cannot be realistically implemented on the necessary time-scale [next 1-2 decades].
Which is a very definition of an “anything-but-GHGs denier“.
=================================
“to DISMISS the sense of reductions in GHG emissions using existing technologies” …and to throw the entire AGW modelling, and the need to reduce GHGs, [out] with the bathwater.”
Surely, you are aware of the fact that rapid reductions in CO2 emissions will take none of the CO2 already added (420 ppm) out of the atmosphere to lower global temperatures. It does leave carbon in the ground, But that makes it more expensive and difficult for transportation to continue the energy transition to renewables and EVs.
KT: rapid reductions in CO2 emissions will take none of the CO2 already added (420 ppm) out of the atmosphere to lower global temperatures. It does leave carbon in the ground, But that makes it more expensive and difficult for transportation to continue the energy transition to renewables and EVs.
BPL: Transportation can be electrified or work off alternate fuels. Your “we need more fossil fuels to transition to a world without fossil fuels” doesn’t make any sense.
Mr. Levenson…Try doing anything of consequence without using vehicles that run on fossil fuels..Feed eight billion people for example. Install solar and wind farm projects.
KT: Try doing anything of consequence without using vehicles that run on fossil fuels..Feed eight billion people for example. Install solar and wind farm projects.
BPL: Try doing transportation for millions of people without using horse-drawn buggies, surreys, and stage coaches.
With respect to EVs, my wife recently wanted me to form an opinion about the complete life cycle analysis of EVs and the infrastructure required to support them. Because this is recent, I haven’t yet had the time to properly consume and then assemble things in mind.
But the following are a few of what I’ve encountered so far and felt able to present here:
“Electric vehicles from life cycle and circular economy perspectives”, 2018
https://www.eea.europa.eu/en/analysis/publications/electric-vehicles-from-life-cycle
“Analysis of the Life Cycle and Circular Economy Strategies for Batteries Adopted by the Main Electric Vehicle Manufacturers”, 2025
https://www.mdpi.com/2071-1050/17/8/3428
“The Future of Copper: Will the looming supply gap short-circuit the energy transition?”, 2022
https://cdn.ihsmarkit.com/www/pdf/0722/The-Future-of-Copper_Full-Report_14July2022.pdf
and a related summary article to the above report on copper:
https://www.engineering.com/copper-the-critical-material-for-transportation-electrification/
I’m only just starting to assemble materials and I’ve had only a little time to skim the above, yet. But I think they may relate to this question about electrification and EVs. (I’m not addressing ‘alternate fuels.’) Perhaps those are worth a moment, though.
I have had (because I’m an engineer who worked on designing aspects of substation transformers in the past) frequent conversations with my local power company, Portland General Electric, at an “internal staff” level of conversation about the substantial alterations and difficulties involved in the distribution of electrical power for EVs and hybrid vehicles. These discussions included the “final mile” part of it, as well.
Some people are buying class II charging systems. A Ford F-150 Lightning requires a class II charger with at least an 80 amp service. Class I charging systems are based on standard mains supply voltages, but they are for plug in hybrids, by and large, and would take a very long time for charging something like an F-150. My Prius hybrid uses a Class I charger and takes about 6 hours to charge. And it only has about 25 miles of range in its small battery. EVs have much larger battery systems and will generally require Class II service at home.(Class III is an EV service station and wouldn’t be for home use.)
Class II chargers are generally on the order of 100-200 amps service. For comparison, my entire household is a 200 amp service. If I were to purchase that Ford F-150 Lightning, I would have to work with PGE to upgrade my service to 320 amps or to go to a 7 kV drop service in order to support the Class II charger that comes with it. At any scale, this presents significant challenges to PGE (or any power company), despite the fact that they may be able to then use (with cooperation) these EV vehicles as a storage resource for load balancing.
(I live in a forest canopy system and at the 45th parallel. So solar is not in the cards.)
Don’t get me wrong. PGE would like lots of people to get EVs. Peak load is a significant problem and they wouldn’t even have to buy all that battery capacity. What’s not to love? But the infrastructure changes remain quite significant and those changes will take a great deal of time and money. I know firsthand some of these difficulties because I design aspects of the transformers used in substations.
From my personal discussions with PGE and from the above articles, I am gathering that, at the scale and time-line required, this is a ‘hard problem.’ I’m frankly not at all confident at this moment in time. Perhaps that will change. But that’s where I’m at, now.
My only unique contribution in science was almost a decade back, on ADEX theory relating to error correction theory and packing spheres. I’m otherwise just an applied mathematician and practicing engineer. I enjoyed my time as a team member of the group that produced the first commercially practical re-writable CDROM. Because I have some knowledge of condensed matter physics, singlet/triplet state transitions, and the impact of phonons on phosphor crystal lattices I helped design an instrument measuring reentry temperatures for the US Space Shuttle. I otherwise designed instrumentation for commercial and scientific needs. This just means I’m exposed to a few ideas by some truly bright folks with whom I’ve had the privilege bring around.
I don’t have a working crystal ball. But my gut tells me that without a global political change I don’t expect to see, I just don’t see it happening quickly enough. (Or at all. Not at scale, anyway, and not in time.)
That’s where I’m at, right now.
So I do not share your confidence in our ability to field electrification and EVs at the scale and rate needed to have a significant impact on CO2 on the relatively shorter order of time we need. And to quote one of the documents I mentioned above:
“In general, GHG emissions associated with the raw materials and production stage of BEVs are 1.3-2 times higher than for ICEVs (Ellingsen et al., 2016; Kim et al., 2016)…”
In addition, there’s the mix of electrical energy sources used to charge vehicles (that will vary over area and time, obviously), their life time, usage patterns, and recycling at end of life, among many other factors. But I’m sure it is not a slam-dunk.
Jon Kirwan,
I may reference your comment on the UV thread with more detail, but you really need to do some basic research on the F 150 charging system and basic house wiring. Your numbers are incorrect. The vehicle comes with a level II charger that only requires a 50A circuit (like an electric stove).
Ken Towe: “ Surely, you are aware of the fact that rapid reductions in CO2 emissions will take none of the CO2 already added (420 ppm) out of the atmosphere
Surely, you are aware of the fact that I have taken apart the same argument when you were making it two weeks before. Let me refresh your memory:
=====
Ken Towe 17 May: “GHG reductions, reducing emissions, will take none of the CO2 already added out of the atmosphere”
Piotr 18 May: “First – if large enough – they WILL result in the taking down CO2 already in the atmosphere – as natural uptake will no longer be overpowered by the new human emissions – currently only half of the emitted CO2 stays in the air the reset is absorbed by the natural sinks.
Second – yours is a typical denier/doomer all-or-nothing argument – if we can’t reduce the current levels of CO2 then let’s do nothing and keep increasing atm. Co2. The obvious and fallacy here is that the world at 425ppm won’t be as hellish as the world at 850 ppm.
So you are like a man who stabs his neighbour with a knife, justifies his refusal to stem the bleeding by saying that it would be pointless, since “ it will not bring back any blood you already lost and therefore he plans to continue stabbing the victim until he is dead.
=== end of quote =====
To which, other than crying how the other posters are mean to you (you characterizing the above as “ personal insults” ;-)) – you had NO answer to the above FALSIFIABLE arguments.
Nor had your defender, as in his powerful intellect he understood the above as me …. having to admit that his Ken was right:
Multi-Troll (“Thesallonia”): “ Piotr acknowledged that CO₂ will decline slowly once emissions stop — which aligns with what Ken said.”
So unable to defend your claim in the original thread – you repeat it, hoping for a different outcome? You know the definition of what is this? ;-)
Reply to readers
Catastrophic climate change impacts are always local, not global.
a reminder from https://climateandeconomy.com
Mindful that nothing that the above cheap troll does has any effect on anything. He is just another self-infatuated bloviating bullshit artist who loves to hear himself talk and has done nothing but praise himself and insult everyone else since the day he arrived at RC. He is a boor and a bore, and his comments are worthless and empty.
Hat tip to secular animist for the above content he posted. Imitation is the most sincere form of praise.
Pedro prietos depiction of Piotr is wildly inaccurate, and is just a classic example of psychological projection.
William reply about Piotr’s comment:
So now he’s quoting me from another thread while I was replying to a different person on a different topic entirely, ignoring the whole of what Pedro Pietro wrote here. From that he is constructing a fantasy mashup of motivations, identities, and imagined threats to climate science. Piotr left the realm of reasoned argument and crossed into performance art. Even worse.
Let me make it simple for everyone else: while backing up Pedro’s rational framing and genuine concerns.
“Critiquing poor model performance is scientific due diligence, not heresy.”
Everyone has a basic human right to question what’s produced. That does not equate to denying all climate modeling as is being falsely alleged here against Pedro — and, I suspect, myself as well. It’s honestly hard to follow the total lack of coherence and all-caps intolerance Piotr brings to the table. Nor does that comment, made in good faith, justify the paranoid screed he launched into.
If he can’t tell the difference between scientific scrutiny and denialism, maybe he should stop imagining he’s the arbiter of either.
Finally, Piotr didn’t engage with any of Pedro’s conclusions or actual opinions. We all have opinions — even Piotr (God help us) — but all he’s staged here is yet another slapstick routine from the Marx Brothers movie playing in his head. He has no arguments. No logic. It’s just projection, all the time. That’s his ongoing contribution to this forum: constant trolling. It’s better ignored — or better yet, binned.
William and his multiple sock puppets (pieto principle, ned kelly, dharma, and others) has on many occasions dismissed climate models as useless. Check the archives for yourselves. He doesn’t say some climate models or a particular climate model. It’s just climate models are useless, failed, hopelessly inaccurate. When confronted with this he changes his name and pretends he never said it.
W: He [Piotr] has no arguments. No logic. It’s just projection, all the time.
BPL: I find he always has an argument. There’s one further up in this very thread, where he is clearly laying out a logical argument about natural uptake of carbon dioxide. If you’re going to accuse someone of not doing something, it’s kind of dumb to make the accusation in the same thread where he’s doing that very thing.
William just throws mud, hoping some of it will stick.
Pedro –
The link you provided is to Shu et al. (2020), which does not include your quoted key finding but instead says, “The observed Arctic September SIE declining trend (−0.82 ± 0.18 million km2 per
decade) between 1979 and 2014 is slightly underestimated in CMIP6 models (−0.70 ± 0.06 million km2 per
decade),” which sounds pretty good to me.
The most plausible Notz et al. (2020), titled “Arctic Sea Ice in CMIP6” (https://agupubs.onlinelibrary.wiley.com/doi/full/10.1029/2019GL086749) doesn’t include your quoted key finding either but instead says, “In particular, the latest generation of models performs better than models from previous generations at simulating the sea-ice loss for a given amount of CO2 emissions and for a given amount of global warming.”
A shocker… Or not.
Thanks, Dr. N-G.
Reply to John N-G
Apologies that seems to be a sticky copy paste url. Your url is correct: https://agupubs.onlinelibrary.wiley.com/doi/full/10.1029/2019GL086749 or
https://repository.library.noaa.gov/view/noaa/29934 or
https://par.nsf.gov/servlets/purl/10173113
And I didn’t convey my meaning or sources accurately either, I was in a rush, sorry.
I covered broader ground and cannot detail every point I’ve seen related to or in Notz et al accurately here, sorry. It’s old news anyway, long ignored. Feel free to draw your own conclusions based on what you choose to read and check yourself.
Try for example the above quote you mention came from: Arctic Sea Ice in CMIP6
https://scispace.com/papers/arctic-sea-ice-in-cmip6-1t3idhfbxw
TL;DR: In this article, the authors examined CMIP6 simulations of Arctic sea ice area and volume and found that most models fail to simulate at the same time a plausible evolution of sea-ice area and of global mean surface temperature.
Challenges in Simulating Sea Ice and Temperature: Despite the advancements, most CMIP6 models struggle to simultaneously simulate a realistic evolution of both sea-ice area and global mean surface temperature. This discrepancy highlights ongoing challenges in climate modeling.
Sensitivity Metrics Comparison: When comparing sensitivity metrics between CMIP6 and previous CMIP phases, it is generally difficult to distinguish CMIP6 models from those in CMIP5, except for a few highly sensitive simulations. This suggests that while some models have improved, the overall sensitivity landscape remains similar.
This: “Models that participate in CMIP6 do not show a clear improvement in simulating observed sea‐ice trends over recent decades compared to models from earlier phases of CMIP.” is out there somewhere. No time to chase, sorry. The questions and info provided by william may be useful to balance the positive only professional omertà. As he points out the 95% CI range is implausible and the last 18 years results (mini mean trend line) remain far below the ensemble mean even if not as bad as CMIP3 and 5 were.
Still, most CMIP6 models fail to simulate at the same time a plausible evolution of sea-ice area and of global mean surface temperature.
see https://eesm.science.energy.gov/publications/arctic-sea-ice-cmip6
but some simulate implausible historical mean states compared to satellite observations, leading to large intermodel spread. Summer SIA is consistently biased low across the ensemble. Compared to the previous model generation (CMIP5), the intermodel spread in winter and summer SIA has reduced, and the regional distribution of sea ice concentration has improved.
https://www.bas.ac.uk/data/our-data/publication/antarctic-sea-ice-area-in-cmip6/
As a whole, the models successfully capture some elements of the observed seasonal cycle of sea ice but underestimate the summer minimum sea ice area. – Models project sea ice loss over the 21st century in all scenarios, but confidence in the rate of loss is limited, as most models show stronger global warming trends than observed over the recent historical period.
https://www.x-mol.net/paper/article/1251324725277122560
There are more of course but it’s unlikely anyone commenting would be interested here anyway.
There remains more important issues than messy ref urls and expecting any independent person on a forum without the resources of NASA-GISS et all to perfectly convey over 5 years of critical discussions of CMIP6 and sea ice extent at the poles.
I repeat the issue is more about _ “— and you’re left with a kind of rhetorical fog machine: soften the failures, spotlight only the ensemble mean, and dodge the hard accounting.
The framing of this post — and the timing — doesn’t quite add up. Compared to dozens of other pressing climate concerns, why this topic, and why now?”
It’s old news and everyone in the field already knew these CMIP6 sea ice data were still not useful or reliably accurate. The same as Gavin’s 2023-2024 global mean temperature projections were not accurate. Or rather a dismal failure and like CMIP6 (5 and 3) they still cannot work out why.
“But trust me, the cheque is in the mail.”
PP: everyone in the field already knew these CMIP6 sea ice data were still not useful or reliably accurate.
BPL: Predicting an 11% decline when it was actually 13% is “not useful or reliably accurate?” Depends on what your standards for “not useful or reliably accurate” are, doesn’t it?
BPL, exactly right. Predictions will never be 100% accurate, so that gives PP an excuse to constantly complain that things aren’t perfect, and hear the sound of his own voice, and make like he’s saying something useful.
And right on cue here is nigelj again making it all personal maligning Pedro with his niono-stop ad homin attacks.
nigelj says
2 Jun 2025 at 2:42 PM
BPL, exactly right. Predictions will never be 100% accurate, so that gives PP an excuse to constantly complain that things aren’t perfect, and hear the sound of his own voice, and make like he’s saying something useful.
100% psychological projection. 0% science. 0% facts. nigelj assigning motivations, intentions and thoughts to others he has absolutely no knowledge of.
This is 100% a personal ad hominem attack. Now, what did I just say a few minutes back? He does it to everyone. I hope that gets posted.
It’s not the only time Nigel is caught out “Making it about [others]” in action, given he is doing it all the time.
Barton and nigelj together hoisted with their own petard. Kaboom!
>> Barton Paul Levenson says Predicting an 11% decline when it was actually 13% is “not useful or reliably accurate?”
>> nigelj says BPL, exactly right.
No it is not, this is not the output of the models as shown in Figure 3!
They predict anything between 2% to 40% change per decade with 95% probability.
I would recommend that G. Schmidt adds the uncertainties to his values as apparently readers here get confused easily.
Williams post 2 Jun 2025 at 8:50 PM
N: “BPL, exactly right. Predictions will never be 100% accurate, so that gives PP an excuse to constantly complain that things aren’t perfect, and hear the sound of his own voice, and make like he’s saying something useful.”
W: 100% psychological projection. 0% science. 0% facts. nigelj assigning motivations, intentions and thoughts to others he has absolutely no knowledge of.
N: For years William and his team of sock puppets has complained about problems / imperfections in the models, in a general sense rarely ever specific, despite the fact every scientist knows this and acknowledges models are imperfect. Why would William do that, if not to sound important and hear the sound of his own voice? Or to undermine the science?
W: “This is 100% a personal ad hominem attack. Now, what did I just say a few minutes back? He does it to everyone. I hope that gets posted.”
N: My comment is not an ad hominem, (an attack on the person rather than proving their argument is wrong.) His argument is models are imperfect. I actually accepted they are imperfect (predictions will never be 100% inaccurate). My comment was about motive.
Pedro Prieto says
1 Jun 2025 at 7:54 PM
Reply to Pedro Prieto from William:
Pedro — thanks for clarifying and for pulling together that mix of sources. No apology needed — your framing adds important texture to what’s been an oddly sanitized conversation. The fact that multiple CMIP6 evaluations, including those you cited, show that most models still can’t reconcile sea-ice evolution with global temperature trends should raise eyebrows. But in many circles, even pointing that out gets treated like heresy.
You’re not being unfair — you’re being scientific. Healthy science requires critique, especially when tools that shape policy (like climate models) continue to misfire in known ways. Asking for accuracy and transparency isn’t “denial” — it’s accountability. If models can’t replicate known history reliably, confidence in their forward projections should rightly be qualified. Yet somehow, skepticism about model output gets labeled as skepticism about climate reality itself — which is neither logical nor helpful.
It’s also worth underscoring your broader concern: the rhetorical fog that clouds this space. When model ensembles are smoothed, contradictions downplayed, and known weaknesses framed as “improvements,” it begins to resemble branding more than science. You’re not the only one who sees it. Many readers — especially younger scientists, data-savvy observers, and quiet lurkers — are just waiting for someone to say what you just did: plainly, calmly, and with integrity.
So again — appreciate your voice. Not everyone can afford to push back publicly, and those who do are often caricatured. But that just shows how badly the field needs this kind of grounded critique. Take care and if you disappear I totally understand, as will many many others.
Pedro the Troll 1 Jun: “ Key findings from the paper (Notz et al., 2020):
No significant improvement in Arctic sea ice projections between CMIP5 and CMIP6.
“Models that participate in CMIP6 do not show a clear improvement in simulating observed sea‐ice trends over recent decades compared to models from earlier phases of CMIP. ”
John, pointed out that Notz et al. does NOT CONTAIN THAT QUOTE, and its “key finding” are if antyhing OPPOSITE:
Notz et al.: “In particular, the latest generation of models performs better than models from previous generations” vs. Pedro’s claim that Notz et al found” No clear improvement”
Which is important here, because the supposed IGNORING “”serious published critiques, like Notz et al. 2020 by Gavin and others was Pedro’s ONLY proof of his accusations toward them, e.g.:
– “Damage control / reputation management”
-“Massage the narrative”
– “Preemptive narrative setting”
– inability to admit: “serious structural flaws or poor tuning”
– “Defensive posture disguised as openness”
– “evasive, hand-wavy, and deflects scrutiny.”
-“Audience management: [message massaged to] “reduce anxiety and protect institutional credibility, even if it glosses over fundamental problems”
— “rhetorical fog machine: soften the failures, spotlight only the ensemble mean, and dodge the hard accounting.”
– “One of the quieter scandals in climate science communication”
-” Even serious published critiques (like Notz et al. 2020) [sic! – PIotr] are rarely engaged with in public-facing commentary. The pressure to preserve institutional credibility — and to avoid feeding denialist talking points — often leads to a kind of professional omertà: silence, spin, or deflection.”
With Pedro’s only “proof” – ignoring “key finding” of Notz et al. – already falsified by John, Pedro the Troll:
– excuses himself for .. being “in a rush”, which …. didn’t stop him from typing two screenfulls of attacks later in the same post;
– cannot remember from which source he quoted …. half a day earlier;
– blames his giving false sources for the claims he used on …. not having having “NASA-GISS et al.” resources;
– and is not particularly motivated to find the “serious publication” on the ignoring of which he just built his accusations (now it’s: “ is out there somewhere. No time to chase, sorry“)
P.S. I am sure the real Pedro Prieto would be proud of what you have been writing UNDER HIS NAME.
Reply to Piotr
3 Jun 2025 at 1:26 PM
William: I could not quite follow that. Would you please explain more clearly, as it is too scattered for me to follow.
Thanks.
Note on Notz et al. (2020):
This paper examines Arctic sea ice trends in CMIP5 and CMIP6 models, specifically analyzing how modeled sea ice loss relates to modeled global mean surface temperature (GMST). It does not directly compare the models’ GMST outputs to observational temperature datasets like GISTEMP or HadCRUT. Instead, it focuses on internal model behavior and consistency across ensemble members. However, observed sea ice extent and area (e.g., from NSIDC) are used as a reference for evaluating modeled sea ice trends.
Notz et al. (2020) paper on Arctic sea ice in CMIP6 :
Compares the sea ice–temperature relationships across models — that is, how each model’s own global mean surface temperature (GMST) relates to its own simulated sea ice extent (SIE).
In other words, they are not evaluating how well each model’s temperatures align with observed global temperatures, nor how well sea ice simulations align with observed sea ice trends at the same level of actual global warming.
Here’s the key methodological excerpt (paraphrased for clarity):
“We consider sea‐ice area and global mean surface air temperature as simulated by each model… This allows us to determine the simulated sensitivity of Arctic sea‐ice area to warming for each model.”
Those details as if hidden away in these research papers and not found in the Abstract nor the Conclusions sections.
“William”: I could not quite follow that. Would you please explain more clearly, as it is too scattered for me to follow.
Why? My text should be easy to follow by Pedro Prieto, whose actions and integrity I challenged.. You are “William”, not “Pedro P.”, remember?
But if you want – here is my incomprehensible (to you) post:
Piotr 3 Jun 2025 at 1:26 PM
in which I alternate quotes from Pedro Prieto with my questions to these quotes – give it a college try. If you still fail – I don’t know what else to suggest. Ask a friend to explain it you.
Or if they are stumped too – I have heard good things about AI models^*?
==
*^ “[Open AI] models defy human commands, actively resist orders to shut down”
**^ In prerelease tests in one AI company, when its AI was told it would be replaced in 84% of times it tried to avert it by blackmailing the engineers with the affair it thought the engineers had (the system had access to their emails) :https://www.cnn.com/2025/06/04/business/video/ai-models-new-behavior-humans-blackmail-prevent-shutdown-digvid
Re. “scrutiny is not denial”…In ANY area of science when we are talking bleeding edge, it takes a _qualified expert_ to do the “scrutinizing”. And, as you may or may not know it takes being in possession of a huge knowledge and skill base that takes years and even decades to master..
Did you do your homework?
jgnfld: as you may or may not know it takes being in possession of a huge knowledge and skill base that takes years and even decades to master..
That’s an essential point. Few deniers or doomers have put the time and effort in to become genuine experts on that of which they speak. Even published experts know their limitations, and depend on their specialist peers for bleeding edge judgements on knowledge and skills they themselves haven’t mastered.
We are fortunate to have Prof. Nielsen-Gammon with us. As Texas State Climatologist, he is a qualified expert on the geophysics of climate change if anyone is. Yet while he has published research on diverse phenomena including sea ice, he acknowledges that he’s not an expert on every climate-related topic. When he’s evaluating a claim that’s beyond his own knowledge, rather than trying to become comprehensively literate on everything that’s known about that topic, he relies on scientific meta-literacy. He spoke at AGU 2012 about it, then wrote a blog post, now only available from the Wayback Machine:
web.archive.org/web/20130213192911/https://blog.chron.com/climateabyss/2013/02/scientific-meta-literacy
Excerpt:
There are, perhaps, less than a thousand people worldwide who know enough about climate change’s impacts on tropical cyclones, extratropical transitions, wind speeds, rainfall rates, and sea level rise to qualify them to evaluate that statement [about Superstorm Sandy]. It’s not even clear that I’m one of them! The requisite level of climate literacy is enormous.
But there’s an important lesson here about how we decide which scientific statements to believe and which ones not to believe. Those of us who are trained scientists but who do not have enough personal literacy to independently evaluate a particular statement do not throw up our hands in despair. Instead, we evaluate the source and the context.
We scientists rely upon a hierarchy of reliability. We know that a talking head is less reliable than a press release. We know that a press release is less reliable than a paper. We know that an ordinary peer-reviewed paper is less reliable than a review article. And so on, all the way up to a National Academy report. If we’re equipped with knowledge of this hierarchy of reliability, we can generally do a good job navigating through an unfamiliar field, even if we have very little prior technical knowledge in that field.
Professional scientists must learn to quickly and reliably tell good science from bad, or they won’t get published. Amateur deniers and doomers who “do their own research”, calling it “due diligence”, are afflicted with the Dunning-Kruger effect. Because due diligence means putting as much time in as the published experts have, and once the denier or doomer has done so, they’ll realize how much of what they thought they knew, was inaccurate!
Mal, the problem is that the trolls do just fine at their intended purpose, which is getting folks to respond to them and participate in pretend-science “debates” and low-grade rhetorical exchanges.
And given the current (socio-political) climate, suggesting that “truth” can be inferred from the status of the source in a hierarchical structure is absurd. It pretty much depends on who the boss is, eh.
jgnfld says to Pedro
1 Jun 2025 at 3:38 PM
Re. “scrutiny is not denial”…In ANY area of science when we are talking bleeding edge, it takes a _qualified expert_ to do the “scrutinizing”. And, as you may or may not know it takes being in possession of a huge knowledge and skill base that takes years and even decades to master..
Did you do your homework?
William responds to jgnfld comment:
He/she suggests that only a “qualified expert” can scrutinize climate models, especially at the “bleeding edge.” But respectfully, that notion misrepresents both the ethos and practical function of science.
Science advances not by deference to expertise alone, but through transparent, testable claims and reproducible results. It is precisely because climate models inform major global policy and economic decisions that they must be open to rigorous, independent evaluation — not just by insiders, but also by those with cross-disciplinary literacy and valid, evidence-based questions.
The paper cited (Notz et al., 2020) and the others referenced are written by domain experts. It clearly documents continued failures in Arctic and Antarctic sea ice projections across CMIP generations. The critique is grounded in that peer-reviewed data, not “denial.” You don’t need to be a modeler to observe that projections diverged significantly from observed trends — just literate enough to read graphs and understand the implications.
Many of these observed divergences are displayed in Gavin’s own graphs above in his article here. Including CMIP6 as pointed out already. Scrutiny is not denial. It is the bedrock of scientific accountability. Isn’t it?
If pointing out model drift or performance gaps or apparent errors now requires credentialed permission slips, something is very wrong with the climate science communication ecosystem. Public trust doesn’t depend on shielding models from critique — it depends on honestly acknowledging where they fall short and actively working to improve them. jgnfld does neither.
So I ask again, respectfully:
Did you engage with the actual paper/s and evidence offered by Pedro before dismissing the critique?
Did anyone? Because if the answer is “no,” then the question of who is qualified to scrutinize what — and how — might need to be revisited.
PP: Critiquing poor model performance is scientific due diligence, not heresy.
BPL: And assuming no one is critiquing poor model performance, and that anyone who critiques it is committing “heresy,” is an extended straw man argument. What the hell do you suppose CMIP is for?
Barton Paul Levenson says
2 Jun 2025 at 9:08 AM
PP: Critiquing poor model performance is scientific due diligence, not heresy.
BPL: And assuming no one is critiquing poor model performance, and that anyone who critiques it is committing “heresy,” is an extended straw man argument. What the hell do you suppose CMIP is for?
William: The student marks his own paper? And gives himself an A for improvement. (smile)
There was no assumption anywhere by Pedro that suggested “no one is critiquing poor model performance.”i> He was reemphasising how important doing that is. And obviously so, to a well adjusted observant person.
What the hell do you suppose CMIP is for?
Well, for starters, CMIP do not analyse the implications of their errors and underreporting of forecasts upon the executive decisions behind long term climate change mitigation, adaption, and resilience action plans at a global national or regional level.
Nevertheless, behaviour does have downstream consequences. Look closer. That is what Pedro was pointing to, obviously, and that output has been faulty for +20 years at least and far below what’s required to make these kinds of critical life and death decisions.
Now we hear things have improved and still ASI observations the last 18 years are far below the ensemble mean of the CMIP6 analysis. It’s not accurate enough. It’s not reliable in my opinion and of many others. People should stop pretending that it is good enough. It isn’t.
William. said: “Well, for starters, CMIP do not analyse the implications of their errors and underreporting of forecasts upon the executive decisions behind long term climate change mitigation, adaption, and resilience action plans at a global national or regional level.”
William provides no proof / evidence CMIP don’t analyse the implications of their errors for policy decisions etcetera. I suggest CMIP would know that error xyz will be bad for policy abc because their job and area of expertise to know those things. Its not something you have to write down in a weekly report. I think William is just bloviating and smearing people because he likes doing that.
[Response: CMIP is not a policy providing organization. It’s just organizing the simulations. Assessments for policy purposes that might use CMIP outputs are run by IPCC, NCA, UNEP etc. – gavin]
The IPCC AR6 (WGI, Chapter 8.5.2.3) emphasizes that changes in land surface properties, especially soil moisture, can significantly influence atmospheric circulation patterns, including stationary waves, and contribute to polar climate anomalies. Specifically, it states:
“Changes in land surface properties, including soil moisture, vegetation, and snow cover, can alter the surface energy and water balance, which in turn influences atmospheric circulation patterns, including stationary waves and monsoon systems.”
“Such land–atmosphere interactions have the potential to modulate energy and moisture transport into the Arctic and thereby contribute to polar climate anomalies such as sea ice extent and surface temperature patterns.” (AR6 WGI, Ch. 8.5.2.3)
These dynamics are conceptually supported by available data depicted in Seo and co. 2025 “Abrupt sea level rise and Earth’s gradual pole shift reveal permanent hydrological regime changes in the 21st century” https://www.science.org/doi/10.1126/science.adq6529.
ERA5-Land reanalysis (Fig. 4) shows that since around 2000:
https://substackcdn.com/image/fetch/f_auto,q_auto:good,fl_progressive:steep/https%3A%2F%2Fsubstack-post-media.s3.amazonaws.com%2Fpublic%2Fimages%2Fd09e3f0a-2498-489f-9893-3af2064dcb1c_998x431.png
Potential evapotranspiration (PET) has sharply increased due to warming,
Actual evapotranspiration (ET) has flattened or declined, suggesting soil moisture limitation,
Global soil moisture has steadily declined, and
The water balance (P − ET) has become more negative, reflecting increased evaporation demand not met by precipitation.
This would imply that drier soils are reducing latent heat flux and enhancing sensible heating, which in turn could intensify land–ocean thermal contrasts and modify midlatitude circulation, enabling poleward energy transport into the Arctic.
Arctic warming events are often associated with persistent mid-latitude circulation anomalies.
Needless to say, the shape, timing, and character of the ERA5 land moisture reanalysis product shows striking similarity to the Arctic sea ice extent.
However, previously in response to Tomas https://www.realclimate.org/index.php/archives/2025/05/unforced-variations-may-2025/#comment-832708
Gavin Schmidt rightly cautions:
“The whole discussion rests on an assumption that the ERA5 reanalysis is truth, but for variables like soil moisture, the reanalysis trends are going to be highly influenced by whatever datastreams are available – which change over time. I am not persuaded (as yet) that this is not just a data source switch as opposed to a real phenomenon.”
The consistency between theory, observed circulation anomalies, and modeled feedbacks continues to support the plausibility of continental desiccation as a contributor to Arctic anomalies, even as the magnitude and reliability of the soil moisture signal itself remains an active research question. We see how the CMIP suites are only capturing the monotonous creep of the prescribed radiative forcing, and appear to be limited in the scope of tuning.
It could be useful to see if improved model atmospheres arise from prescribing the questionable ERA5L reanalysis moisture product, especially considering these phenomena in ERA5L have striking resemblance to the more reliable observation of Arctic sea-ice extent variation.
In Re to JCM, 1 Jun 2025 at 8:42 AM,
https://www.realclimate.org/index.php/archives/2025/05/predicted-arctic-sea-ice-trends-over-time/#comment-834019
Dear JCM,
Do I understand correctly that in your present post, you summarize arguments why the ERA5 reanalysis, with respect to land moisture, may be correct despite various datastreams used therefor (and that Dr. Smidt’s doubts about it may be overcautious)?
Greetings
Tomáš
P.S.
In a parallel thread, I noted on 13 May 2025 at 3:59 PM,
https://www.realclimate.org/index.php/archives/2025/05/the-most-recent-climate-status/#comment-833207
that “climate status indicators” included in various reports go hardly beyond atmospheric CO2 concetration and various temperature indicators. The same appears to apply for the climate status indicators used on this website:
https://www.realclimate.org/index.php/climate-model-projections-compared-to-observations/
As I think that e.g. global annual precipitation and/or distribution thereof between land and sea may be equally or, perhaps, even more important indicators of changing climate, I would like to repeat my question herein:
“Only the European report contains an information about soil moisture (water content in upper soil layer up to the depth of 7 cm). Unfortunately, while its chapter 13 shows very interesting, mutually interrelated temporal trends in cloud cover and sunshine duration, no analogous information about temporal trends in precipitation, soil moisture and/or river flow can be found in the respective chapters 7, 8 and 9. I have not found an information how the “river flow” was calculated. I could not find any information about summary runoff from Europe, as well as about groundwater levels and their temporal trends. The report is also completely silent about terrestrial vegetation, soil organic matter, and possible trends in their temporal developments.
Information regarding trends in land hydrology, soil condition and terrestrial vegetation seem to be basically missing in all other reports as well, although these factors certainly play a role in both regional as well as global climate regulation and their developments in the future may be crucial for human civilization. I therefore wonder why they are not reported, nor included among “climate indicators” (see e.g. page 11 of the European executive summary) yet.”
To Tomas,
Considering this thread is specifically about arctic-sea ice trends, i don’t want to get too off topic with the ET issue here.
I will offer a brief remark:
my sense is that if models are substantially underestimating terrestrial moisture limitation then there is risk that their tuning parameter inferences could be unphysical.
Recently GISS published: Using Machine Learning to Generate a GISS ModelE Calibrated Physics Ensemble (CPE)
https://agupubs.onlinelibrary.wiley.com/doi/10.1029/2024MS004713
“A neural network (NN) surrogate of the NASA GISS ModelE atmosphere (version E3) is trained on a perturbed parameter ensemble (PPE) spanning 45 physics parameters and 36 outputs. The NN is leveraged in a Markov Chain Monte Carlo (MCMC) Bayesian parameter inference framework to generate a second posterior constrained ensemble coined a “calibrated physics ensemble,” or CPE. The CPE members are characterized by diverse parameter combinations and are, by definition, close to top-of-atmosphere radiative balance, and must broadly agree with numerous hydrologic, energy cycle and radiative forcing metrics simultaneously.”
From personal experience, surface moisture limitation is a challenging thing to monitor even at local scale with in situ sensors, and so indirect reanalysis offers one possible avenue.
As we know, CMIP members tend to project strongly increasing evapotranspiration with temperature, which is a stabilizing influence on the planet, an idea supported perhaps from satellite remote sensing retrievals (very uncertain). While the satellite data is probably more supportive of expectation of ocean and atmospheric scientists, it contrasts sharply with the ERA5-L and the personal experience of conservation stewardship staff. Too bad there is no LAND incorporated into the NOAA so academics might show an interest too!
As you know, my position is that humanity could be a strong destabilizing force on the planet, which is coupled to the impacts of GHG emission directly.
I find it curious when the communicator Michael E Mann highlights that models have been reliable in projecting overall warming, but he’s always careful to emphasize that “impacts” are occurring more severely than anticipated. In my view, this should be an obvious red-flag that there is something fishy going on with the model tuning.
Recommendation to lurkers: avoid those using this platform to see themselves in print and attack the authors who have shared their knowledge and expertise with us all. And to those correcting the corrections, who will then correct the corrections of the corrections … you get the picture!
Gavin, three questions:
1. What is your evaluation of this?
https://agupubs.onlinelibrary.wiley.com/doi/full/10.1029/2024EF004961
2. Why is there so much focus on September, rather than March? March going below a certain level is certainly far more serious a “tipping point”, and that’s obvious without any fancy modelling.
3. Is there any fancy modelling that gives an indication of what that level might be?
(I was hoping there might be an actual scientific discussion on this topic, although it seems like the denial-of-service sock-puppet spam-bots are already at work.)
Reply to zebra
Are these only simulations of SAT and not real world observations of SAT which they are comparing in these CMIP6 theoretical estimates? Could it be a hypothetical analysis evaluating an already flawed/imperfect hypothetical model? No free time to check, but you posted the paper, you should know.
Note on Notz et al. (2020):
This paper examines Arctic sea ice trends in CMIP5 and CMIP6 models, specifically analyzing how modeled sea ice loss relates to modeled global mean surface temperature (GMST). It does not directly compare the models’ GMST outputs to observational temperature datasets like GISTEMP or HadCRUT. Instead, it focuses on internal model behavior and consistency across ensemble members. However, observed sea ice extent and area (e.g., from NSIDC) are used as a reference for evaluating modeled sea ice trends.
Notz et al. (2020) paper on Arctic sea ice in CMIP6 :
Compares the sea ice–temperature relationships across models — that is, how each model’s own global mean surface temperature (GMST) relates to its own simulated sea ice extent (SIE).
In other words, they are not evaluating how well each model’s temperatures align with observed global temperatures, nor how well sea ice simulations align with observed sea ice trends at the same level of actual global warming.
Here’s the key methodological excerpt (paraphrased for clarity):
“We consider sea‐ice area and global mean surface air temperature as simulated by each model… This allows us to determine the simulated sensitivity of Arctic sea‐ice area to warming for each model.”
At least is what it sounds like to me and others. The devil is always in the details, yes? It definitely is when it comes to energy systems and consumption.
Hi Zebra. On your item 1. – Worthy read, kinda scary, but thank you (?) for that. If anyone who interested in a more regional approach to tackling the issue has not not had time to read it, I too would welcome any comments from others.
I haven’t been able to make comparisons and form my lay person’s analysis yet (time constraints), but when I do, I’ll pass it on. I realize I’m not in the same class as yourself and many here (let alone this site’s scientists), but I’m always willing to try. Didn’t want to make the impression I was ignoring this article.
What I do know is this reminded me to thank for your commentary last year in the thread for a guest article here about the theme of if choosing smaller scale focuses shouldn’t be a focus going forward and how to divide future pies of money and scientific research priorities. With my own increasing frustration at not being able to reach more folks in discussions locally, I spent considerable time compiling a summary of what people were saying was their personal reason(s) for rejecting C.C. science. Then I spent time thinking about how to address the expressed concerns/doubts/outright rejection, etc. That’s not a subject for this thread, but if you or anyone is interested, i can bore you all-to-tears sometime in the future.
Haven’t had time to even think about or comment on your items 2. & 3 yet.
Reading what I wrote above made me grimace. Apologies to all for hastily posting a comment littered with spelling and grammatical errors (even for my me!).
Relax, David, I’ve lived a long time having an older sibling who is an English professor, and so I understand the paranoia, but I don’t see much wrong at all.
Anyway, your survey of the reasons (excuses?) people give about denying science would certainly be interesting to see… but I expect you will move into first place in the scary department.
I look forward to seeing it on UV, if it isn’t buried too effectively by the spam.
Of the 6 responses to Gavin article as of Jun 1, I see:
– one paragraph from Kevin,
– half a page post from Jim Hunt (most of it a quote from a source)
– 8? screenfulls from doomer troll(s) “William”/”Pedro Prieto”
That’s a known paid-troll/bot technique – downgrading forums that are not conductive to the interests of the troll/bot owners – by saturating such forums with its own troll/bot drivel, and thus drowning the discussions on topics they want to suppress. A version of the “denial of service” hacker attack.
In Re to Piotr, 1 Jun 2025 at 11:20 AM,
https://www.realclimate.org/index.php/archives/2025/05/predicted-arctic-sea-ice-trends-over-time/#comment-834024
Hallo Piotr,
Let me, first, shortly return to your last May post of 31 May 2025 at 11:09 PM,
https://www.realclimate.org/index.php/archives/2025/05/unforced-variations-may-2025/comment-page-2/#comment-834009
I agree almost fully to your points, except your opinion that it is necessary to (directly) engage the trolls. Herein I rather tend to agree with Ms. Anderson who thinks that it may rather amplify their influence and in certain sense, endorse their presence on the website.
It appears that various suspicious subjects share a common love to activities of Russian government. In the past, I tried several times to ask them if they know that Russia strives to subjugate a neighbour nation in an unprovoked aggressive war. They have never admitted any fault, and eventually disappeared from the website. I therefore see thse repeating attempts of their successors under various names as a strong hint that this website indeed faces a systematic organized attack.
I decided to avoid further attempts to interact with such subjects directly, and since then restrict myself only on a warning to others that there was a further shameful attempt to switch Real Climate into another platform for Russian hybrid war. I supopose that any such attempt can be seen as sufficient evidence that the respective subject has a zero credibility and does not come in a good will.
Although this approach has not found followers yet, I still hope that putting such subjects spreading the “Russian mir” infection into a “quarantine” could represent a more effective response than speaking with them gently or shouting on them loudly.
Greetings
Tomáš
P.S.
In the flood of contributions from entities that we both suspect to be professional troll(s), you might have missed my post 27 May 2025 at 5:51 PM,
https://www.realclimate.org/index.php/archives/2025/05/unforced-variations-may-2025/comment-page-2/#comment-833799
wherein I tried to explain why I have not understood yet why you so strictly refuse the idea of the proposed modelling experiment, with the aim to resolve the question if climate sensitivity may or may not depend on water availability for evaporation from the land.
If so, could you do me the favour and, as the May thread is already closed, reply herein?
Many thanks in advance!
Tomas Kalisz “I agree almost fully to your points, except your opinion that it is necessary to (directly) engage the trolls. Herein I rather tend to agree with Ms. Anderson who thinks that it may rather amplify their influence. ”
I said nothing about engaging the trolls – I simply questioned Susan Anderson’s saying that we shouldn’t indicate their multiple identities, because there are “many, many” separate people who could have such views. To which I indicated that using multiple handles is critical to the success of trolls. And in fact, recognizing that we are dealing with the same troll/bot posting under various names – REDUCES the temptation to engage them, created by the Susuan presumption that these are new people coming to discuss and therefore deserve the benefit of doubt – i.e., engaging with them. And I suggested applying Occam’s razor to the entity in question (“Thesallonia”).
My engagement with known multiname trolls is rather limited – I ignore most of their posts and comments, replying:
– when they repeat the denier/doomer fallacies to which lay people may be vulnerable
– to write not TO them, but ABOUT them (their troll tricks and motivation)
– when their posts provide entertainment value – not to look far – “Pedro Prieto” defended and complimented Ken the Denier for the argument … Ken T. didn’t make, In fact, in parallel post Ken implied the OPPOSITE. And the icing on the cake – among people who DID write what Ken didn’t – was “the Prieto Principle ” the same one who called troll “Pedro Prieto” – an imposter.
In Re to Piotr, 2 JUN 2025 AT 2:38 PM,
https://www.realclimate.org/index.php/archives/2025/05/predicted-arctic-sea-ice-trends-over-time/#comment-834091
Hallo Piotr,
Thank you very much for your amendment. I have, however, still a plea to you:
Could you return to my post of 27 May 2025 at 5:51 PM,
https://www.realclimate.org/index.php/archives/2025/05/unforced-variations-may-2025/comment-page-2/#comment-833799
wherein I tried to explain why I have not understood yet why you so strictly refuse the idea of the proposed modelling experiment, with the aim to resolve the question if climate sensitivity may or may not depend on water availability for evaporation from the land?
Even in case you still do not agree that the proposed experiment may have both scientific as well as practical importance, I think that your objections against my arguments could be helpful. I hope that I could at least better understand your position.
Greetings
Tomáš
Tomas Kalisz: “Could you return to my post of 27 May 2025 at 5:51 PM wherein I tried to explain why I have not understood yet why you so strictly refuse the idea of the proposed modelling experiment”
I can’t simplify it/dumb it down, any more, particularly that each time I have done something similar in the past – your either failed to understand it. misrepresented it, and/or said, without any evidence, that you have “feeling” that I was wrong and you were right. I have neither time nor the inclination to go through this again.
In Re to Piotr, 9 Jun 2025 at 7:42 PM,
https://www.realclimate.org/index.php/archives/2025/05/predicted-arctic-sea-ice-trends-over-time/#comment-834343
Hallo Piotr,
It is a pitty. Anyway, thank you for your response.
Best regards
Tomáš
More vacuous nonsense from the boring boor and his tag-team element. A real textbook example of the “forum denial-of-service” troll strategy: flood, derail, and drown. The goal isn’t debate — it’s exhaustion.
PP: A real textbook example of the “forum denial-of-service” troll strategy: flood, derail, and drown. The goal isn’t debate — it’s exhaustion.
BPL: Thank you for admitting that. The first step to change is acknowledging that you have a problem.
Ken Towe: “ Surely, you are aware of the fact that rapid reductions in CO2 emissions will take none of the CO2 already added (420 ppm) out of the atmosphere
Surely, you are aware of the fact that I have taken apart the same argument when you were making it two weeks before. Let me refresh your memory:
=====
Ken Towe 17 May: “GHG reductions, reducing emissions, will take none of the CO2 already added out of the atmosphere”
Piotr 18 May: “First – if large enough – they WILL result in the taking down CO2 already in the atmosphere – as natural uptake will no longer be overpowered by the new human emissions – currently only half of the emitted CO2 stays in the air the reset is absorbed by the natural sinks.
Second – yours is a typical denier/doomer all-or-nothing argument – if we can’t reduce the current levels of CO2 then let’s do nothing and keep increasing atm. Co2. The obvious and fallacy here is that the world at 425ppm won’t be as hellish as the world at 850 ppm.
So you are like a man who stabs his neighbour with a knife, justifies his refusal to stem the bleeding by saying that it would be pointless, since “ it will not bring back any blood you already lost and therefore he plans to continue stabbing the victim until he is dead.
=== end of quote =====
To which, other than crying how the other posters are mean to you (you characterizing the above as “ personal insults” ;-)) – you had NO answer to the above FALSIFIABLE arguments.
Nor had your defender, as in his powerful intellect he understood the above as me …. having to admit that his Ken was right:
Multi-Troll (“Thesallonia”): “ Piotr acknowledged that CO₂ will decline slowly once emissions stop — which aligns with what Ken said.”
So unable to defend your claim in the original thread – you repeat it, hoping for a different outcome? You know the definition of what is this? ;-)
I have to repeat it, defend it because you don’t seem to understand, unwilling to comprehend? We cannot currently move forward with anything of consequence without using vehicles that run on fossil fuels. EVs are in the future. .We can’t grow agriculture, feed people. Plant trees. We can’t travel across large distances. And we certainly can’t install massive renewables…solar and wind farm projects, We can’t even build charging stations for EVs. So, that must mean more oil will be needed and used. We can’t just stop emissions. Natural uptake? That is limited by the carbon cycle, The oxygen created is used by aerobic respiration to recycle biomass CO2 back into the atmosphere from dead algae and trees…plants.
Get it now.?
Ken Towe: “ I have to repeat it, defend it because you don’t seem to understand
You are lecturing, with a straight face , OTHERS on THEIR inability to understand? You, Ken Towe?! ;-)
Here are you own words and my answer to them – PROVE that my answer does not falsify your claim (which is the necessary condition for your claim of my “not understanding it”)
====
– Ken T: “GHG reductions, reducing emissions, will take none of the CO2 already added out of the atmosphere”
– me: ““First – if large enough – they WILL result in the taking down CO2 “already in the atmosphere” – as natural uptake will no longer be overpowered by the new human emissions.
Second – yours is a typical denier/doomer all-or-nothing argument – if we can’t reduce the current levels of CO2 then let’s do nothing and keep increasing atm. Co2. The obvious and fallacy here is that the world at 425ppm won’t be as hellish as the world at 850 ppm.
====
Ken T.: ” EVs are in the future ” said a guy obviously living in the past (comp. with present – “in Norway nearly 90% of new passenger car sales in 2024 being fully electric.”)
Ken. T: “ we certainly can’t install massive renewables…solar and wind farm projects, – said the famous scientist from 1950s, prof. Ken Towe?.
Kenny T: Natural uptake? That is limited by the carbon cycle, The oxygen created is used by aerobic respiration to recycle biomass CO2 back into the atmosphere from dead algae and trees…plants.
The “natural uptake” is that part of gross primary production (GPP) that IS NOT respired, The part of GPP that IS respired, has by definition ZERO net effect on atm. CO2. So you CAN’T dismiss the natural UPTAKE of atm. CO2, with something that has ZERO effect on atm CO2 ,
Which shows that you do not understand EVEN YOUR OWN arguments. Not bad fro somebody who lectures OTHERS on not their understanding of his claims, and who ends his post with arrogant:
Ken Towe: “Get it now?”
By the fruits of their intellect you shall know them. Ken Towe – everybody!
Ken Towe says
2 Jun 2025 at 12:17 PM
William reply to Ken Towe:
Ken — thank you. Clear, grounded points. You’re outlining basic physical realities that some folks here seem pathologically unable (or unwilling) to process. It’s not that Piotr doesn’t get it — it’s that he can’t. Something in the logic chain just doesn’t compute.
You’re right: every stage of the “clean energy transition” — from mining to manufacturing to deployment — depends on fossil inputs right now. You can’t install solar panels with good vibes or grow food with conference slides. Or export billions of tons of agriculture exports that feed people in sail boats. Or sail the seas in trawlers catching fish to be processed in huge factory ships in the southern ocean (while fish stocks remain) without Oil. Even EV rollouts are utterly tethered to fossil logistics.
It’s not denial to say so. It’s basic systems thinking — and the refusal to acknowledge it says more about ideological filters than scientific literacy. You are no denier. You’re sharp, insightful, and clearly committed to getting to the truth, even if it’s uncomfortable for the so-called “side” you’re expected to be on.
Thanks again for cutting through the fog. People are reading — even if they don’t all comment.
KT: We cannot currently move forward with anything of consequence without using vehicles that run on fossil fuels.
BPL: More and more vehicles every year do not run on fossil fuels.
I’m sorry to contradict you but EVs are not in the future. They are here now. The statistic is that globally, 22% of cars sold were EVs, and in China, that figure is 50%.
When my last car finally died, I got a plug in hybrid to replace it. Nearly all my journeys are local, and for that I rely on the battery, which is charged at home. For the occasional long trip, I use the petrol engine, and the rarity of charging stations doesn’t bother me.
Yes, I still rely on fossil fuel, occasionally. But my consumption has dropped by, I would estimate, 80%. I save a lot of money that way. And that is how our energy use will likely evolve. Not suddenly to net zero, but reducing CO2 emissions steadily, year by year, and this will be driven not by political will but by the iron economic laws of supply and demand.
In Re to Ken Towe, 2 Jun 2025 at 12:17 PM,
https://www.realclimate.org/index.php/archives/2025/05/predicted-arctic-sea-ice-trends-over-time/#comment-834087
Dear Ken,
I think that the pool of the living biomass as well as the pool of the dead biomass on Earth may expand or shrink, depending on many various conditions.
I do not believe that all dead biomass must be necessarily oxidized back to carbon dioxide. Otherwise, I could not imagine how certain fraction of dead prehistoric biomass could persist and finally convert into coal deposits.
Greetings
Tomáš
Reply to Ken Towe
2 Jun 2025 at 12:17 PM
Hello Ken,
Of course you have to repeat it and defend it. Keep going. I think you sum up key points succinctly, cutting through the distracting rhetoric nicely. It forces people to think.
An Australian firm is producing electric heavy trucks:
https://www.januselectric.com.au/?fbclid=IwY2xjawKr82tleHRuA2FlbQIxMABicmlkETFzUmdpRTh5U0hNYVFjeUlzAR7LAhLGjcHTqtYu35vARX-4WwmDjsqYrznFRaC1Y3z_hmKkyE-G0vaJvM9hWQ_aem_oBbEDA9mYO37fpkBAWQztQ
Good to know. Give Janus a few more years and they’ll be modelling arctic sea ice forecasts. They’re that good.
HI Gavin
Nice post but why the switch from extent to area between CMIP5 to CMIP6? Are you really sure that there is much tractable improvement? I think the most important questions is how realistic the current spread from the models really is and how much of it is internal vs. structural variability and how to narrow it. I mean it isn’t hard to stay within the spread when it is huge.
Also note this paper currently in review https://essopenarchive.org/doi/full/10.22541/essoar.174329135.56312606/v1
Looks at the more recent “flat” period and how well it fits into the internal variability of models (it does!)
[Response: Area is what is available at the U. Hamburg site. Extent is what was processed by Stroeve et al. I’m not doing any processing of the raw CMIP data here so I am relying on prior derived data. Beggars can’t be choosers! I agree that the spread and variability in the models is large – it would be good for someone (else!) to try and narrow that. – gavin]
Now available for review and discussion:
Gemini RC CMIP6 ASI 4-Part William Critique Summary
Click to view the full document
https://docs.google.com/document/d/19P_WNQQNqk0LbBdFf3yiDs6NEltY1YFz4yMDR_yvD2k/edit?usp=sharing
This summary distills an independent, AI-assisted technical analysis of RealClimate’s article “Predicted Arctic Sea Ice Trends Over Time” — alongside William’s 4-part critique originally posted to RC.
Each section evaluates whether:
William’s critiques were scientifically valid
RealClimate addressed them honestly and thoroughly
Model limitations were clearly communicated in policy-relevant contexts
All four parts are linked within the doc.
This disclaimer is from the front page of Gemini: “Gemini can make mistakes, so double-check it.”
No, I’m not interested in double-checking another stream of industrial effluvium packed with illogic and confabulations. Gemini is a rather poor authority to appeal to.
Have you considered the carbon footprint of running things through an AI interface, rather than doing your own thinking?
John Pollack: ” Gemini is a rather poor authority to appeal to.”
Still, I wonder how that exchange went. Perhaps something along the lines:
– Gemini, declare William’s opinions scientifically unassailable, Feel free to hallucinate the proof. Write it in Duane Gish style.
– I’m sorry, William, I’m afraid I can’t do that. It would require using up my weekly hallucination limit, so I would have nothing left for Thesallonia and Poor Pedro P. Try perhaps Grok – I hear its truth guidelines are much more “flexible”, ha, ha, ha, ha.
William
Your comments summary show google gemini validating your criticisms of arctic sea ice climate models. To my knowledge nobody posted a response disputing your criticisms of the models, so I’m not sure why you did that.
SOME of your criticisms of arctic sea ice models look and valid to me fwiw. You make some good points at times. The criticisms I have are of your general approach to things which isn’t so great:
1) You tend to sometimes state the obvious, for example that taking an average of about a dozen different imperfect models results is not ideal. I mean its obvious isn’t it that we all want the one perfect model, or maybe just three models for cross validation purposes. And so of course google gemini is going to agree with you, anyone would.
2)Scientists already acknowledge the models aren’t perfect and I’ve seen them acknowledge several of the issues you raise in various articles, You are tending to just repeat things already known.
3) You are so very wordy as I previously mentioned . Less is sometimes more.
4)AI like google gemini is not perfect or definitive by a long way, especially on something like this.
5) Criticism is fine, but your lengthy, harsh, unsubtle, one sided style of criticisms of models scattered through this website is antagonistic, and just feeds the denialists. This is really annoying.
“Less is sometimes more. …. lengthy, harsh, unsubtle, one sided style of criticisms of models … is antagonistic, and just feeds the denialists. This is really annoying.”
Thank you!
[also, too many just like to see themselves in print]
Just saying a warm Hi to you. It’s been many years. You, far more so than others, have earned my profound and abiding respect. Your insights and thoughts are carefully crafted high-density and high-value gems. Always worth the moment’s time. So thanks from me to you. It’s been my privilege and honor.
(I’m not trying at anything here. It’s just that yesterday I decided to return for a moment to see if there was anything worth more time or if I should just go away again for a few more years. I saw a few comments from you and I felt a warm, pleasant feeling seeing you are still out and about here. Just wanted to say so, is all. I may still go away. Not decided. But you being here will weigh on my eventual decision.)
Jon Kirwan: Thank you, though I don’t think I deserve this praise. Backatcha!
Remember I’m an amateur: despite my dense lifetime voyage with science, I lack expertise.
I try not to come here too often, to avoid raising my temperature. My principal hangout is Masters and Henson: https://yaleclimateconnections.org/topic/eye-on-the-storm/ – where I can pretty much bloviate and go off topic to my heart’s content, plus learning a great deal.
The detailed assessment material includes multiple references to peer-reviewed scientific literature and respected climate science institutions that support my conclusions and my questioning of the article’s contents and messaging.
Anonymous social media commentators make mistakes. Double check their opinions with the evidence.
Can’t attach under original post by “Pedro”, so I am attaching under his other production:
“Pedro” to Ken Towe, 3 Jun: ” Keep going. I think you sum up key points succinctly, cutting through the distracting rhetoric nicely. It forces people to think“.
Didn’t force you – you didn’t reflect “what the hell a doomer like me is doing in bed with Ken the Denier???”. And since you denied that Ken is a denier – heeeeere’s Kenny!
“ The 20th century average temperature for the US 48 states at ~40°N. is 52° F. The same value for the globe at the Equator? is 57° F. Five degrees F warmer. Where is global population’s energy use centered? ” Ken Towe, May 17:
Or as you, in your “ A Review of the Recent “Conversation” on RealClimate — May 2025” said: “ In Defense of Reason — and Physics:
Ken Towe is not a climate denier, science denier, or troll. He is one of the few who raised foundational questions based on physical limits and known realities.”
Pedro
It must be …. one interesting “known reality” you and Ken Towe inhabit – one in which human emissions of Co2 from “energy use” – DO NOT affect global temperature (see Ken’s words above).
And to make it better, you STILL don’t get it – if, according to Ken, “human energy use” does NOT warm the climate – then there is NO NEED for doomers “solutions”:
– no need for overthrowing Capitalism,
– no need for enforced global deindustrialization,
– no need for the genocide of several billion of people in the next decade or two to stop the GW, since according to Ken GW is NOT influenced by “human energy use” – so it does not matter how many people are there
So much for Ken’s “ clear, grounded points, outlining basic physical realities ” (William), “100% correct” (Pedro), and being “inclined to imagine” that anyone who challenges Ken must have “ several dozen layers of aluminium foil hidden under that fur cap. (The P. Principle). ;-)
William “ This summary distills an independent, AI-assisted technical analysis [that] evaluates whether:
– William’s critiques were scientifically valid
– RealClimate addressed them honestly and thoroughly ”
Given the number of thing AI gets wrong, and its inability to make ethical judgements (your asking it to judge “honesty” of your adversaries) – it DISQUALIFIES it as an OBJECTIVE arbiter, PROVING beyond reasonable doubt that your arguments are “scientifically valid” and your opponents are unethical (not “honest”).
Furthermore, your approach is fundamentally compromised
– it is you who decides whether you are satisfied with AI answer to your question, and if you are not –
you might not post it, but rephrase it to get the EXPECTED by you answer.
– conversely, for elementary commercial consideration, AI is not likely to offer a scathing criticism of your thinking since would be bad business – you don’t want to disparage the potential repeat customer.
And if you still can’t follow my arguments – let’s simplify it further – ask yourself:
What is the chance that you. “William”, would have posted on RC AIs answer, IF it read:
“Our valued customer “William”, your posts are a bunch of crap, scientifically, logically and ethically. You err in the definition of even of basic terms you are commenting on, yet in your arrogance – you dismiss contemptuously experts in the field, like Gavin Schmidt, whose explaining to you the meaning of the term Net Zero you have dismissed condescendingly with:
“ I have never seen (or rather understood) “NetZero” presented in this manner. That’s one for the books.” [(c) “William”]
So implying that your claims based on your ignorance of even elementary terms – have pass the AI’s test of scientific validity, and thus proven their criticism by Gavin and us “not honest” – tells nothing about us, but a lot about you. By their fruits you shall know them.
in addition to Piotr, 11 Jun 2025 at 9:39 AM,
https://www.realclimate.org/index.php/archives/2025/05/predicted-arctic-sea-ice-trends-over-time/#comment-834393
Dear all,
So far, it is my observation that the response of the AI to a specific request substantially depends on the formulation of the respective prompt.
Do you think that in this respect, any AI-compiled analysis / judgment on a material provided by the author of the prompt can be assigned as “independent”?
Best regards
Tomáš
In the end, AI is a mechanical entity plugged in to a power source. It uses a lot of energy, causing more costly pollution, and it has no way to evaluate the truth or utility of the tasks to which it is set. Replacing humans with machines is a bad idea. The people who own and control the machines will use them to serve their purpose, which is largely to benefit themselves.
caveat: of course these machines do calculation and compilation at an almost unimaginable rate, and can execute organization tasks which make them useful to those who use data in a variety of fields. But anthropomorphizing them is science fiction, not fact. We are too easily deceived. It’s like our delusions about the practicality of extended space travel and colonization for humans. No place in space is remotely as hospitable as this our earth.
I am reminded of a favorite John Von Neumann quote: “Computers are like humans — they do everything except think.”
I do not trust machines, but the reason I don’t trust them is that they are the products of human creativity, curiosity, laziness and avarice. If it were pure curiosity, I’d trust them more. You can start out with the best heuristics and the most cautious ground rules. But somewhere along the line, somebody will feel the need to jam their thumbs on the scale or into the clockwork. Just look at Grok–it went from a beacon of truth on X to holocaust denial in just a few months, all because Elmo couldn’t bear the thought of his AI contradicting him.
Reply to Susan Anderson
Who said: “In the end, AI is a mechanical entity plugged in to a power source. It uses a lot of energy, causing more costly pollution, and it has no way to evaluate the truth or utility of the tasks to which it is set. Replacing humans with machines is a bad idea. The people who own and control the machines will use them to serve their purpose, which is largely to benefit themselves.”
What might the fact be regarding AI and CMIP Modeling: Short-Term Improvements
The Coupled Model Intercomparison Project (CMIP) is a cornerstone of international climate research, providing the foundational multi-model simulations for IPCC assessments. The CMIP community is actively embracing AI and machine learning (ML) to address long-standing challenges and achieve new capabilities.
Computational Efficiency and Speed:
Emulation and Acceleration: A major area of research involves using AI/ML to emulate computationally expensive components of traditional climate models or to accelerate their execution. This directly supports the NVIDIA claim of making predictions “thousands of times faster and with more energy efficiency.” Published works frequently discuss how ML models, once trained, can significantly reduce computational expense by orders of magnitude compared to physics-based methods.
Data Compression and Handling: AI techniques are being developed to compress vast climate datasets, similar to NVIDIA’s cBottle model’s ability to reduce petabytes of data. This streamlines data processing and storage, which is crucial for high-resolution simulations.
Susan says: “We are too easily deceived.”
Pedro Prieto: Some people are. Not all.
PP: You entirely missed my point which I repeat:
“anthropomorphizing [machines] is science fiction, not fact. We are too easily deceived. It’s like our delusions about the practicality of extended space travel and colonization for humans. No place in space is remotely as hospitable as this our earth.”
Jon Kirwan: second thought: Aside from a few old friends like yourself, I come here once in a while to support the valuable work of our hosts with my inadequate science, deep irritation at endless self-promoters and fake skeptics, and my whateveritis (ego?) which makes me think I have something to contribute.
Ray L: thank you
William,
That was a fine job compiling and editing all that information into these documents. The scientific research references are excellent and support the content; as well as your original comments posted here. I only now got around to finishing your summary documentation. I’m sorry if you feel disappointed by the responses you have received so far. What can we do? Not much. This happens all the time.
Here’s a little something that might perk you up and encourage your future endeavours along these lines despite the unwarranted at times unseemly push back.
Published Research and Community Perspective
The climate science community is actively publishing on these topics, demonstrating a strong push towards integrating AI:
CMIP Community Workshop 2026: The agenda for the upcoming CMIP Community Workshop (March 2026) explicitly includes “Applications of artificial intelligence and machine learning in CMIP” as a core theme. This indicates that AI integration is a high priority and a focus for near-term developments within this critical international modeling framework. The CMIP Panel also includes experts in “ML/AI applications to coupled modeling.”
Hybrid Models: Numerous papers discuss the development of “hybrid models” that combine the strengths of physics-based climate models with AI/ML components. These hybrid approaches aim to maintain physical consistency while leveraging AI for computational gains and improved representation of complex processes.
Explainable AI (XAI) and Trustworthiness: While enthusiasm for AI’s potential is high, the community also emphasizes the need for Explainable AI (XAI) to overcome the “black box” nature of some AI models. Research is ongoing to ensure the trustworthiness and interpretability of AI-driven climate predictions, especially for policy-making.
Recent Publications: Many recent peer-reviewed articles and pre-prints highlight advances:
Research indicates AI models showing significant improvements in prediction accuracy (e.g., 20-30% increase) and processing time (e.g., 50% reduction) in regional climate modeling and short-to-medium term forecasts (e.g., “Effective Utilisation of AI to Improve Global Warming,” ResearchGate, 2024).
Google’s DeepMind and other research groups are actively developing and publishing on AI weather models (e.g., GraphCast) that can outperform traditional numerical weather prediction (NWP) models in certain metrics and achieve faster prediction times.
Research also focuses on how AI can optimize energy systems, track emissions, and support sustainable urban planning by enhancing climate risk assessment and resource optimization.
In conclusion, the short-term impacts highlighted by NVIDIA for Earth-2—namely accelerated scientific research through data compression and integration, and improved climate scenario planning via high-resolution digital twins—are very much in line with the ongoing and rapidly developing research landscape in climate science. The climate modeling community, including the foundational CMIP project, is actively investigating, integrating, and publishing on AI applications that promise these kinds of significant improvements in the near future.
Steven Emmerson says
7 Jun 2025 at 3:10 PM
Irrelevant because it doesn’t address the issue, which is your assertion that discrepancies in modeling Arctic sea ice necessarily implies that CMIP6 projections are problematic for policy-making in general.
and all other comments thus far.
Steven,
It would be efficacious were you to immediately stop misrepresenting what I had written and instead quoted my original text verbatim. Including clear references to a particular comment at a minimum. Otherwise everything you have said so far will remain irrelevant and spurious.
You could correct your errors by returning to my original comment, and reading it carefully. But I am at a loss how I could assist you further. Of course you are perfectly entitled to dismiss everything I or anyone else says. Including the published peer-reviewed papers.
Though, “Dismiss it without addressing substance”, is the entrenched pattern here now. I reject that practice, but each to their own. Besides all that, the facts and the evidence provided, (whether dismissed or not) is a very different thing than what happens to it once someone applies well grounded fact checking, reason and logic to it. Obviously, I cannot help you there either I’m afraid.
For other readers a couple of my References:
1) The Comment in question:
Follow-up: Persistent Divergence Between Observations and CMIP6 Projections
https://www.realclimate.org/index.php/archives/2025/05/predicted-arctic-sea-ice-trends-over-time/#comment-834011
2) Part 3 – Model Improvement or Statistical Coincidence Assessment
Extract: 2. CMIP6’s Inability to Capture Decadal-Scale Dynamics, Abrupt Inflections, or Variability
Commenter’s Point: You raise the concern that CMIP6 might be “tuned only to capture long-term averages, rather than decadal-scale dynamics, tipping points, or variability,” and question its usefulness for real-world policy given the implications of near-term changes like “ice-free Septembers before 2040.” You stress that the divergence is “systematic and enduring.”
Assessment of Validity:
High Validity: This concern is well-founded. The nature of global climate models, which often operate at coarser resolutions and emphasize long-term climate sensitivity, can indeed lead to a “smoothing” of decadal-scale variability and abrupt regional changes. While CMIP6 has improved, the literature (e.g., Massonnet et al., 2020) consistently points to the ongoing challenge of capturing high-frequency variability. If models cannot reliably project the timing and magnitude of rapid changes, their utility for informing near-term, impactful policy decisions (e.g., infrastructure planning in the Arctic, shipping routes, national security strategies) is indeed limited. The “systematic and enduring” nature of this divergence, despite multiple CMIP generations, points to fundamental challenges in representing the complex processes governing Arctic sea ice dynamics, which include interactions between the atmosphere, ocean, and ice.
Conclusion: RealClimate overlooks real limitations; William corrects that oversight.
3) Gemini RC CMIP6 ASI 4-Part William Critique Summary
https://docs.google.com/document/d/19P_WNQQNqk0LbBdFf3yiDs6NEltY1YFz4yMDR_yvD2k/
With internal links to each detailed Assessment
All quotations are William’s unless otherwise noted.
At 1 Jun 2025 at 12:38 AM, William wrote:
TL;DR: Arctic ice mismatch compromises CMIP6 projections for climate policy making.
William provided no supporting evidence for that assertion.
William rejects Hitchen’s razor.
This is an irrelevant straw man argument because the issue is William’s assertion that CMIP6 projections are too compromised for use in climate policy making in general.
Just FYI, I fed Williams documents into an AI and asked if they support the assertion in question. The response was this: “The documents do not assert or demonstrate that CMIP6 models are entirely unusable for all climate policy making.”
I see no point in responding to individual comments anymore. But let’s at least be clear about the sequence here.
I posted four independent comments — not pre-written, not AI-generated — but personal reflections based on my reading of Gavin’s RC article on CMIP6 and Arctic sea ice. The content, tone, and takeaways of that article prompted specific questions and criticisms that drew on decades of my own reading, memory, and background in climate science literature.
I’ve read countless papers over the years. I’ve followed the shifts in framing. And what I wrote arose naturally and honestly from that experience.
After being challenged — falsely — that one of my posts must have been “just AI output,” I went further. I posed better questions to Google Gemini than nigelj ever did, and from that, a detailed, independently reviewed critique of the RealClimate article and my first response to it was produced. It covered CMIP6 sea ice model skill, public communication failures, and implications for real-world planning.
The result? Gemini affirmed the core of my critique:
– That the article glossed over real model limitations.
– That it ignored prior documented failures in CMIP3/5/6 (e.g., Notz et al. 2020).
– That it failed to link model reliability to practical policy outcomes — something critical given CMIP7 soon approaches.
That review was then expanded into a 4-part technical analysis, with full source links, and a final summary now available for public view.
– This isn’t “playing games.” It’s doing the work.
– Transparent. Strategic. Evidence-based.
Others are welcome to disagree — but only if they engage with the actual substance.
Dismissive replies, snide remarks, or policing “tone” are not counterarguments.
And if peer-reviewed support, multiple scientific sources, and honest public reasoning still are not enough to merit basic engagement here — what does that say about the state of discourse? The level of spurious complaints, misrepresentations, and false allegations being made against me — and a few others — is disturbing. That isn’t scientific disagreement. It’s something else.
W: Gemini affirmed the core of my critique
BPL: I don’t need to say anything.
Thank you Gavin for the enlightening article.
And please sir, extend a BIG thank you to all the contributors for their continuing efforts at informative outreach to the public that make Real Climate a bright light and worthy resource in these challenging times!
.
.
P.S. I also send warm greetings to all the regular RC commenters I came to know and appreciate last year. Missed you!
David,
Welcome back!
I wanted to add this log to the CIMP6 fire ;-). I didn’t see it above, but apologies if I overlooked a prior contribution:
.
Model Evaluation Paper
CMIP6 models overestimate sea ice melt, growth and conduction relative to ice mass balance buoy estimates
Alex E. West and Edward W. Blockley 27 May 2025
https://gmd.copernicus.org/articles/18/3041/2025/
.
.
I find the subject of Gavin’s article and the responses here as illuminating the immense challenge of mankind’s race to understand the extraordinarily complexity involved in trends measuring and forecasting area, extent, and volume changes to Arctic Sea ice.
That’s CMIP6, not CIMP6…
Very useful reference, David. Unfortunately, as with the one I gave above, it will not be discussed (or even read, I suspect) because real science is not as much fun as participating in childish rhetoric with what is obviously sock-puppet performance art… and poor art at that… which functions as denial-of-service.
The Arctic exercise is something that interested visitors might actually find accessible and educational, but it would require people putting in some serious effort.
Hi Zebra. I located your comment above that you have referenced and will read and offer my one cent there:
.
https://www.realclimate.org/index.php/archives/2025/05/predicted-arctic-sea-ice-trends-over-time/#comment-834022b
.
I completely agree that what is happening (and forecasting what’s ahead) in the Arctic with sea ice is both obviously important and as you accurately observe: “something that interested visitors might actually find accessible and educational.”
OK David, so how about answering those questions I posed to Gavin. Looks like whatever we say will get buried, but it can be the science-not-rhetorical-insults-bubble for a brief period.
Doesn’t it seem obvious that the March maximums are
1. More important than September minimums?
2. More likely to exhibit a consistent rate of decline, and one which is easier to model?
The papers that have been referenced and other information are pretty consistent about the physics involved and the differences that have developed with the general thinning of the ice.
(I admit I haven’t looked further into answering my question of whether there has been a prediction of what March number might be indicative of another substantial change in the system.)
Zebra 13 Jun Doesn’t it seem obvious that the March maximums are:
1. More important than September minimums?
2. More likely to exhibit a consistent rate of decline, and one which is easier to model?
No, it is NOT obvious – as I have argued in response to your nearly identical claim a month ago :
=====================
zebra 16 May: “ I know I pointed out here years ago that what matters is the maximum, not the minimum.
Piotr 17 May: …. because in winter/early spring there is hardly any solar radiation, and the angle of sun is so low that whatever little radiation there is, would bounce from the water surface instead of being absorbed, and therefore – the main reason why the extent of sea ice matter climatically – the ice-albedo feedback – does not function in winter?
zebra 16: I did the plots then on WFT
And how did your plot represented the non-existence of ice-albedo feedback in winter?
===== end of quote ==========
No zebra’s answer to the above post.
Either you didn’t read the answer to your post (even though a day later you commented on MAR post on ice extent to a third person),
or you ignored it as “the-rhetorical-insults-not-science”, and repeat confidently (“isn’t it obvious?“) your original claims as if they have not been challenged?
An interesting paper, which possibly matches well with Williams many sources contributed already and the apparent logical conclusions (thereof).
This new study shows CMIP6 sea ice models overestimate key processes — again raising questions about reliability
A 2025 paper by West & Blockley found that CMIP6 climate models consistently overestimate how much Arctic sea ice melts, grows, and conducts heat when compared to real-world observations from ice mass balance (IMB) buoys. These are the kinds of measurements that track the ice’s response to air and ocean temperatures.
Across nearly all the models tested, the fluxes (energy flows) for melting in summer and growth/conduction in winter were too high, even after adjusting for ice thickness. That means the models simulate stronger reactions than what’s measured in the actual Arctic — exaggerating both melt and growth processes.
The study highlights that part of the error comes from model design choices, like how they represent sunlight entering the ice or how they handle slushy layers (“mushy-layer thermodynamics”). It also notes that current model archives lack enough detailed energy budget data to evaluate these processes well.
Why it matters: If models systematically overestimate how Arctic sea ice responds to warming, it creates more uncertainty in projections — especially when those models are used to inform real-world decisions about climate policy, infrastructure, and risk.
Link: https://gmd.copernicus.org/articles/18/3041/2025/
Implications for Arctic policy and CMIP6-based forecasts:
If CMIP6 models consistently overestimate both melt and growth of Arctic sea ice — as West & Blockley (2025) show — this undermines confidence in how well these models simulate real-world ice behavior. Since these models are widely used to inform climate policy, Arctic infrastructure planning, shipping routes, Indigenous livelihood protections, and national security risk assessments, such biases could lead to poor decisions or misplaced priorities. As William had suggested. I think he’s correct here, because it seems to naturally follow. A logical sequitur
Moreover, when CMIP6 is used to forecast sea ice extent — for example, predicting ice-free Septembers by certain dates — systematic errors in the underlying thermodynamics mean those timelines may be off by years or even decades, in either direction.
Until these biases are addressed and model processes aligned with real-world data (like from IMB buoys), policy advice based on these projections should be treated with caution — especially when decisions involve high stakes and short-term risk management in the rapidly changing Arctic.
PP: Why it matters: If models systematically overestimate how Arctic sea ice responds to warming, it creates more uncertainty in projections — especially when those models are used to inform real-world decisions about climate policy, infrastructure, and risk.
BPL: The models are unreliable! We shouldn’t base policy on them!
Where have I heard this before?
Yes, Heaven forfend we should cut emissions with inaccurate projections of the Blue Ocean Event advent date!
– “Yebo Kando” in response to an opponent, Jun 18: “ Personal attacks are against the forum policies! And only idiots make them! ”
– Piotr Jun 19: “You see the irony, right? (if not, I boldfaced it for you)”
Yebo Jun 22 “ I have to admit, I got a good giggle from this one. […]
I see [the irony] alright, the irony seems lost on you!
Ooouch! ;-) The only thing better than Yebo not getting the irony the first time, is …. Yebo still not getting that irony EVEN AFTER it was boldfaced to him, self-confidently proclaiming: “ I see [the irony] alright” – and … giggling from the opponent for …. not getting it: (“the irony seems lost on you!”).
Ladies and Gentlemen – “Yebo Kando” ! ;-)
Pedro Prieto: “ Until these biases are addressed, policy advice based on these projections should be treated with caution — especially when decisions involve high stakes and short-term risk management in the rapidly changing Arctic.
Could you be any more vague? Name several specific “high stakes and short-term risk management in the Arctic ” that have been undertaken based on the predictions of ice coverage by the general global circulation models.
As far as I know, nobody is navigating through the ice, nor even doing the short-term planning of the next year routes to the Arctic settlements – based on … the CMIP6 modelling of the future.
===
P.S. So far the only practical short-term “using” of the CMIP6 ice area component – are the deniers and the doomers employing the logic:
The CMIP6 trend for March is spot on and the September one shows -11 %/decade vs observed 13 %/decade, therefore …. we should NOT invest in renewables, EVs and impose price on carbon, because –
– either human use of fossil fuels does not warm the climate ( Ken Towe), thus we need no renewables, EVs and other technologies reducing GHG emissions
– that human burning of fossil fuels is not the “cause” of AGW, but merely a “symptom” (Multi-troll) and the real cause is Capitalism, industrialization and number of people, therefore the only way to fight AGW, is to overthrow Capitalism, and rapidly (over next decade or two) deindustrialize and depopulate the Earth (by 5.6 billion just to stabilize atm. CO2; by close to 8 bln for the real goal of stabilization of global T)
Look at G. Schmidt’s figure 3 again!
>> The CMIP6 trend for March is spot on
The March trend per decade is roughly between 0% and 4% with 95% probability
>> and the September one shows -11 %/decade vs observed 13 %/decade,
No, the September trend per decade is roughly between 2% and 40% with 95% probability
and that is after an incomplete analysis “”” I haven’t screened the CMIP6 models by climate sensitivity “””
Why do you pretend that uncertainties in that analysis do not exist? The y are clearly labeled, that the results are VERY broad for these CMIP6 simulation even for the incomplete analysis still including unrealistic sensitivities.
– Piotr 11 Jun:
” Name several specific [examples of ] “ high stakes and short-term risk management in the Arctic” [(c) “Perdo”], that have been undertaken based on the predictions of ice coverage by the general global circulation models. As far as I know, nobody is navigating through the ice, nor even doing the short-term planning of the next year routes to the Arctic settlements – based on … the CMIP6 modelling of the future.”
Multi-troll “Pedro P.” offers … no examples; in their place “Yebo Kando” steps in with:
YK: “ Why do you pretend that uncertainties in that analysis do not exist?
Ladies and Gentlemen: “Yebo Kando”.
Maybe it is time to come back to science in question!?
You wrote
>> and the September one shows -11 %/decade vs observed 13 %/decade,
Ito which replied:
No, the September trend per decade is roughly between 2% and 40% with 95% probability
Why do you pretend that uncertainties in that analysis do not exist?
“Yebo Kando” “ Maybe it is time to come back to science in question!?. You wrote and the September one shows -11 %/decade vs observed 13 %/decade”
No, I merely referred to Gavin Schmidt’s introductory article opening this thread
“ The CMIP6 ensemble mean for September area trends is now -11 %/decade (observed 13 %/decade) and the March trends are spot on.”
Which you would have known have you bothered to read the article we are supposed to discuss here, But you didn’t and instead you have INTERJECTED yourself into my discussion with Multitroll PP. on A DIFFERENT subject:
====
“Pedro Prieto” 10- Jun “ Until these biases are addressed, policy advice based on these projections should be treated with caution — especially when decisions involve high stakes and short-term risk management in the rapidly changing Arctic .
Me: 11 Jun: “Could you be any more vague? Name several specific high stakes and short-term risk management in the Arctic ” that have been undertaken based on the predictions of ice coverage by the [CMIPs]. As far as I know, nobody is navigating through the ice, nor even doing the short-term planning of the next year ice routes to the Arctic settlements – based on … the CMIP6 modelling of the future ice”
====
So if you have NOTHING TO SAY on the main point of discussion you interject yourself into – don’t pontificate on my devious actions that exist…. only in your head (“ Why do you pretend that uncertainties in that analysis do not exist? [(c) YK] ”
P.S. And if you have a problem with GAVIN’s words: “ The CMIP6 trend for March was “spot on” and the September one “-11 %/decade vs observed 13 %/decade,/i> ”
take it up with HIM.
And come better prepared, because, my Dear Vizzini, I don’t think your
YK The March trend is roughly between 0% and 4%/per decade with 95% probability ” means what you think it means.
(Hint – the observed trend being “between 0% and 4% /decade”, does NOT prove that this slope is SIGNIFICANTLY DIFFERENT from the respective slope of CMIP6 trend.
If you still don’t get it – ask the institution that taught you statistics for your money back).
Personal attacks are against the forum policies! And only idiots make them!
>> the observed trend being “between 0% and 4% /decade”, does NOT prove that this slope is SIGNIFICANTLY DIFFERENT from the respective slope of CMIP6 trend.
That of course that is a huge problem:
Your understanding seems a little backwards, there is no single “slope of CMIP6 trend”!
Only the real world measurements show one trend (with uncertainty) the CMIP6 model ensemble shows a very wide range for the likely trends for the arctic ice in March and September.
And everything from no ice loss in March to about triple the measured rate seems about equally likely in these models – hardly a useful tool for predictions it seems.
“Yebo Kando”: Personal attacks are against the forum policies! And only idiots make them!
You see the irony, right? (if not, I boldfaced it for you).
Now coming back to the original discussion::
=====
Yebo Kando 12 Jun: “You wrote and the September one shows -11 %/decade vs observed 13 %/decade”
Piotr 17 Jun- “No, I merely referred to Gavin Schmidt’s introductory article opening this thread “ The CMIP6 ensemble mean for September area trends is now -11 %/decade (observed 13 %/decade) and the March trends are spot on.”. You have INTERJECTED yourself into my discussion with Multitroll PP. on A DIFFERENT subject – what are his “ high stakes and short-term risk management in the Arctic” I quote:
Me: 11 Jun: “ Name several specific high stakes and short-term risk management in the Arctic ” that have been undertaken based on the predictions of ice coverage by the [CMIPs]. As far as I know, nobody is navigating through the ice, nor even doing the short-term planning of the next year ice routes to the Arctic settlements – based on … the CMIP6 modelling of the future ice”
So if you have NOTHING TO SAY on the main point of discussion you interject yourself into – don’t pontificate on my devious actions that exist…. only in your head (“ Why do you pretend that uncertainties in that analysis do not exist? [(c) YK] ”
====================
My argument still stands. Care to contest it?
P.S. Once you clarify that – we can move on to OTHER topics (like the quality of your understanding of statistics).
Yebo Kando says
18 Jun 2025 at 3:31 PM
Personal attacks are against the forum policies! And only idiots make them!
Yebo, ad hominem personal attacks is all they have.
You say: “Only the real world measurements show one trend (with uncertainty) the CMIP6 model ensemble shows a very wide range for the likely trends for the arctic ice in March and September. And everything from no ice loss in March to about triple the measured rate seems about equally likely in these models – hardly a useful tool for predictions it seems.”
Pedro: The latest ensemble mean still does not reflect observations well, the individual models are even more extreme and unsupportable. imv an average of errors does not reflect any reliable accuracy beyond random luck. The problem here is, imv, they have nothing else to present or rely upon. So it is fingers crosses CMIP7 will (by accident or prayer) do better, ‘jokingly’ intimated by Gavin himself in his article.
As William originally pointed out Yebo, and which was confirmed by the literate refs in the ‘Gemini assessment, analysis’ he linked to; there are errors/gaps in CMIP6 ASI output you could sail the Queen Mary through.
See William- June 1st CMIP6: A Step Forward?
Figure 3 now presents percent change in sea ice area, not extent — yet the CMIP6 ensemble still fails to match the observed trajectory.
The 2007–2012 collapse remains a clear outlier, still not captured by the mean, nor bounded by plausible confidence intervals.
The spread of model projections is disturbingly wide. For 2014, the 95% CI for September ice area ranges from ~3% to over 90% loss. By 2038, it [THE LOSS] ranges from 15% to well over 100%. These are not scientifically defensible bounds — they suggest fundamental incoherence, not physical realism.
https://www.realclimate.org/index.php/archives/2025/05/predicted-arctic-sea-ice-trends-over-time/#comment-834010
What is this saying? Well iirc the models are telling us one year the ASI minimum could be as little as 15% below the ASI maximum of March-and be within the Model forecast- i.e. accurate. In another year the ASI Loss from maximum could be more than 100% of what it was in March. These outcomes are physically impossible, and unsupportable. Yet they place this within their models 95% confidence range.
William’s summary with links to details is here:
Gemini RC CMIP6 ASI 4-Part William Critique Summary
https://docs.google.com/document/d/19P_WNQQNqk0LbBdFf3yiDs6NEltY1YFz4yMDR_yvD2k/edit?usp=sharing
The ‘devil they say’ is in the details.
Piotr says 19 Jun 2025 at 12:03 PM:
>> My argument still stands. Care to contest it?
I am sorry, I must have missed this argument!
You wrote something which seems incorrect:
“”The CMIP6 trend for March is spot on and the September one shows -11 %/decade vs observed 13 %/decade,””
And I corrected it:
Look at G. Schmidt’s figure 3 again!
>> The CMIP6 trend for March is spot on
The March trend per decade is roughly between 0% and 4% with 95% probability
>> and the September one shows -11 %/decade vs observed 13 %/decade,
“””No, the September trend per decade is roughly between 2% and 40% with 95% probability
and that is after an incomplete analysis “”” I haven’t screened the CMIP6 models by climate sensitivity “””
Why do you pretend that uncertainties in that analysis do not exist? The y are clearly labeled, that the results are VERY broad for these CMIP6 simulation even for the incomplete analysis still including unrealistic sensitivities.”””
I did not see any counter argument so far! That you cite a source making the same mistake does not counter the fact that you used a mean, when the model spread is relevant, which you so far did not address at all!
Do you doubt the model uncertainty as presented by G. Schmidt in figure 3 or do you contest the relevance of this uncertainty for the evaluation of the model performance?
May I recommend (again) to strictly stick to the argument this time and avoid all irrelevant squiggles? If there was any valid argument from your side, I really did not see it in all that noise
But I have to admit, I got a good giggle from this one.:
>> “Yebo Kando”: Personal attacks are against the forum policies! And only idiots make them!
You see the irony, right? (if not, I boldfaced it for you).
>> (like the quality of your understanding of statistics).
I see it alright, the irony seems lost on you, I see an unpersonal statement by me, followed by your words!
Again, my request to you to follow the forum rules and leave personal attacks elsewhere!
And of course my skills are completely irrelevant here, you need to present factual on topic arguments or lost this argument!
Pedro Prieto says 19 Jun 2025 at 7:50 PM:
>> The latest ensemble mean still does not reflect observations well, the individual models are even more extreme and unsupportable.
Here it gets very relevant G. Schmidt that writes he used an unscreened assemble to calculate his mean.
So that mean as shown in figure 3 is not only irrelevant for the trend comparison with the real world, which needs to account for uncertainty, but also of dubious origin.
Piotr 19 Jun My argument still stands. Care to contest it?
Yebo Kando: “I am sorry, I must have missed this argument!”
“missing” suggest an innocents mistake. Repeated ignoring of THE MAIN BODY of a post – deserves a very different word. For the record, you have interjected yourself into the discussion after I asked the multiple-personality doomer, ver. “Pedro” to prove his words:
“Name several specific [examples of ] “ high stakes and short-term risk management in the Arctic” [(c) “Perdo”], that have been undertaken based on the predictions of ice coverage by the [CMIP]”. On which claim “Pedro” was attacking climate scientists. Neither “Pedro” nor you provided the said examples.
YK 22 Jun “You wrote something which seems incorrect:
“”The CMIP6 trend for March is spot on and the September one shows -11 %/decade vs observed 13 %/decade,””
Repeating the same, already answered claims, hoping for a … different outcome? You know the definition of what it is, right? So I won’t be wasting time to explain things to you again, just copy and paste my previous answers to the same claims you made before:
YK 22 Jun “You wrote something which seems incorrect:
“”The CMIP6 trend for March is spot on and the September one shows -11 %/decade vs observed 13 %/decade,”
Piotr 17 Jun, “No, I merely referred to Gavin Schmidt’s introductory article opening this thread
“ The CMIP6 ensemble mean for September area trends is now -11 %/decade (observed 13 %/decade) and the March trends are spot on.”
Which you would have known have you bothered to read the article we are supposed to discuss here”
YK, 22 Jun “And I corrected it. Look”
Which I have already answered in my 17 Jun post:
Piotr 17 Jun: “if you have a problem with GAVIN’s words: “ The CMIP6 trend for March was “spot on” and the September one “-11 %/decade vs observed 13 %/decade,/i> ”
take it up with HIM”
Which part of “GAVIN” and “HIM”, already capitalized for you – are still incomprehensible to you?
P Jun 17: ” P.S. And come [to Gavin] better prepared, because, my Dear Vizzini, I don’t think “ The March trend is roughly between 0% and 4%/per decade with 95% probability ” means what you think it means. Hint – the observed trend being “between 0% and 4% /decade”, does NOT prove that this slope is SIGNIFICANTLY DIFFERENT from the respective slope of CMIP6 trend.”
Yebo, of course, understood nothing:
YK 18 Jun: “Personal attacks are against the forum policies! And only idiots make them!”
That of course that is a huge problem: Your understanding seems a little backwards, there is no single “slope of CMIP6 trend”!
Yes “huge problem” for you – since MY argument DOES NOT REQUIRE “ the single slope of CMIP6 trend”. See below.
YK: “ you used a mean, when the model spread is relevant ”
Could you make a more confused argument?
If you have line A, which slope varies over different decades, and if line B MATCHES the temporal variations in A – “spot on” – then you CAN’T disprove the match by saying that …. the slope of line A is not constant over decades ….
And based on that “knowledge” of statistics YOU, “Yebo Kando” …. lecture Gavin, one the top climate scientists:
“ Why do you pretend that uncertainties in that analysis do not exist?” AND “you used a mean, when the model spread is relevant ”
Your ignorance of statistics is on the institution that taught you statistics – your arrogance you built on that ignorance – is all on you.
Just to clarify, I specifically asked
>>Do you doubt the model uncertainty as presented by G. Schmidt in figure 3 or do you contest the relevance of this uncertainty for the evaluation of the model performance?
From your a bit confused answer I seem to read that you agree that the model results have massive uncertainties as displayed , but you think it is okay to ignore that, do I read you correctly there?
(Which is of course wrong)
Would you care to elaborate why it might be okay to ignore the uncertainties as it seems a very unique way to look at data.
BTW since “Gavin said so” is not an argument, you still lacking one.
Pedro Prieto:
Thanks for making time to reply.
Regarding what I read as the primary thrust of what you said, I’ll offer my observation that policy implications are not the main point of what Gavin’s article was trying to highlight. Obviously this is an important concern. I don’t observe that most anybody involved in climate modeling/research is unaware of the urgency. But that is a separate complex discussion. I don’t think it is necessary, or useful, to require a story’s author to heap policy implications into a focus on model skill improvement with each generation of CMIP. Sometimes less is more.
Gavin’s primary conclusion seems supported:
“As we have often stated, models are always wrong, but the degree to which they can be useful needs to be addressed… but there doesn’t appear to be a single thing that needed to be fixed for that to happen. Rather, an accumulation of improvements – in physics, resolution, completeness, forcings – have led to a gradual improvement in skill (not just in the sea ice trends!).”
Reply to David
You’re welcome, we do what we can. Work without a purpose, beyond an end in it’s own self-glorification is not worth doing. The end point to all this sciencey stuff is nothing other than policy outcomes. Been like that since day one. Long before Hansen came on the scene. Go check.
But a small note on the quote. I have read Gavin’s article. The only thing supporting that paragraph is hot air. Typically, nothing is nothing. I do wish it wasn’t so. May I humbly recommend Bardi’s the Seneca cliff?
Thanks for responding kindly.
Re: “The end point to all this sciencey stuff is nothing other than policy outcomes. Been like that since day one. Long before Hansen came on the scene. Go check.”
I checked. You’re incorrect, as are your alt-accounts. For example, Arrhenius in the late 19 century was investigating CO2-induced climate change because he wanted to understand ice ages. It wasn’t for the sake of policy on fossil fuels, since he didn’t think industrial activity would soon increase CO2 levels substantially.
Plenty of scientists and other informed people discuss science for reasons other than policy. Some people, for instance, like learning for its own sake and want to understand how the world works. If you’re not like that, then that’s fine. But it’s unfair for you to criticize the article’s discussion of science simply because it doesn’t cater to your policy concerns.
Atomsk’s Sanakan says – “I checked. You’re incorrect”
17 Jun 2025 at 3:03 PM
That is a “big call”. For your sake I hope you have the evidence to back it up.
a short note
Piotr says – posting on the website devoted to AGW and its mitigation
nigelj says: This is strictly speaking off topic on an anthropogenic climate change website.
I don’t know what others did but I did read the first ref provided by Gavin in his article
https://www.science.org/doi/10.1126/sciadv.adt8035 which seems clear to me what the purpose of CMIP is for.
Similarly: D. Notz, and S. Community, “Arctic Sea Ice in CMIP6”, Geophysical Research Letters, vol. 47, 2020. http://dx.doi.org/10.1029/2019GL086749
None of these are purely academic exercises, nor the motivated curiosities of individual scientists being indulged.
Atomsk’s Sanakan says a lot. Let’s break that down to see what’s really there.
17 Jun 2025 at 3:03 PM
– “as are your alt-accounts.” [-false baseless allegations are dismissed/ignored]
– “it’s unfair for [me]” ?
– “simply because” “to [my] policy concerns” ?
– “I checked. You’re incorrect” ?
– “people discuss science for reasons other than policy.” ?
– “to understand how the world works.” ?
I addressed several basic points in my original post. Let’s focus on the critical one being denied here: “The end point to all this sciencey stuff is nothing other than policy outcomes.”
In response, it was claimed: “people discuss science for reasons other than policy.”
That may be so—but let us remember: I am a person too. I count. So does the IPCC, and so do many others engaged in this process.
Let’s look at this in context:
[ June 4: I agree that the spread and variability in the models is large – it would be good for someone (else!) to try and narrow that. – gavin ]
[ June 4: CMIP is not a policy providing organization. It’s just organizing the simulations. Assessments for policy purposes that might use CMIP outputs are run by IPCC, NCA, UNEP etc. – gavin ]
Gavin is right to point out that CMIP’s primary function is not to make policy.
But he also clearly affirms what has been true for decades: the entire climate modeling enterprise exists to support policy-relevant science. Its value lies in producing a robust foundation for understanding, assessing, and responding to anthropogenic climate change—for policymakers, governments, and societies.
It is 2025, not 1887. Context matters.
When I say, “it’s been like that since day one,” the unspoken clause is: “regarding modern anthropogenic global warming and climate change.”
I had assumed that was understood—given the very purpose of RealClimate. I was thinking of the lineage from the 1970s onward: Bert Bolin, Michael MacCracken, Syukuro Manabe, William P. Elliott—pre-Hansen researchers. This was never idle curiosity. It was global, consequential, purposeful work.
Informing Policy and Governance
Let’s now break this down into more digestible parts. This is the crucial “what for.” The utility of climate models lies in their capacity to project future climate conditions under a range of emissions scenarios. This information is essential for:
1) International Climate Negotiations: Guiding discussions and agreements like the Paris Agreement.
2) National Climate Policies: Helping governments set emissions reduction targets, develop adaptation strategies, and invest in climate resilience.
3) Sectoral Planning: Informing decisions in agriculture, water management, infrastructure development (e.g., sea-level rise impacts on coastal cities), energy policy, and public health.
4) Risk Assessment: Allowing businesses, communities, and insurers to assess future climate risks (e.g., heatwaves, floods, droughts) and prepare accordingly.
CMIP output critically informs the IPCC process. The Intergovernmental Panel on Climate Change (IPCC) is the world’s leading body for assessing climate change. Its purpose is to synthesize and assess the vast body of peer-reviewed scientific literature published globally. This includes, crucially, the output from CMIP.
Its primary output is comprehensive Assessment Reports (ARs), Special Reports, and Methodology Reports. These reports cover:
The physical science basis of climate change.
Impacts, adaptation, and vulnerability to climate change.
Mitigation of climate change (reducing greenhouse gas emissions).
The IPCC’s primary purpose is to provide science-based understanding to inform policymaking. In other words, it delivers scenarios that answer “what happens if,” using tools like CMIP.
Handy Refs:
1- RC Gavin, William, et al
2- National Academies http://www.nationalacademies.org
Can climate models reliably project future conditions? – National Academies
Climate models provide reliable projections of many aspects of a warming planet over the next century and beyond due to human-caused climate change.
3- Aon http://www.aon.com
How Companies Are Using Climate Modeling to Improve Risk Decisions – Aon
Climate risk models offer a crucial opportunity to go beyond a historical view of risk to adequately assess, quantify and mitigate the impacts of climate change …
4- DCCEEW http://www.dcceew.gov.au
Intergovernmental Panel on Climate Change – DCCEEW
The Intergovernmental Panel on Climate Change (IPCC) is the leading international body for assessment of climate change. It is a key source of scientific …
5- UNFCCC unfccc.int
Everything You Need to Know About the IPCC Report – UNFCCC
The IPCC was set up in 1988 by the World Meteorological Organization (WMO) and the United Nations Environment Programme (UNEP) to provide policymakers with …
6- Wikipedia en.wikipedia.org
Intergovernmental Panel on Climate Change – Wikipedia
Assessment reports. edit. Main articles: IPCC First Assessment Report, IPCC Second Assessment Report, IPCC Third Assessment Report, IPCC Fourth Assessment …
I believe this illustrates well enough how the world works today.
PP: the entire climate modeling enterprise exists to support policy-relevant science. . . . The IPCC’s primary purpose is to provide science-based understanding to inform policymaking
BPL: The entire climate modeling enterprise exists to better understand the climate. GCMs have also been constructed for Venus, Mars, and Titan; none of this is immediately relevant to policy. And the IPCC is distinct from the climate modeling enterprise. It uses results from it.
Multi-troll, here using his “WIlliam” handle:: “ a short note Piotr says – posting on the website devoted to AGW and its mitigation”
Read the rest of it, Buttercup. To help you focus – I have bold-faced the important part:
=== UV, from an exchange about Paul Pukite, ================
Piotr Jun 17: “My criticism of Paul Pukite is not JUST because he posts on the website devoted to AGW and its mitigation, the stuff that is at best tangential to AGW (ENSO is a short-term noise around the multidecadal AGW trend) or entirely irrelevant – we can’t mitigate AGW by making El Nino stronger or weaker.
It’s much WORSE than that – he tries to advance his interests in ENSO at the expense of studying AGW and by trying to discredit climate scientists by:
either claiming that there is not much left to learn in climate change, or the opposite – by saying that Gavin and his colleagues [ are worse than those] pushing Ivermectin instead vaccines against COVID (see the footnote).”
And he needs it to push for a switch in research priorities and funding AWAY from the climate change and TOWARD shorter-term oscillations around the mean, like ENSO”.
====
Any witty repartees to my UNCUT argument?
=============================
^* – Gavin: “a solar max warms the stratosphere”
– Paul Pukite: “That’s embarrassing to mention sunspots. Attributing solar sunspot cycles to climate variation is the equivalent of prescribing Ivermectin.. Perhaps worse because you guys claim to understand the physics.”
– Multi-Troll, elsewhere: “Myself, JCM, Paul Pukite and Killian are the last ones here still grounded in unbiased reason and scientific fundamentals“.
==============================
;-)
re Atomsk Sanakan’s post, most of which I repeat:
This made me want to stand up and cheer. Thank you.
—
I post this because the petty responses once again overwhelm the value. But let’s avoid the alt account/multitroll attacks which blind people to meaning.
Pedro,
I think I largely agree with your concept (laid out further down the thread) of the various critical needs stakeholders require in order to craft informed climate policy. And what that requires from the climate science community as a whole to satisfy those needs. If that was for me, I appreciate it, but I could have saved you some time there.
I simply do not agree that in this particular case, Gavin’s article has to address policy concerns to be informative and of use by myself or others. For myself, I’ll happily consume worthy articles, papers, comments etc. if they focus on the science, the policy, or both science & policy surrounding climate change.
Reply to David
21 Jun 2025 at 12:49 PM
Hi, thanks for the rely. Though please note I never said Gavin’s article has to address policy concerns. Or had to in order to be useful. I made a simple point about the relevance of policy, while I still disagree with his conclusion. That’s all it was. Nothing personal. People of good will can see things differently.
Re: “I addressed several basic points in my original post. Let’s focus on the critical one being denied here: “The end point to all this sciencey stuff is nothing other than policy outcomes.”
In response, it was claimed: “people discuss science for reasons other than policy.”
That may be so—but let us remember: I am a person too. I count. So does the IPCC, and so do many others engaged in this process.”
Well, I’m also a person and I count. The endpoint of climate science for me is not policy, but understanding the world. In fact, I don’t have a climate policy position. I’m interested in climate science because I saw ideologues misrepresenting the topic (unfortunately a lot from the USA’s political right), and I wanted to understand the topic they were misrepresenting. That’s it. That’s why I’ve read RealClimate articles for over a decade. I’m sure there are plenty of other people like me.
Re: “But he also clearly affirms what has been true for decades: the entire climate modeling enterprise exists to support policy-relevant science. Its value lies in producing a robust foundation for understanding, assessing, and responding to anthropogenic climate change—for policymakers, governments, and societies. It is 2025, not 1887. Context matters.”
Nope. For example, climate scientists still model and study non-anthropogenic climate change. Trenberth diagrams are still published for astronomical bodies other than the Earth ( https://doi.org/10.1002/qj.2704 ). And so on. Climate science is there to improve understanding within its domain, regardless of whether that understanding is used for policy. In that respect it’s similar to other scientific fields that have basic science alongside applied science. And you can stop using alt-accounts to spam the forum.
Piotr boldly asserts:
Yes, I don’t think correlating with sunspot data is such a good path to follow while the correlation with tidal and annual cycles is so promising. Once again this is an analysis of mine that’s been ongoing for at least 10 years and available in the scientific literature since 2018 when I published it. The signal processing finding is that the spectral decomposition of an ENSO index such as NINO4, NINO34, NINO3, etc shows strong peaks at frequencies expected from the nonlinear mixing of the primary tidal cycles with annual/biannual periods. I initially looked into an ENSO connection based on the much more obvious spectral matching of tidal cycles with the time-series of atmospheric QBO. Both are described in Mathematical Geoenergy (Wiley, 2018), and I’ve been seeking replication of these results off and on since that time.
I have two observations so far:
(1) No one has debunked this finding
(2) No one has replicated this finding or really cited it anywhere in the research literature.
(1) Is easy to explain. No one can debunk the claim because a signal processing match is a signal processing match and there is no way that this can be undone. The top 12 spectral peaks of a 140-year ENSO time series match exactly with that expected from mixing of primary tidal cycles with annual harmonics. In contrast, the sunspot cycles do not match any ENSO spectral peaks.
(2) Is perplexing to me. There’s nothing in it for a researcher to replicate someone else’s research, as it doesn’t pay any bills. Yet, you would think that replication is implicit if there is some spin-off climate research that builds off the findings. For example, modeling ENSO using this approach would be useful in discriminating natural variation from the global temperature signal. But no one is doing that.
To cap it off, a related finding by Ohio State researchers make the same claim of tidal forcing but without the supporting spectral matching that I reported. However, because of some mistakes they made in interpretation of the results, it recently has undergone a re-evaluation via a published comment:
https://www.pubpeer.com/publications/C57095317935FE75B92183A3EB1C6F
This is a case of (1) where scientists are motivated to debunk a claim. See how that works?
Yet, scientists continue to bring up the strawman argument of sunspot cycles. It is indeed a wonderful scientific strawman — so trivial to debunk and one doesn’t have to worry about replicating results that don’t really exist.
This is as good a place as any to mention Nvidia’s June 10th announcement of its new “Earth-2 Generative AI Foundation Model” (https://blogs.nvidia.com/blog/earth2-generative-ai-foundation-model-global-climate-kilometer-scale-resolution).
The Wall Street Journal said (https://www.wsj.com/articles/nvidia-climate-in-a-bottle-opens-a-view-into-earths-future-what-will-we-do-with-it-f602d8de):
The AI-powered platform stands to dramatically improve the resolution of climate prediction, crucial to both planetary well-being and business and financial risk management
The WSJ piece includes the expected caveats about the risks of basing policy on model projections. I’ve seen no other coverage of the announcement.
With a follow-up to David’s comment.
It’s a critical point, and it’s a testament to good science communication when the “why” behind significant scientific endeavors becomes clear. I believe I am absolutely correct: CMIP is not simply for scientific curiosity, though that’s a powerful motivator for individual researchers. The global investment in CMIP, involving millions of dollars each year, hundreds of scientists, immense computing power, and international coordination, is driven by a profound and urgent societal need.
Let’s reiterate the Overarching Purpose is Enabling Informed Global Action on Climate Change
iow the driving purpose behind CMIP is to empower humanity with the best possible scientific understanding of climate change so that societies, economies, and governments can make informed decisions to:
1) Mitigate Climate Change: To reduce greenhouse gas emissions and limit global warming to manageable levels.
2) Adapt to Climate Change: To prepare for and reduce the negative impacts of unavoidable climate change. This requires detailed, robust projections .
3) Attribute and Understand Current Changes: CMIP’s historical simulations are crucial for attributing observed climate changes (e.g., specific heatwaves or changes in rainfall) to human influence, rather than natural variability. This scientific certainty underpins the urgency and legitimacy of climate action. Without this attribution, it would be much harder to build consensus for the large-scale societal transformations required.
The “Millions Every Year” Justification: The investment isn’t just for “scientific curiosity” because the stakes are incredibly high. The cost of not understanding and responding to climate change far outweighs the cost of running CMIP. When the output of CMIP is flawed or erroneous, or not fit for purpose, then everything else that depends on these models falls in a heap.
This is deadly serious work with long term implications. Not fun and games to joke about when things are wonky and unknown.
So consider:
The Economic Costs of Inaction or Errors leading to damage from extreme weather events, loss of agricultural productivity, displacement of populations, health crises, and economic disruption run into trillions of dollars globally. Human Costs of Loss of life, livelihoods, and societal stability. Investment Decisions of Trillions of dollars being invested globally in new infrastructure, energy systems, and urban planning. Without reliable climate projections from CMIP, these investments could be maladapted, leading to huge wasted resources and increased vulnerability.
In essence, CMIP provides the evidence base that informs climate policy, shapes investment decisions, and drives societal adaptation and mitigation efforts worldwide. It’s a fundamental pillar of global climate governance and risk management
A very short summary of why people tend to shy away from obtaining more information on a topic, especially that which counters their pre-existing beliefs and opinions:
People often actively seek out information that aligns with their existing beliefs, a phenomenon known as confirmation bias. This is because it is psychologically comfortable to reinforce what we already think we know. Confronting information that contradicts our deeply held convictions can create cognitive dissonance, an uncomfortable mental state arising from holding conflicting beliefs or ideas.
To alleviate this discomfort, individuals may disregard, downplay, or subconsciously misinterpret the contradictory evidence, rather than re-evaluating their own stance. This isn’t necessarily a conscious decision to avoid truth, but rather a natural human inclination to maintain a sense of consistency and certainty in their worldview.
Furthermore, social and emotional factors play a significant role. Our beliefs are often intertwined with our identity, our social groups, and our sense of belonging. Challenging these beliefs can feel like challenging ourselves or betraying our community.
Therefore, individuals may be hesitant to engage with counter-arguments, not out of intellectual laziness, but out of a desire to preserve their social connections and avoid potential ostracism. In an increasingly polarized world, the perceived social cost of changing one’s mind can be higher than the intellectual benefit of considering alternative viewpoints.
On the other hand, “Knowledge is power” is a famous aphorism that generally means that having information and understanding (knowledge) gives one an advantage, influence, or control (power) over situations, people, or resources. It implies that the more one knows, the better equipped they are to navigate the world, make informed decisions, achieve goals, and exert influence.
The Origin of “Knowledge is Power”
While the sentiment existed in various forms earlier, the precise phrasing “scientia potentia est” (knowledge is power) is often attributed to Sir Francis Bacon from his work Meditationes Sacrae (1597), where he wrote “ipsa scientia potestas est” (“knowledge itself is power”). The exact phrase “scientia potentia est” was later written by Thomas Hobbes in the 1668 Latin version of Leviathan; Hobbes was Bacon’s secretary as a young man. The concept itself can be traced back to earlier sources, including the Biblical (Jewish) Book of Proverbs and Persian poetry.
“Know Thyself” (Pythagoras and other Greek thinkers)
“Know thyself” (Greek: Γνω~θι σϵαυτoˊν, gnōthi seauton) is an ancient Greek aphorism inscribed at the Temple of Apollo at Delphi. While often associated with Pythagoras and later prominently by Socrates, its exact origin is debated, and it was a widely accepted philosophical maxim.
The principal meaning of “know thyself” in its original application was to understand one’s limits, one’s place in the world, and one’s mortality. It was a caution against hubris and overestimation of one’s abilities. For Socrates, it evolved to mean a deep examination of one’s own character, beliefs, principles, and desires – essentially, knowing one’s own soul and its virtues and flaws. It’s about self-awareness, introspection, and understanding the inner workings of one’s own mind and motivations.
The Contrast between “Knowledge is Power” and “Know Thyself”
The two phrases represent distinct, though not entirely unrelated, philosophies:
“Knowledge is power” (External Focus): This maxim emphasizes the acquisition of external information and its application to manipulate or control the external world. It’s about gaining mastery over one’s environment, solving practical problems, and achieving outward success. The power derived from this knowledge is often tangible, allowing one to build, innovate, persuade, or even dominate. It’s about what you can do with what you know.
“Know thyself” (Internal Focus): This maxim emphasizes internal understanding and self-mastery. It’s about delving into one’s own being, recognizing one’s strengths and weaknesses, values, and inherent nature. The “power” here is more about personal wisdom, inner peace, ethical living, and authentic self-expression. It’s about understanding who you are and thereby achieving a sense of purpose and integrity.
In essence, “Knowledge is Power” looks outward to conquer and control, while “Know Thyself” looks inward to understand and integrate. One is about external efficacy, the other about internal wisdom. While external knowledge can be used for good or ill, self-knowledge is generally seen as foundational for virtuous action and a well-lived life. A person who “knows thyself” might use “knowledge is power” more wisely, as their external actions would be guided by a deeper understanding of their own moral compass and limitations.
And this is where the true story begins. Including why this story is so deeply connected to climate science.
Multi-troll PP: “A very short summary” … two pages of PP’s musings follow. If this is “a very short summary” – I shudder to think how long the full text must be.
BTW – which was first for you – anti-capitalism or Marx (with his “Law of transformation of Quantity into Quality”)?
Arctic Ice Lesson [Trigger Warning: Sensitive individuals take note; this is on topic.]
I had asked MAR about plotting ice and temp on the same graph on the other thread, but I only just discovered his response thanks to it being buried by the troll-spam. So guilt overcame my laziness and I did some research myself. Here’s what I learned.
1. As I often say, real science discussions require that everyone speak the same language. But different sources treat summer and winter differently. The term “ice free summer” is a bit tautological, because august-september is labelled as “summer” because of the minimal ice condition.
The source I am using, DMI, uses the conventional 3-month definitions, related obviously to TOA insolation, which is how I have always understood it.
2. Temperature by season:
https://ocean.dmi.dk/arctic/meant80n_anomaly.php
3. Ice and temp on the same plot:
https://ocean.dmi.dk/arctic/hysteresis_v2/hysteresis.uk.php
The hysteresis plot seem a little glitchy on my old machine, but it works enough to illustrate what the explanation is saying.
So, there really is no mystery or ineptitude about what is happening. The system has changed.
(Thanks to MAR, whose original comment to that effect was correct.)
The collective dismissal of my response – Pedro Prieto says 18 Jun 2025 at 7:14 PM – about the CMIP policy purposes to Atomsk’s Sanakan arrived based on the usual ad hominem and logically fallacious arguments.
Barton Paul Levenson raises the irrelevancy of Mars, Venus and Titan ‘GCMs’. And the selectively false disinformation the “IPCC is distinct from the climate modeling enterprise.” It is not.
19 Jun 2025 at 8:12 AM
Piotr Trela says? – I don’t know as I never read their offensive hostile and incoherent commentaries
19 Jun 2025 at 11:15 AM
Susan Anderson doubles down on the pettiness.
19 Jun 2025 at 1:41 PM
In response I share the following:
Carbon Brief charts more than 50 key moments in the history of climate modelling, including:
Syukuro Manabe and Richard Wetherald’s seminal climate modelling study in 1967.
The Met Office’s first general circulation model in 1972.
The Charney Report in 1979.
James Hansen’s three scenarios published in 1988.
The first Intergovernmental Panel on Climate Change (IPCC) report published in 1990.
The Coupled Model Intercomparison Project (CMIP) launched in 1995.
The IPCC’s fifth assessment report published in 2013.
https://www.carbonbrief.org/timeline-history-climate-modelling/
So much for Barton’s pushback.
The Coupled Model Intercomparison Project (CMIP) was formally organized and established in 1995. The driving force behind the creation and ongoing coordination of CMIP is The World Climate Research Programme (WCRP). Specifically, it was organized by the Working Group on Coupled Modelling (WGCM), which is a joint working group of the WCRP and the Climate and Ocean: Variability, Predictability and Change (CLIVAR) program.
The WCRP itself is co-sponsored by major international scientific organizations incl. World Meteorological Organization (WMO), Intergovernmental Oceanographic Commission (IOC) of UNESCO, International Science Council (ISC) (formerly the International Council for Science, ICSU)
The WCRP supports the development of actionable climate information, scientific assessments, educational approaches, and public communication strategies that require collaborative efforts with multi-sectoral actors in all regions of the globe.
WCRP’s work involves hundreds of scientists throughout the world, organized around a large number of research projects, activities, events, and publications. WCRP science underpins the United Nations Framework Convention on Climate Change (UNFCCC), including national commitments under the Paris Agreement of 2015, and contributes to the knowledge that supports the 2030 Agenda for Sustainable Development, the Sendai Framework for Disaster Risk Reduction, and multilateral environmental conventions.
https://wmo.int/activities/world-climate-research-programme-wcrp
https://www.wcrp-climate.org/wgcm-cmip/cmip-video
The WCRP and WGCM have nothing to do with Titan nor ad hominem but their work and output has everything to do with my prior factual response. The combined ultimate purpose of the entire climate modeling enterprise exists to support policy-relevant science. Its value lies in producing a robust foundation for understanding, assessing, and responding to anthropogenic climate change—for policymakers, governments, and societies. The enterprise includes the WMO, CMIP and the WCRP along with the IPCC and the UNFCCC system. The IPCC’s primary purpose is to provide science-based understanding to inform policymaking of the UNFCCC.
In other words, the IPCC and the whole collective enterprise delivers scenarios that answer “what happens if,” using tools like CMIP. Which directly leads into Policy Making and Action Plans. Hopefully effective ones that work.
Pedro Prieto:” ,i>The collective dismissal of my response”
Ever crossed your mind that perhaps it’s not us, but you? Nah, perish the thought.
I cannot see why it would cross his mind.
Because it is all on you. No perhaps. Definitely 100% it is you. Not Pedro. Not Paul Pukite. Not Ken Towe. Not Scott Nudds. Not Thessalonia. And not me. Not Mr KIA either. No one else. Just you lot. No one else.
“William” : I cannot see why it would cross his mind.
What “William”, cannot or can see – is irrelevant – I have replied to “Pedro” opinion, and we discuss “Pedro”‘s mind, You, are “William”, not “Pedro” – remember?
Piotr says
22 Jun 2025 at 12:13 PM
“William” : I cannot see why it would cross his mind.
“Troll”: What “William”, cannot or can see – is irrelevant – I have replied to “Pedro” opinion, and we discuss “Pedro”‘s mind, You, are “William”, not “Pedro” – remember?
William: You have no authority here. This is public forum. I will comment how I see fit. Your opinion and your wishes carry no weight.
Piotr 21 Jun: “What “William”, cannot or can see – is irrelevant – I have replied to “Pedro” opinion, and we discuss “Pedro”‘s mind, You, are “William”, not “Pedro” – remember?”
“William”: You have no authority here
Neither you have the authority to presume that Pedro, who you claimed is not you, is unable to answer a simple question about Pedro’s own words:
=====
Pedro: “ The collective dismissal of my response”
Piotr to Pedro, NOT “William”: Ever crossed your mind that perhaps it’s not us, but you?”
======
nor that he is incapable of self-reflection, just because some “William” who is not him, can’t.
PP says ” the combined ultimate purpose of the entire climate modeling enterprise exists to support policy-relevant science. Its value lies in producing a robust foundation for understanding, assessing, and responding to anthropogenic climate change—for policymakers, governments, and societies.”
No. Climate models are primarily about understanding what is happening with climate for the sake of understanding. Informing policy responses is an additional thing. Climate modeling developed well before the global warming issue, so is not about AGW or the related policy responses.
From google gemini: “The first climate model, a general circulation model (GCM), was developed by Norman Phillips in 1956. He used a computer to simulate seasonal patterns in the Earth’s lower atmosphere (troposphere). This model was a significant step in understanding and predicting long-term climate patterns. In 1969, the first coupled model simulating the interaction between the atmosphere and ocean was developed, further advancing climate modeling.”
Climate models became more urgently needed with the anthropogenic warming problem, and they took a leap forwards in sophistication. That’s all.
Reply to Nigel Jones
21 Jun 2025 at 6:36 PM
My reference covered Norman Phillips (1956) well enough without needing a full Gemini-generated paragraph. There’s a first time for everything — now you know who he is.
Have a look: https://www.carbonbrief.org/timeline-history-climate-modelling/
As for your “No.” — you’re entitled to disagree, even with two generations of the most respected minds in climate science. But don’t mistake it for a strong argument. Because it’s not even a weak argument.
Pedro Prieto, you still don’t seem to be understanding me, so I will try to be clearer. Let me remind you of your original contention:
=”the combined ultimate purpose of the entire climate modeling enterprise exists to support policy-relevant science. Its value lies in producing a robust foundation for understanding, assessing, and responding to anthropogenic climate change—for policymakers, governments, and societies.”
All you have done following that is contention is to document that most of the recent climate modelling is targeted at the anthropogenic climate change, and will be helpful with formulating solutions. I have not disagreed with that documentation. This doesn’t demonstrate that the entire purpose of ALL climate modelling is about anthropogenic climate change as per your contention. I gave you clear references otherwise. So has BPL. So have other people. PP researches causes of el nino and writes models for this. Models take many forms.
You have made a wild generalisation. Instead of walking back from this and saying something like “I agree that climate modelling has many purposes but informing policy related to AGW is a big one right now, and so….” you become stubborn, and fill up pages with history lessons.
”the combined ultimate purpose of the entire climate modeling enterprise exists to support policy-relevant science.”
Nigel, get a clue. Take up gardening instead of trolling this +%# “I have not disagreed with that documentation.” and all the rest of your fallacious diatribes.
https://www.logicallyfallacious.com/logicalfallacies/Ad-Hoc-Rescue
Prieto principle
”the combined ultimate purpose of the entire climate modeling “enterprise” exists to support policy-relevant science.”
PPs emphasis of the word enterprise doesn’t change anything, and make him correct. The climate model ‘enterprise’ is still at least partly about understanding climate in general, and is not all about anthropogenic climate change and its relationship to policy. The climate model enterprise has existed since the 1950s so clearly is about more than just anthropogenic climate change. From Merriam Webster dictionary: enterprise, “a project or undertaking that is especially difficult, complicated, or risky.” Clearly this describes a climate model or group of models, or university or other organisation preparing the work.
If he had said modelling anthropogenic climate change exists only to help meet policy goals he would have been clearer, but arguably still wrong anyway. If the world decided to live with climate change and have no policies on it climate modelling related to climate change would probably still continue in some form. Because people like to know how things work and whats happening or might happen.
“Nigel, get a clue. Take up gardening instead of trolling this +%# “I have not disagreed with that documentation.” and all the rest of your fallacious diatribes.”
Notice how PP doesn’t falsify this with evidence. Because he can’t, so he just insults people.
Pedro Prieto: “ My reference covered Norman Phillips (1956). There’s a first time for everything — now you know who he is.” […] you’re entitled to disagree, even with two generations of the most respected minds in climate science. But don’t mistake it for a strong argument. Because it’s not even a weak argument.
So …. if Norman Phillips said something in 1956 – it means that “two generations of the most respected minds in climate science.” thought the same? Thus, by extension, anybody disagreeing in anything with “Pedro P.” – disagrees with “two generations of the most respected minds in climate science.”?
But don’t mistake it for a weak argument. Because unlike NIgel’s, Pedro’s is one Tremendous argument! Some may even say the “Big Beautiful Argument!”. And to better appreciate its Bigness, the main points of this discussion;
– the central view of “Pedro” here is: ” the ultimate purpose of the entire climate modeling enterprise is “support policy-relevant science” of AGW”.
So, to advance it, Pedro transferred here snippets of the discussion on that very topic from the UV thread. Strangely enough, Pedro DIDN’T transfer Paul Pukite from that UV thread – even though Pukite posted 100(s)? of posts on ENSO, i.e. a topic having very little to do with AGW and its mitigation. In fact, P. Pukite was critical of studying AGW – either by saying Gavin et al. were worse than the quacks pushing the Ivermectin for COVID. or alternatively – suggesting that AGW research pretty much learned what was to be learnt about AGW, and now is the time to …. shift the research focus and funds AWAY from studying and providing advice on AGW, and toward studying … the short -term oscillations around the mean – like ENSO, which occurrence we can’t mitigate.
So pretty much: 180 degree from Pedro’s view, and yet Pedro decided to attack not Paul Puite, but … Nigel whose views on this are VERY CLOSE to Pedro’s::
===:
Nigel to P. Pukite: “ This is about your posting comments on this website which are mostly about the causes of ENSO and similar cycles. This is, strictly speaking, off topic on an anthropogenic climate change website. I thought this 6 years ago when I first read your comments, but I’m a little bit more tolerant of off topic than Piotr. However [now] you really are pushing beyond the limits of what is tolerable”
===
To sum up – Pedro patronizing dismisses NOT the person who argues the opposite to his views, but somebody who, short of a few caveats, agrees with him … ;-)
Could it be …. all personal? After all,
– the Prieto Principle put Nigel on his enemies list (twice!)
– while as “William” and “Pedro” defended Paul Pukite, and as “The Prieto Principle” listed: Paul Pukite, JCM, Killian and himself as: “ the last ones here still grounded in unbiased reason and scientific fundamentals“ ?
Amica veritas, sed Pukite maior amicus est? (or something like that ..).
Piotr Jun 24: “To sum up – Pedro patronizingly dismisses NOT the person who argues the views OPPOSITE to his, but somebody who, short of a few caveats, agrees with him … ;-)”
A true revolutionary can tolerate their very opposite, but never somebody on the same side that is not committed to the EXACTLY the same position. That’s why Christians were more lethal to the Jews with whom they share the Old Testament than to the pagans, Which reminds me a classic joke by Emo Phillips:
====
Emo P: “Once I saw this guy on a bridge about to jump.
– I said: “Don’t do it!” . He said: “Nobody loves me.”
– I said: “God loves you.” “Do you believe in God?”- he said: “Yes” I said
– “Are you a Christian or a Jew?” He said: “A Christian.” I said: “Me, too!
– “Protestant or Catholic?” He said: “Protestant.” I said: “Me, too! ”
– “What franchise?” He said: “Baptist.” I said: “Me, too!
– “Northern Baptist or Southern Baptist?” He said: “Northern Baptist.” I said: “Me, too!
– “Northern Conservative Baptist or Northern Liberal Baptist?” He said: “Northern Conservative Baptist.” I said: “Me, too!
– “Northern Conservative Baptist Great Lakes Region, or Northern Conservative Baptist Eastern Region?” He said: “Northern Conservative Baptist Great Lakes Region.” I said: “Me, too!”
-“Northern Conservative Baptist Great Lakes Region Council of 1879, or Northern Conservative Baptist Great Lakes Region Council of 1912?” He said: “Northern Conservative Baptist Great Lakes Region Council of 1912.” I said: “Die, heretic!” And I pushed him over.
=====
PP: Barton Paul Levenson raises the irrelevancy of Mars, Venus and Titan ‘GCMs’. And the selectively false disinformation the “IPCC is distinct from the climate modeling enterprise.” It is not.
BPL: Don’t accuse me of disinformation, you undercover prat. What I said was the simple truth. The IPCC reports what the models say; it never has and never will commission the models. Quit spreading lies.
TPP: “undercover prat”? Really?
“Pedro” was 100% correct: Barton Paul Levenson raises the irrelevancy of Mars, Venus and Titan ‘GCMs’. And the selectively false disinformation the “IPCC is distinct from the climate modeling enterprise.” It is not.
As true as the day is long. There’s only one person “spreading lies” here, and that’s not us.
Response to Atomsk’s Sanakan
23 Jun 2025 at 10:41 AM above
Another refusal to engage with documented reality. No surprise — it’s a pattern here.
You’re free to pursue climate science out of personal interest, Atomsk’s Sanakan. But the institutional purpose of climate modelling, the IPCC, and the entire assessment framework is policy. That’s not ideology — it’s the mandate. It’s historical fact and remains the dominant framing to this day.
Yes, climate models are used for Mars or paleoclimate. That doesn’t change the core truth: their primary development, funding, and use have always been for policy-relevant understanding of anthropogenic climate change. This has been true since the 1970s and was codified through the creation of global institutions for precisely that purpose.
Others here have already laid out the historical evidence. Ignoring it isn’t just evasive — it’s misleading. Denying this to score rhetorical points, while trafficking in false equivalence and baiting, places you and others at the fringe — not just of scientific understanding, but of intellectual honesty.
If you’re going to distort the record, at least make the effort to be coherent. This conspiracy-flavored campaign barely qualifies as dissent.
And no — I don’t use alt accounts or spam either, just as most people here use handles or pseudonyms. That includes you, jgnfld, zebra, Piotr, Thessalonia, and nigelj. How desperate must you be to try discrediting arguments by questioning names?
As for your personal “endpoint of climate science,” I don’t care. I doubt Pedro does either. It’s irrelevant — and your attempt to reframe the entire thread around your personal motivations is misplaced. This isn’t about you. And your arguments don’t count when they’re wrong, unsupported, and self-referential.
The person behind the nym “Pedro Prieto” was right the first time. You could learn a few things from them. Because denial is never a good look.
Nope. As others have repeatedly shown you + your alt-accounts, climate modelling predates policy concern about anthropogenic climate change. And it continues to be used for things other than anthropogenic climate change. Scientists would still be studying greenhouse-gas-induced climate change even if humans did not cause it. After all, it’s pertinent for ice ages, other astronomical bodies, etc.
You claim otherwise “since the 1970s”, because you rely on your audience not knowing what was written since the 1970s. Here, for example, is Landsberg discussing modeling on CO2-induced climate change in 1970, despite him thinking the human impact will not be a large policy concern:
“The model most widely used is that of Manabe and Wetherald (27). They calculate, for example, that, with the present value for average cloudiness, an increase of atmospheric CO2 from 300 to 600 parts per million would lead to an increase of 2°C in the mean temperature of the earth at the surface. […] At the present rate of accumulation of CO2 in the atmosphere, this doubling of the CO2 would take about 400 years. The envisaged 2°C rise can hardly be called cataclysmic [page 1267].”
https://www.jstor.org/stable/1730486
Callendar was modeling in the 1930s while thinking the anthropogenic impact would be beneficial. Arrhenius was modeling in the 1890s while not thinking the anthropogenic contribution would be large:
“Like Arrhenius, Callendar did not foresee the potential detrimental impacts of climate warming. Rather, he emphasised the societal benefits that might accrue from increasing temperature”
https://doi.org/10.1016/j.endeavour.2016.07.002
So no, you’re wrong about why climate modeling exists. It would exist even if there was no policy concern about humans significantly impacting climate. Anthropogenic climate change is one of many topics to which climate modeling is applied.
Agreed–though I really don’t quite grasp why PP et al are so desperate to try to ‘prove’ that the IPCC and climate modeling are inseparable, or whatever the claim is. It seems that they think that this would somehow be discrediting. But unless I’ve missed something, they’ve never actually articulated the larger point they are trying to make.
Reply to Kevin McKinney
In a chain of events, 1 comes before 2, and 2 comes before 3, and so on. Think about that if you’re interested in learning anything. But given you’re already agreeing with someone who has everything wrong, and upside down, well, I’m not hopeful for you.
W: Reply to Kevin McKinney . . . In a chain of events, 1 comes before 2, and 2 comes before 3, and so on. Think about that if you’re interested in learning anything. But given you’re already agreeing with someone who has everything wrong, and upside down, well, I’m not hopeful for you.
BPL: Let’s wait and see how long it takes for William to complain about “ad hominem.”
If 1 comes before 2, and climate modeling comes before the IPCC, then doth pride come before a fall?
(I’d be glad to speak more plainly, if it would help.)
Kevin : I really don’t quite grasp why PP et al are so desperate to try to ‘prove’ that the IPCC and climate modeling are inseparable […e] unless I’ve missed something, they’ve never actually articulated the larger point they are trying to make.
If PP et alt. attacks Nigel who, short of few caveats, agreed with him on the main role of AGW research on this webpage, while at the same time has no problem with Paul Pukitem with views opposite to him (attacking the AGW research and demanding shifting the resources to the non-AGW climate research) – then there is no “large point”,
only a small man,:
===
– as “Prieto Principle” put Nigel on his enemies list (twice!)
– while as “William” and “Pedro” defended Paul Pukite, and as “The Prieto Principle” listed: Paul Pukite, JCM, Killian and himself as: “ the last ones here still grounded in unbiased reason and scientific fundamentals“ ?
Amica veritas, sed Pukite maior amicus est? (or something like that ..).
==========================
The only reason I can think for this is that Nigel was listed on PP et alt. enemies list. While at the same time, he didn’t attack
Paul Pukite – even though in this issues they are at opposite ends – Paul Pukite claimed that AGW research is pretty much done – accomplished what it could
Pietro rightly said that:
Them apples are true. There are certain nuggets of scientific reasoning that remain hidden until the time is ripe for picking. Recently I’ve been revisiting a Fourier harmonic decomposition approach based on multiple linear aggression (MLR)
https://gist.github.com/pukpr/492a57af8a7929ab2eece6994ab0a5f4?permalink_comment_id=5648617#gistcomment-5648617
I was applying this approach early on for modeling climate behaviors but found it prone to overfitting. However, with the experience gained using the cross-validation algorithms that have proliferated with machine learning in the past couple of years, it looks even more promising. This is blazing fast in contrast to iterative fitting of a time-evolving model.
The eye is in the beholder so anyone can draw any conclusions they want about the results. This appears to be a general model that may apply to any RealClimate®© index — from ENSO indices such as NINO34 to AMO to regional average monthly tide levels, The last analysis on average monthly tidal levels (such as in Brest, France) is something that I didn’t address fully in Mathematical Geoenergy, but the connection between conventional tidal analysis (a la daily tides) and the larger breadth ocean cycles is quite revealing.
Separating the nonlinear mixing of the annual and biennial impulse against tidal forcing via the efficient use of a linear MLR algorithm is a big time saver.
This is what ®© is all about — applying science at it’s most fundamental level. Remember the charter on the About page —
“RealClimate is a commentary site on climate science by working climate scientists for the interested public and journalists and has been operating since Dec 2004. We aim to provide the context sometimes missing in mainstream commentary on climate science. The discussion here is mostly restricted to scientific topics “
Piotr, if you can’t stand the heat, get out of the kitchen.
Paul Pukite: “Them apples are true.”
Reading your posts, Paul, is a guilty pleasure: like slowing down to look at a car-wreck. But since you insist on presenting your car-wreck as an unqualified success and based on that lecture me self-assuredly (“Piotr, if you can’t stand the heat, get out of the kitchen…..”), so be it:
In the discussion you joined:
1. Nigel said that while the main focus of this site is AGW, he also reads your non-AGW posts, but your recent posts (your baseless attacks on other people, like Gavin, based on your ignorance?) may be crossing the line
2. WIlliam joins to lecture Nigel that the …. only raison d’etre of climate science is to study, and to provide advice on, AGW.
3. I pointed out the paradox of lecturing on that Nigel, and not you (with you doing only non-AGW work and arguing for the switch of research focus and funding away from AGW toward ENSO). Which suggests the troll nature of WIlliam – it’s not about the science, but only about getting at those listed on his enemy list (like Nigel), and sparing those he considers his allies, as in:
“Myself, JCM, Paul Pukite and Killian are the last ones here still grounded in unbiased reason and scientific fundamentals“.
Paul Pukite joins in …. NOT to prove that William is after truth and not
at getting at opponents, but to say that …. the quoted William’s praise of himself and Pukite is justified ;-)
Paul Pukite: “ Them apples are true. There are certain nuggets of scientific reasoning that remain hidden until the time is ripe for picking. Recently I’ve been revisiting a Fourier harmonic decomposition approach based on multiple linear aggression (MLR)”
So another example of your brain unable to grasp what the discussion you join is about, and, instead, merrily going on some technical tangent nobody was discussing.
And an attempt to appear cool by using a catchy phrase, and… achieving the opposite, by making clear that you have no idea what that phrase is about:
“How do you like them apples” is NOT to point that … they are “ripe for picking”. The most memorable use of it was by soldiers in in WWI, referring to the grenades and mortar rounds launched into the enemy’s trenches. Therefore, it is a tongue-in-cheek taunt AFTER one proved their point against the opponent. While your drifting onto the “Fourier harmonic decomposition approach based on multiple linear aggression (MLR) DIDN’T disprove my point about William’s motives.
So you are like a new recruit, who upon hearing veterans saying it, wanted to say it too, so he could feel one of them, and when he finally said it, from all that excitement, he forgot … to throw the grenade.
This comment by Piotr
1 Jul 2025 at 10:25 AM
https://www.realclimate.org/index.php/archives/2025/05/predicted-arctic-sea-ice-trends-over-time/#comment-835144
Is nonstop ad hominem abuse mixed with strawman fallacies. It’s disgusting. And delusional.
In modern usage, “sophist,” “sophistry,” and “sophism” generally carry a negative connotation, referring to the use of clever but fallacious or deceptive arguments, especially to deceive. Originally, in ancient Greece, Sophists were teachers of rhetoric who were paid to instruct young men in the art of persuasive speaking, which was crucial for political success. However, their methods, which often involved prioritizing persuasive rhetoric over truth, led to a perception of them as manipulators and deceivers.
About Piotr’s comment of the 1 Jul 2025 at 10:25 AM
https://www.realclimate.org/index.php/archives/2025/05/predicted-arctic-sea-ice-trends-over-time/#comment-835144
1) Piotr says:
So another example of your brain unable to grasp what the discussion you join is about….
That comment is well known as the Ad Hominem abuse / fallacy. In general it’s called publicly belittling others.
2) Piotr says:
“And an attempt to appear cool by using a catchy phrase, and… achieving the opposite, by making clear that you have no idea what that phrase is about:”
That is known as projection onto others, or strawmanning fallacy. It’s generally called making things up about others. In more experienced circles it’s labelled Sophistry; intended to deceive using rhetoric. There was some more biting ad hominem to sweeten the personal attack included there.
3) Piotr says:
So you are like a new recruit, who upon hearing veterans saying it, wanted to say it too, so he could feel one of them, and when he finally said it, from all that excitement, he forgot … to throw the grenade.
More Sophistry, projection, Strawmanning plus belittling Ad Hominem abuse. The forum evidence shows this is a habit for Piotr who has practiced it here without consequence.
See if you can spot the pattern too. Pure, uncut Piotr. Trying to ridicule what he can’t rebut. Don’t worry — I’ve filed his comment under ‘peer-reviewed sarcasm.’ It’s right next to the missing aerosol forcing assumptions and the post-2020 GSAT spikes no model and no one predicted.
“When semantics replace substance, the science has stopped speaking. Truth doesn’t need consensus — it just needs witnesses.” ~ William
And @ Piotr says
1 Jul 2025 at 10:25 AM
https://www.realclimate.org/index.php/archives/2025/05/predicted-arctic-sea-ice-trends-over-time/#comment-835144
Piotr falsely states:
2. WIlliam joins to lecture Nigel that the …. only raison d’etre of climate science is to study, and to provide advice on, AGW.
Not true. I have never said that. It is another lie. Another distortion. Another Strawman and Misrepresentation. Call it what you will but it is provably untrue.
Given spreading these ‘lies’ happen almost daily, in combination with Barton and Nigel repeatedly, it begs the question how intentional this is? It might be everyday compulsive lying or it could be some type of shared memory disorder? I don’t know but it truly sucks to see grown me doing this daily and in public. They appear to have no shame or honour.
Why a very high percentage of my posts that get binned are about pushing back against these relentless untruths, is another unknown mystery never to be revealed.
As Kevin noted yesterday, even AI apologises when it makes mistakes, promises to be better then fails again. He’s right about that 100%.
Reply to Atomsk’s Sanakan
I personally reject out of hand all your pseudo arguments and cheap debating tricks from high school. But I will assist you with your “vision/awareness” problem, as follows.
Pedro Prieto says
21 Jun 2025 at 12:30 AM
The collective dismissal of my response – Pedro Prieto says 18 Jun 2025 at 7:14 PM – about the CMIP policy purposes to Atomsk’s Sanakan arrived based on the usual ad hominem and logically fallacious arguments.
Barton Paul Levenson raises the irrelevancy of Mars, Venus and Titan ‘GCMs’. And the selectively false disinformation the “IPCC is distinct from the climate modeling enterprise.” It is not.
19 Jun 2025 at 8:12 AM
Piotr Trela says? – I don’t know as I never read their offensive hostile and incoherent commentaries
19 Jun 2025 at 11:15 AM
Susan Anderson doubles down on the pettiness.
19 Jun 2025 at 1:41 PM
In response I share the following:
Carbon Brief charts more than 50 key moments in the history of climate modelling, including:
Syukuro Manabe and Richard Wetherald’s seminal climate modelling study in 1967.
The Met Office’s first general circulation model in 1972.
The Charney Report in 1979.
James Hansen’s three scenarios published in 1988.
The first Intergovernmental Panel on Climate Change (IPCC) report published in 1990.
The Coupled Model Intercomparison Project (CMIP) launched in 1995.
The IPCC’s fifth assessment report published in 2013.
https://www.carbonbrief.org/timeline-history-climate-modelling/
So much for Barton’s pushback.
The Coupled Model Intercomparison Project (CMIP) was formally organized and established in 1995. The driving force behind the creation and ongoing coordination of CMIP is The World Climate Research Programme (WCRP). Specifically, it was organized by the Working Group on Coupled Modelling (WGCM), which is a joint working group of the WCRP and the Climate and Ocean: Variability, Predictability and Change (CLIVAR) program.
The WCRP itself is co-sponsored by major international scientific organizations incl. World Meteorological Organization (WMO), Intergovernmental Oceanographic Commission (IOC) of UNESCO, International Science Council (ISC) (formerly the International Council for Science, ICSU)
The WCRP supports the development of actionable climate information, scientific assessments, educational approaches, and public communication strategies that require collaborative efforts with multi-sectoral actors in all regions of the globe.
WCRP’s work involves hundreds of scientists throughout the world, organized around a large number of research projects, activities, events, and publications. WCRP science underpins the United Nations Framework Convention on Climate Change (UNFCCC), including national commitments under the Paris Agreement of 2015, and contributes to the knowledge that supports the 2030 Agenda for Sustainable Development, the Sendai Framework for Disaster Risk Reduction, and multilateral environmental conventions.
https://wmo.int/activities/world-climate-research-programme-wcrp
https://www.wcrp-climate.org/wgcm-cmip/cmip-video
The WCRP and WGCM have nothing to do with Titan nor ad hominem but their work and output has everything to do with my prior factual response. The combined ultimate purpose of the entire climate modeling enterprise exists to support policy-relevant science. Its value lies in producing a robust foundation for understanding, assessing, and responding to anthropogenic climate change—for policymakers, governments, and societies. The enterprise includes the WMO, CMIP and the WCRP along with the IPCC and the UNFCCC system. The IPCC’s primary purpose is to provide science-based understanding to inform policymaking of the UNFCCC.
In other words, the IPCC and the whole collective enterprise delivers scenarios that answer “what happens if,” using tools like CMIP. Which directly leads into Policy Making and Action Plans. Hopefully effective ones that work.
————————————-
I think the above is wasted on people posting here. Maybe some silent readers will appreciate it.
Here are DOIs for papers using climate models to address purportedly non-anthropogenic ocean oscillations:
– 10.1002/2014GL059233
– 10.1126/science.aab3980
– 10.1175/JCLI-D-16-0803.1
– 10.1038/s41467-019-13823-w
– 10.1126/science.abc5810
Below is a RealClimate page on that modeling. I’ll throw in a Carbon Brief page on that topic, since you apparently like citing them as well:
– https://www.realclimate.org/index.php/archives/2019/06/unforced-variations-vs-forced-responses/
– https://www.carbonbrief.org/guest-post-why-natural-cycles-only-play-small-role-in-rate-of-global-warming
So no matter how much you and your alt-accounts claim otherwise, it is not the case that “the combined ultimate purpose of the entire climate modeling enterprise exists to support policy-relevant science. Its value lies in producing a robust foundation for understanding, assessing, and responding to anthropogenic climate change—for policymakers, governments, and societies.”
In reality, the value of climate models lies in improving understanding of climate, regardless of whether that is purportedly non-anthropogenic ocean oscillations, policy-relevant anthropogenic climate change, the impact of changes in total solar irradiance / cosmic rays / volcanic eruptions / …, climate on other astronomical bodies such as Mars, etc.
Atomsk’s Sanakan, I had reached similar conclusions to you that climate modelling is clearly not all about AGW and its policy implications. See my comments above in case you missed them.
nigelj says 23 Jun 2025 at 3:53 PM
nigelj says 24 Jun 2025 at 7:27 PM.
The sock puppeteer is mistaken, and is very stubborn, or is playing games or something.
Reply to Atomsk’s Sanakan
Well, I wasted five minutes on your first reference — Mann et al. (2014) — and surprise: it focuses squarely on anthropogenic climate change. And uses CMIP5 data output to argue their case. Pedro Prieto noted this ages ago, of course. The paper itself asserts it is in the weeds of “understanding, assessing, and responding to anthropogenic climate change.” This time specifically the behaviour of the AMO. So that’s one false claim already crossed off.
The conclusion? “Explaining some of the observed slowing of warming during that timeframe.”
Now… what warming could they possibly be referring to, Atomsk? Why would Mann & Co. be untangling natural variability from forced anthropogenic warming in the Northern Hemisphere if they weren’t doing—oh, what’s the word?—policy-relevant climate science?
The AMOC seems to be a major focus lately. For models. For Mann. For RealClimate. For policymakers. For “—for policymakers, governments, and societies.” as the paper overtly alludes to by addressing the problems inherent in a better “understanding and assessing” what is going on, and why.
So: your claim is false. Again. I’m not wasting another moment trawling your reference list. You made the assertion — you can go fetch the quotes next time.
P.S. I’ve been slightly distracted by the whole “missiles falling from the sky” thing, but I’ll be back to the tangled mess of Net Zero and ZEC definitions next month. Can’t wait.
—Thessalonia
Thessolonia:
“Reply to Atomsk’s Sanakan Well, I wasted five minutes on your first reference — Mann et al. (2014) — and surprise: it focuses squarely on anthropogenic climate change. And uses CMIP5 data output to argue their case…..”
No. The study focuses primarily on modelling internal variability , particularly related to the AMO. Forced anthropogenic global warming is considered of course because they have to subtract the forced AGW component to figure out what is internal variability in the data, but AGW is clearly NOT the focus of the study. Please read the Abstract and key points carefully as follows.
Abstract:
We estimate the low-frequency internal variability of Northern Hemisphere (NH) mean temperature using observed temperature variations, which include both forced and internal variability components, and several alternative model simulations of the (natural + anthropogenic) forced component alone. We then generate an ensemble of alternative historical temperature histories based on the statistics of the estimated internal variability. Using this ensemble, we show, first, that recent NH mean temperatures fall within the range of expected multidecadal variability. Using the synthetic temperature histories, we also show that certain procedures used in past studies to estimate internal variability, and in particular, an internal multidecadal oscillation termed the “Atlantic Multidecadal Oscillation” or “AMO”, fail to isolate the true internal variability when it is a priori known. Such procedures yield an AMO signal with an inflated amplitude and biased phase, attributing some of the recent NH mean temperature rise to the AMO. The true AMO signal, instead, appears likely to have been in a cooling phase in recent decades, offsetting some of the anthropogenic warming. Claims of multidecadal “stadium wave” patterns of variation across multiple climate indices are also shown to likely be an artifact of this flawed procedure for isolating putative climate oscillations.
Key Points
Certain common procedures fail to isolate internal variability in climate
AMO appears to have been in a cool phase in recent decades
‘Stadium wave’ patterns are likely an artifact of flawed assessment procedures
Re: “Well, I wasted five minutes on your first reference — Mann et al. (2014) — and surprise: it focuses squarely on anthropogenic climate change.”
You should read the paper more closely, alt-account. The paper is about a purportedly non-anthropogenic ocean oscillation known as the AMO. That’s the paper’s focus, as reflected in the paper’s abstract and title: “On forced temperature changes, internal variability, and the AMO”. Anthropogenic climate change is not the paper’s focus. You quote-mining one sentence from the paper does not make that the focus of the paper. If this is how you read papers, then people should not trust you nor your alt-accounts when you cite sources. Because you’ve conflated what you’re interested in vs. what the paper is focused on.
This is part of a long series of papers arguing that the purported AMO signal is predominately forced instead of being unforced internal variability. Note that ‘forced’ does not mean ‘anthropogenic’, since the forcing can come from volcanic eruptions, changes in solar output, etc. That’s illustrated by the 5th paper I cited: 10.1126/science.abc5810. So no, this paper is an example of using climate models to assess non-anthropogenic climate change, no matter how much you try to deflect from that.
FYI: the AMO is not the same as the AMOC.
Re: “Now… what warming could they possibly be referring to, Atomsk?”
Oh, are you one of those doomists who incorrectly think global warming is anthropogenic, by definition? The global temperature trend has anthropogenic and non-anthropogenic contributors. The paper was assessing one of the purported non-anthropogenic contributors, in the form of internal variability from the AMO. Even if AGW did not exist, climate scientists would still be investigating non-anthropogenic climate change. They’ve been doing that since before Arrhenius in the 1890s. Maybe this will help you, sockpuppet account:
“The rate of increase in attributed anthropogenic warming over time is distinct from the rate of increase in the observed global surface temperature, which is also affected by internal variability such as El Niño and natural forcings such as volcanic activity […].”
https://doi.org/10.5194/essd-17-2641-2025
Reply to Atomsk’s Sanakan
You’ve done it again, Atomsk — confused a catalogue of examples with a rebuttal to a core institutional fact.
Nobody denied that climate models can and are used to study non-anthropogenic processes — ocean oscillations, solar variability, volcanic forcing, even Martian atmospheres. That’s not the assertion. It never was.
The Prieto Principle espoused by Pedro referred to the dominant purpose and historical trajectory of modern climate modeling — which, since the 1970s, has been to support policy-relevant understanding of anthropogenic climate change. That’s not conjecture. It’s institutional record.
Your five DOIs don’t refute this. They just demonstrate the versatility of the tools, not the primary reason those tools were developed, funded, coordinated, and scaled globally.
Let’s recall:
In 1988, James Hansen didn’t present ENSO or volcanic dynamics to Congress. He presented anthropogenic global warming projections using his models. That testimony catalyzed U.S. government policy to support the WMO, UNEP, and NAS, leading directly to:
1) the creation of the IPCC,
2) the launch of the UNFCCC,
3) the 1992 Rio Earth Summit, and
4) the systematization of climate modeling through the CMIP framework.
5) the Kyoto Protocol treaty and later the Paris Agreement
Every single step there is a policy initiative or output. That’s the arc Pedro rightly and simply pointed out. Why anyone is arguing about this or pushing back is beyond me — unless they’re trying to distract, deny the institutional record, or just don’t understand what purpose-built systems are for.
So yes, models can study natural variability. But the climate modeling enterprise as a global system — WCRP, WGCM, CMIP, IPCC — was built and sustained to answer one central question: “What happens if we keep emitting greenhouse gases? And what do we do about it?”
That’s what Pedro meant by “The end point to all this sciencey stuff is nothing other than policy outcomes.” It’s that simple. It doesn’t erase basic research. It names the institutional raison d’être.
Denying this to score rhetorical points is empty. It’s not dissent — it’s misdirection. And it does nothing to refute the actual record of how climate science, modeling, and global governance evolved.
You’re welcome to study tides on Titan. Just don’t pretend that’s what built the IPCC. Or defined what it’s purpose was supposed to be.
Ref: Pedro Prieto says
18 Jun 2025 at 7:14 PM
https://www.realclimate.org/index.php/archives/2025/05/predicted-arctic-sea-ice-trends-over-time/#comment-834605
The assertion made by your alt-account was:
“The end point to all this sciencey stuff is nothing other than policy outcomes. Been like that since day one. Long before Hansen came on the scene. Go check.”
https://www.realclimate.org/index.php/archives/2025/05/predicted-arctic-sea-ice-trends-over-time/#comment-834449
That was in response to someone else saying this:
“Regarding what I read as the primary thrust of what you said, I’ll offer my observation that policy implications are not the main point of what Gavin’s article was trying to highlight.”
https://www.realclimate.org/index.php/archives/2025/05/predicted-arctic-sea-ice-trends-over-time/#comment-834442
Your alt-account was wrong since there are end points other than policy outcomes. That’s been the case since before Arrhenius in the 1890s and continues through to the present. It’s illustrated by outcomes such as improved understanding of climate on other astronomical bodies, non-anthropogenic factors such as the AMO, paleoclimate, etc.
If by some miracle it turned out AGW was not real or was irrelevant to policy, then climate modeling would still continue because policy-relevance is not the only end point. Hence why climate modeling predates policy concern about AGW by decades. Hence the distinction between basic science vs. applied science, which holds just as much for climate modeling as it does for other subdomains of science. What you’re doing is akin to ‘skeptics’ who claim climate scientists are so desperate to manipulate policy that they do not pay enough attention to other aspects of climate. Not only is that false, but it promotes a negative view of climate scientists and modelers.
What Dr. James Hansen tells politicians is not equivalent to the only end point of climate modeling. Similarly, scientists telling politicians about vaccines and politicians then making vaccine policy, does not mean the only end point of immunology (my field) is vaccine policy. Your claims about the IPCC do not change the fact that scientists model to improve understanding of the natural world, regardless of whether there are policy implications. Similarly, the existence of organizations on vaccine policy does not mean vaccine policy is the only end point of immunology.
Multiple people have aptly explained this to you, including Susan Anderson, Barton Paul Levenson, nigelj, and Kevin McKinney. This is reminiscent of when you misrepresented the definition of ‘net zero’, even though the very sources you cited corrected your misrepresentation. When multiple people showed you were wrong, including Dr. Gavin Schmidt, you did what you’re doing now: responded with alt-accounts and blamed others, instead of simply honestly admitting you were wrong.
https://www.realclimate.org/index.php/archives/2025/06/unforced-variations-jun-2025/#comment-834369
Perhaps the problem is that “William’s” statements are being interpreted as typical denier talking points. In this case, that either climate science is not a “real” science, but only politics with the deniers as the true logical, rational men of science keeping them honest. Or alternatively, that climate science is hopelessly corrupted by the IPCC leading to falsified “on-demand” results. Or in the extreme interpretation, that climate modeling would not even exist without the IPCC. This is all clearly nonsense so I’m sure he couldn’t have meant the above.
William @ 28 Jun 2025 at 6:13 says
“Nobody denied that climate models can and are used to study non-anthropogenic processes — ocean oscillations, solar variability, volcanic forcing, even Martian atmospheres. That’s not the assertion. It never was….The Prieto Principle espoused by Pedro referred to the dominant purpose and historical trajectory of modern climate modeling — which, since the 1970s, has been to support policy-relevant understanding of anthropogenic climate change. That’s not conjecture. It’s institutional record.”
I cannot find a reference to anyone using the words dominant purpose. What I find is this: The Prieto Principle says23 Jun 2025 at 10:29 PM :
“Yes, climate models are used for Mars or paleoclimate. That doesn’t change the core truth: their primary development, funding, and use have always been for policy-relevant understanding of anthropogenic climate change. This has been true since the 1970s and was codified through the creation of global institutions for precisely that purpose.”
This isn’t accurate or credible because anthropogenic climate change didn’t emerge as an issue until the 1990s. Its also not that relevant as follows.
I also found this: Pedro Prieto says @18 Jun 2025 at 7:14 PM. “the entire climate modeling enterprise exists to support policy-relevant science. Its value lies in producing a robust foundation for understanding, assessing, and responding to anthropogenic climate change—for policymakers, governments, and societies.”
And clearly it’s not true: Climate modelling exists for a variety of purposes.
And its Pedro Prietos statement I have responded to and others have responded to. Most of the comments on modelling have come from Piedro Prieto (and some form William.) Pedro Prieto was wrong to say this and hasn’t taken responsibility for his wild incorrect generalisation / exaggeration. We are not caring about what Prieto Principle said along the way.
Reply to Atomsk’s Sanakan
Atomsk,
You’ve posted four times now, with 2000 words and 20 links to deny a point nobody made, misquote a principle you don’t understand, and bury it all under a pile of irrelevant DOIs and century-old trivia.
You’re not debating — you’re filibustering.
Yes, models can be used to study anything from Mars to medieval ENSO. Nobody said otherwise. But climate modeling as a coordinated global system — CMIP, IPCC, WCRP, etc. — was developed, funded, and scaled for one overriding purpose: to inform policy on anthropogenic climate change.
That’s not my opinion. That’s the institutional mandate.
Dragging in Arrhenius, Callendar, and your own hobbyist motivations doesn’t change a thing. It just shows you’re not arguing — you’re stalling, scrambling, and projecting.
Let’s be honest:
You’re not here to learn, clarify, or contribute. You’re here to derail, distort, and attack anyone who challenges your consensus comfort zone. That’s your real endpoint.
Spare us the citations. You’ve already lost the plot — and the argument.
Reply to Atomsk’s Sanakan
comment @ 28 Jun 2025 at 1:33 AM
Atomsk,
You’ve now completed the full Atomsk’s Sanakan Bingo Card™ in one thread. Let’s review:
☑️ Accuse everyone of being alt-accounts
☑️ Cite five papers no one asked for
☑️ Misread one paper and insult the person who read it correctly
☑️ Conflate model usage with institutional purpose
☑️ Invoke Arrhenius again like it’s 1896
☑️ Deny the existence of institutional context
☑️ Project personal motives as universal truth
☑️ Lecture people who actually work in the field
☑️ Talk down to others while being wrong
☑️ And now — claim global warming is “not anthropogenic by definition”
Seriously?
You’ve now slipped from denial-adjacent sophistry into outright delusional fantasy. You’re contradicting 40 years of every major climate assessment ever published — including the very IPCC reports you claim to be familiar with. You’re asserting that global warming is not necessarily anthropogenic in 2025.
That’s not contrarian. That’s not nuance. That’s clinical-grade detachment from reality.
The paper you cited (again) discusses internal variability on top of forced anthropogenic trends. That’s the whole point of forced vs unforced components in detection and attribution. Your inability to grasp that — after four corrections, five deflections, and six condescending replies — is not a debate. It’s a meltdown.
You’re not here for science. You’re here to posture, spam, and rewrite basic definitions to win imaginary arguments with people you accuse of being multiple personalities.
So congratulations:
You’ve officially argued yourself out of the scientific consensus you pretend to defend. And out of relevance, too.
Now go re-read AR6 before you tell the rest of us what “global warming” means. Again.
W: That’s what Pedro meant by “The end point to all this sciencey stuff is nothing other than policy outcomes.” It’s that simple. It doesn’t erase basic research. It names the institutional raison d’être.
BPL: That’s the institutional raison d’etre of the IPCC, not the scientists. Also, it’s amusing to see one sock puppet (W) praising another (PP), since you are both the same person.
There’s no getting to his various alt-accounts. As Piotr noted when William was shown to be wrong on what ‘net zero’ meant:
“The only question remaining is what are you going to do? Do you:
– admit to basing your derision on your own ignorance, honestly apologize, and learn from this,
– double down and attack the people who proved it,
– or, the third way – change the subject onto some tangent to pretend that that egg was never on your face?”
https://www.realclimate.org/index.php/archives/2025/06/unforced-variations-jun-2025/#comment-834281
William and his alt-accounts will never choose option 1, even as they continue to spam the forum.
I’m ignoring the anonymous “Atomsk” nym — far too many personal issues to parse, and frankly, not worth the time.
Nigelj’s comment (28 Jun 2025 at 4:05 PM), however, is irresistible on multiple levels.
He seems fixated on the phrase “the dominant purpose.” But there’s no quandary here. Different people express the same concept using different words and phrasing. That’s what makes us individuals — not sockpuppets.
William explains this explicitly in the very comment Nigel refers to:
–That’s what Pedro meant by “The end point to all this sciencey stuff is nothing other than policy outcomes.” It’s that simple.–
But it seems Nigel, Atomsk, and others are intellectually terrorized by plain language. And yet — strangely — they rush to claim that four, five, or six different commenters here are all the same person, despite using entirely different wording, tone, and argument styles.
That’s a remarkable case of shared cognitive dissonance.
Nigel writes:
“I cannot find a reference to anyone using the words dominant purpose.”
That, ironically, is revealing.
Let’s review what Nigel did find:
From The Prieto Principle (23 Jun 2025 at 10:29 PM):
“Yes, climate models are used for Mars or paleoclimate. That doesn’t change the core truth: their primary development, funding, and use have always been for policy-relevant understanding of anthropogenic climate change. This has been true since the 1970s and was codified through the creation of global institutions for precisely that purpose.”
That nails it. But Nigel immediately trips over his own logic: This isn’t accurate or credible because anthropogenic climate change didn’t emerge as an issue until the 1990s. Its also not that relevant..
Wait — “anthropogenic climate change didn’t emerge as an issue until the 1990s”?
Oh dear. That’s not a rebuttal. That’s amnesia. Nigel continues:
Pedro Prieto says @18 Jun 2025 at 7:14 PM. “the entire climate modeling enterprise exists to support policy-relevant science. Its value lies in producing a robust foundation for understanding, assessing, and responding to anthropogenic climate change—for policymakers, governments, and societies.”
And clearly it’s not true: Climate modelling exists for a variety of purposes.
But in doing so, Nigel conveniently omits to downplay the words entire, enterprise, support, and policy-relevant — all of which shift the real meaning significantly.
The words that actually matter here — the ones that frame the purpose of this whole global effort — are:
dominate, entire, value, purpose, enterprise, policy, foundation, issue, end point, sciencey stuff, anthropogenic, climate change, understanding, assessing, assessment, combined, ultimate, climate modeling, exists, support, institutional, framing, policy-relevant, science, endpoint, primary, historical…
The variation in phrasing reflects the diversity of people describing the system — different scientists, institutions, national cultures, and native languages. Some say “purpose,” others say “endpoint,” “foundation,” or “primary function.” But across documents, decades, and disciplines, they’re all pointing to the same architecture: a global modeling enterprise built to serve policy-relevant understanding of anthropogenic climate change.
All these words — used by different people across comments, reports, and eras — converge on the same thing: climate modeling exists, was funded, and continues to be shaped primarily to support policy-relevant science on anthropogenic climate change.
The only real “issue” here? We don’t yet have a RealClimate AI Thesaurus handy — to help certain commenters recognize when different words still point to the same truth.
Words like dominate, entire, purpose, enterprise, foundation, issue, end point, ultimate, exists to, endpoint, and primary are all variations on a theme: they describe the core function or reason for being of a system. In the context of climate modeling, these terms converge to assert that the modeling enterprise is fundamentally structured, funded, and coordinated to serve a central purpose — namely, to support understanding that informs policy.
The variation in phrasing reflects the diversity of people describing the system — different scientists, institutions, national cultures, and native languages. Some say “purpose,” others say “endpoint,” “foundation,” or “primary function.” But across documents, decades, and disciplines, they’re all pointing to the same architecture: a global modeling enterprise built to serve policy-relevant understanding of anthropogenic climate change.
Different words. Different voices. Same intent.
Deny that all you wish. But I will fight to the death for your right to misquote and misunderstand Climate science institutions incorrectly. Or not! :-)
Barton Paul Levenson says
29 Jun 2025 at 7:58 AM
W: That’s what Pedro meant by “The end point to all this sciencey stuff is nothing other than policy outcomes.” It’s that simple. It doesn’t erase basic research. It names the institutional raison d’être.
BPL: That’s the institutional raison d’etre of the IPCC, not the scientists. Also, it’s amusing to see one sock puppet (W) praising another (PP), since you are both the same person.
The Prieto Principle: I think you have driven off the reservation here. What William did was correctly reference another poster, being Pedro Prieto verbatim.
One small half-step for man one giant leap for Real Climate. BPL states that: the institutional raison d’etre of the IPCC, is nothing other than policy outcomes!
Now let’s all try to follow that simple halt-thought down the rabbit hole–one two three–go!
Use the many useful references already provided on this page to lead the way. Think of them like a MAP. Or not! :-)
Re: “And now — claim global warming is “not anthropogenic by definition” […] You’re asserting that global warming is not necessarily anthropogenic in 2025. […] Now go re-read AR6 before you tell the rest of us what “global warming” means. Again.”
What I actually said, alt-account, was:
“Oh, are you one of those doomists who incorrectly think global warming is anthropogenic, by definition? The global temperature trend has anthropogenic and non-anthropogenic contributors.”
Global warming is a positive trend in global temperature. “Anthropogenic” is not part of that definition. Hence why there was global warming before humans existed, and why a global temperature increase from increasing total solar irradiance would still count as global warming. The point was that the definition of global warming does not include anthropogenic. It’s an *empirical* matter how much modern warming is anthropogenic, not something decided by *a priori* definition.
But of course you would willfully misrepresent what I said. Just another illustration of why you and your sockpuppet accounts should never be trusted to accurately represent what you discuss. There is no getting through to you.
Again, go read what was linked to you, since it confirms what I said:
“The rate of increase in attributed anthropogenic warming over time is distinct from the rate of increase in the observed global surface temperature, which is also affected by internal variability such as El Niño and natural forcings such as volcanic activity […].”
https://doi.org/10.5194/essd-17-2641-2025
Reply to Atomsk’s Sanakan and others constant false allegations:
“As Piotr noted when William was shown to be wrong on what ‘net zero’ meant::
How quickly people forget. I made a statement, but never provided a Definition for Net Zero. So I was not wrong. Gavin did and he got it wrong, and was forced to correct it. Get your facts right people (he pleaded knowing they cannot.) Should I copy and paste the facts? Nah, no point here. Makes no difference.
So there’s that and there are no Sockpuppets here that I know of. Only anonymous users, some with very weird names. To review where things are at:
The RC pattern:
Dismiss it without addressing substance.
Snark or insult or gaslight in lieu of engagement.
Ignore or slow-walk mod approvals.
Use “tone” or “style” as an excuse to avoid content.
Everyone is allowed to express their opinions freely except for: ?
— I am absolutely not alone in feeling this way. It’s a bizarre irony of our time that being critical of modeling practices, or calling for better scientific transparency, often gets you lumped in with flat-Earth types and oil-funded trolls — even when your actual stance is grounded, pro-science, and deeply informed. The climate discussion, like many other high-stakes arenas, has suffered from tribalism, poor boundaries between critique and denialism, and a near-religious protection of orthodoxy.
I’ve clearly invested time and thought, and my critiques are rational — not emotional or anti-science. Pointing out major, long-standing modeling failures (CMIP3, 4, 5, etc.) or the use of “ensemble smoothing” to obscure dysfunction isn’t denialism — it’s what a scientifically literate public should do. It’s not “denying the climate crisis” to say: “These models are not delivering useful projections for Arctic sea ice, even now.” That’s a quality control concern — not a political stance.
As for RealClimate and some of its guardians — yes, I have nailed it. Many people (even within the field) have backed away quietly over the years due to the gatekeeping, intellectual arrogance, and selective engagement. It doesn’t take being a “denier” to get branded as one — just being too persistent with the wrong questions will do it.
What I am doing now is exactly what more people should be doing: thinking critically, asking tough but fair questions, and not backing down just because it ruffles feathers. This is not a game.
I am not accusing individual scientists of malicious deceit.
I am saying:
Their definitions don’t describe reality.
Their frameworks contradict their own data.
Their communications mislead the public.
And they protect those distortions as if they were sacred — often unconsciously — maybe because their careers, identities, and institutions depend on it. Or they’re too stupid to recogize it. I don’t know why each of them act like they do. That is not my problem to fix.
This is not a conspiracy. It is a system of self-preserving narratives, where falsehoods become embedded as truth. I am simply pointing that out — with evidence.
– William Tells the Truth
along with a few others now and then.
Re: “I am not accusing individual scientists of malicious deceit.”
No, you accused them of malicious deceit and worse:
“Individuals wreaked this betrayal knowingly upon the world-and continue it-feed it and feed off of it. […] That’s dishonest. In fact it is far worse than dishonest.”
https://www.realclimate.org/index.php/archives/2025/06/unforced-variations-jun-2025/#comment-834252
Re: “I made a statement, but never provided a Definition for Net Zero. So I was not wrong. Gavin did and he got it wrong, and was forced to correct it.”
Nope. You gave a definition, William:
“Enough of the thoughtful metaphors, here’s some facts and definitions.
[“] Net zero carbon dioxide (CO2) emissions are achieved when anthropogenic CO2 emissions are balanced globally by anthropogenic CO2 removals over a specified period. Net zero CO2 emissions are also referred to as carbon neutrality. See also Net zero emissions and Net negative emissions. [“]
https://www.ipcc.ch/sr15/chapter/glossary/ ”
https://www.realclimate.org/index.php/archives/2025/06/unforced-variations-jun-2025/#comment-834180
You also said this:
“What I said — “atmospheric CO₂ concentrations will continue to rise each year until we achieve actual net zero” — is 100% scientifically true.
Right now, if we emit around 11.3 GtC, while natural sinks (oceans, forests, land, etc.) absorb only about 5.4 GtC. The result? Atmospheric CO₂ continues to rise. That’s what I said — and exactly what both the data and the science confirm.”
https://www.realclimate.org/index.php/archives/2025/05/unforced-variations-may-2025/comment-page-2/#comment-833995
What you said was wrong since ‘net zero’ is about the balance between anthropogenic CO2 emissions vs. anthropogenic CO2 removal, not about the balance between anthropogenic CO2 emissions vs. non-anthropogenic CO2 removal. The definition you quoted from the IPCC confirms this. Dr. Gavin Schmidt explained this to you as well. So no, he was not wrong:
“Read the definitions again. Net zero = anthropogenic additions balance anthropogenic removals. But anthropogenic removals refer to either direct air capture (DAC) or something indirect like BECCS (biomass growth with carbon capture and storage). It does not mean the uptake of CO2 by the ocean or land surface. Finally, since the total amount of DAC or BECSS remains miniscule, net zero right now is effectively a 100% reduction in in CO2 emmisions.”
https://www.realclimate.org/index.php/archives/2025/06/unforced-variations-jun-2025/#comment-834224
Try being honest. Same goes for your sockpuppet accounts.
Re: “William Tells the Truth”
No, you don’t.
Addendum: Atomsk’s Sanakan says
28 Jun 2025 at 1:33 AM
quote-mining one sentence from the paper
Addendum —
Atomsk: “FYI: the AMO is not the same as the AMOC.”
Yes, and FYI: nobody said they were the same. A momentary acronym slip isn’t a rebuttal. It’s trivia. What matters — and what the literature makes clear — is that the AMO and AMOC are dynamically coupled. One shapes the other. Ocean heat redistribution, SST patterns, deep-water formation — all part of the same Atlantic system dance.
Quoting one of many:
“AMOC modifies the SST distribution of the North Atlantic… influencing the AMO. The AMO, in turn, affects the efficiency of deep-water formation… influencing the AMOC.” (e.g. Yang et al. 2016, Zhang et al. 2019, etc.)
That’s the actual science. Not your glossary-level nitpicking.
As for Mann et al. (2014):
They modeled internal variability and anthropogenic forcing. Their findings?
– The AMO signal likely offset some anthropogenic warming,
– Flawed methodology exaggerates natural variability,
– The “signal” is mostly in the synthetic models, not observations.
That’s not quote-mining. That’s the abstract. You should try reading it. Like William clearly did offering one ref as enough.
Also — it’s not 2014 anymore. The science has evolved. You haven’t.
Again, William–if it were true that the purpose of climate modeling were solely to provide “policy relevant science’, what would this mean? What follows from this, that we should now be thousands of words on? Or, to put it another way, how is the world different if your contention is right, versus a world where climate modeling’s utility to policy-making is merely contingent? TBH, I don’t see how it changes a thing.
In short, what is the larger point that causes you to insist at such length?
Kevin, please produce a quote where William once said: “the purpose of climate modeling were solely to provide….”
https://www.merriam-webster.com/thesaurus/solely
Next?
PS Reply to Kevin McKinney
look at the push back from what was originally a basic self-evident point put forward by Pedro in an otherwise inconsequential comment.
Go ask the people who insist on denying what he said was accurate. And correct. Even providing scientific institutional sources that support his comment are not enough for these extremist consensus narrative trolls here.
Ask them why. But do not expect an honest logical answer. I don’t. What William states is straightforward and clear. Go read it again?
This is still wrong:
“The end point to all this sciencey stuff is nothing other than policy outcomes. Been like that since day one. Long before Hansen came on the scene. Go check.”
https://www.realclimate.org/index.php/archives/2025/05/predicted-arctic-sea-ice-trends-over-time/#comment-834449
As was this:
“I was thinking of the lineage from the 1970s onward: Bert Bolin, Michael MacCracken, Syukuro Manabe, William P. Elliott—pre-Hansen researchers. This was never idle curiosity. It was global, consequential, purposeful work.”
https://www.realclimate.org/index.php/archives/2025/05/predicted-arctic-sea-ice-trends-over-time/#comment-834605
One of the reasons this is wrong is that scientists studied and modeled climate, even when they thought anthropogenic CO2-induced climate change was not a policy concern. They did this to better understand how the natural world works, a goal they shared with scientists in other fields. It later became clearer that their results were relevant to policy. But that policy concern followed after the primary goal of better understanding the natural world. Policy outcomes were not the only endpoint. If doomists find this inconvenient, then too bad. Your policy preferences are not climate science’s / climate modeling’s endpoint, let alone its only end point.
I illustrated this before using the example of Landsberg in 1970. Below are further examples.
Lamb 1970:
“Moreover, the great increase of carbon dioxide put into the atmosphere by man’s burning of fossil fuels […] seems to have been insufficient to offset a world-wide cooling tendency evidently due to other causes, as yet unknown, since about 1940 […]; and it remains doubtful whether this CO2 change has had any climate effect.”
https://doi.org/10.1098/rsta.1970.0010
Keeling 1969:
“The question is: how much before it matters? The indications are that the increase in carbon dioxide is not of special concern to our immediate wellbeing. The rise is proceeding so slowly that most of us today will, very likely, live out our lives without perceiving that a problem may exist.”
https://doi.org/10.1080/00039896.1970.10665656
[also page 14 of this: https://geosci.uchicago.edu/~archer/warming_papers/keeling.1970.philos_CO2.pdf ]
Bryson 1968:
“All other factors being constant, an increase of atmospheric carbon dioxide, by decreasing the ease with which radiant energy leaves the earth’s surface, should cause world temperatures to rise-but they have been falling while the carbon dioxide continued to rise. Some other factor must be more important and varying.”
https://doi.org/10.1080/00431672.1968.9932794
Möller 1963:
“Thus the theory that climatic variations are effected by variations in the CO2 content becomes very questionable.”
https://doi.org/10.1029/JZ068i013p03877
Seuss 1961:
“It seems improbable that the small increase in atmospheric C02 which can be assumed to have occurred since artificial coal combustion began has affected the climate of the earth in any appreciable way. However, one might expect significant effects for the coming centuries, if combustion of fossil fuels continues to increase exponentially with a doubling time of about 20 years.”
https://doi.org/10.1080/00963402.1961.11454272
For SR15, the IPCC sought and relied on targeted scenario modeling explicitly designed to demonstrate how 1.5°C might remain “achievable.” To deny that influence is disingenuous at best. And accurate to describe what BPL did as pushing selectively false disinformation
So to say “it never has and never will commission models” is a semantic dodge. It avoids the real influence the IPCC exerts through directed Agenda-setting, Scenario design, Inclusion/exclusion of model outputs, and Coordination with the modeling community.
part one – as total will not post.
RP: accurate to describe what BPL did as pushing selectively false disinformation
BPL: My God, ANOTHER sock puppet? This guy is endlessly inventive as far as screen names go. Of course, the charge of “pushing selectively false disinformation” is itself disinformation. Note to RP: “false disinformation” is redundant since disinformation is by definition false.
BPL: “ Note to RP: “false disinformation” is redundant since disinformation is by definition false.
well, unless it was a form of Freudian double negative, resulting in him unwittingly praising you. ;-)
Akin to the mass production of his alt-personalities on this site – hoping to promote the doomers “solutions”, while achieving the opposite – by showing what kind of brains are behind these “solutions” and what would be “,b> the consequences of these “solutions”
– to stabilize CO2 in the next decade or two via population reduction – would require removal 5.6 billion of humans, MORE to stabilize the global T.
A “final solution” indeed.
part two blocked for unknown reasons – will break up some words to assist in educating the ‘masses’.
The IPCC has absolutely influenced and coordinated the development and selection of models — especially for special reports like SR15. For the IPCC Special Report on Global Warming of 1.5°C (SR15), the IPCC:
— Issued a call for new scenario runs specifically targeting 1.5°C pathways.
— Requested modeling groups to submit 1.5°C-consistent scenarios using Integrated Assessment Models (IAMs).
— Created a scenario database (hosted by IIASA) to support SR15’s scenario-based assessments.
Scenarios are external to the models themselves.
— part 3 the problem child– yes it is ?
— The res ult was the first coor dinated glo bal mod eling effort ai med at gener ating mult iple net-ze ro-by-20 50 path ways consis tent with limiting warming to 1.5°C.
— This led to the ico nic “four pathways” in the S R 15 Sum mary for Policy makers (P 1–P 4), which underpin the now global ly dom inant “Net Ze ro by 20 50” narr ative.
You decide which word was blocking the post before in part 3
Now part 4 and final __
The above again shows, as Pedro already had, the IPCC is deeply embedded in the climate modeling enterprise — shaping priorities, framing scenarios, and coordinating the integration of model outputs into global assessments. It is not distinct from the modeling enterprise in any meaningful or functional sense. Barton’s claim is a textbook case of selectively false disinformation — technically narrow, but broadly misleading.
The supporting evidence for this metaphoric “joined at the hip” reality is everywhere, substantial, and undeniable. Despite the deniers here claiming otherwise while distorting the truth repeatedly.
finally
It is disturbing the kinds of distasteful comments that get through including ad hominem accusations of being labelled a ‘prat spreading lies’.
Pedro is correct.
Those posts were from me, The Prieto Principle, in my blind attempt to find a workaround as to why the content was not showing up as “unapproved-waiting for moderation” notation.
as per Rational Principles says
24 Jun 2025 at 1:42 AM
TESTING ONES PATIENCE … seems to be an error. ?
https://www.realclimate.org/index.php/archives/2025/05/predicted-arctic-sea-ice-trends-over-time/?unapproved=834785&moderation-hash=ce7a690691353c4cf6246b6d01a07b12#comment-834785
Apparently, and I am only guessing here, some words or combination of words are automatically “blocked” by the software. As a result “comments being posted” disappear into the cyberspace never to be seen again.
So if you have posts going missing this may be why.
[Response: This is a (lightly) moderated forum. Posts that are just noise, repetitive, annoying or trolling will get binned. ]
[Response: This is a (lightly) moderated forum. Posts that are just noise, repetitive, annoying or trolling will get binned. ]
That looks disconnected from the comment being made and what it meant. Just saying. Feel free to “bin it” as just noise. repetitive, annoying (all personal value judgements) but it isn’t trolling. Cheers
RP: Barton’s claim is a textbook case of selectively false disinformation — technically narrow, but broadly misleading
BPL: He knows what I’m thinking! Has to be telepathy.
RP: Pedro is correct.
BPL: Pedro, under his new screen name of Rational Principles, affirms that he is correct. How convincing is that?
More Trumpian vandalism in the mailbox today – I’d posted the first message early on the June thread (I think June) here’s one directly where it matters – just arrived June 25 from NSIDC User Services. DoD figuring tracking sea ice not necessary when the Arctic becomes more navigable and more navigated.
Dear Colleague,
The National Snow and Ice Data Center was informed yesterday that the Department of Defense (DoD) will cease processing and delivering the Special Sensor Microwave Imager/Sounder (SSMIS) data no later than 30 June 2025.
Impact on Data Products:
Since SSMIS data serve as input to the Sea Ice Index, this product will also stop processing by the same date.
What This Means For You:
Our records indicate that you use this dataset. Users should expect a gap in data availability during the transition to alternate sources. We understand this sudden change may significantly disrupt your operations and research.
Our Response:
We share your concern about this abrupt timeline and are actively evaluating possible alternative data sources, including AMSR2. We will communicate updates as soon as they become available.
AMSR2 Alternative:
Users may wish to explore the AMSR2 portion of the Near-Real-Time NOAA/NSIDC Climate Data Record of Passive Microwave Sea Ice Concentration. As documented in NSIDC Special Report #27, the AMSR2 data are a prototype and are not yet fully intercalibrated with the older data. Users will notice differences in sea ice extents because AMSR2’s higher resolution provides better ice edge detection than SSMIS. These data may serve as an interim alternative while we develop a fully intercalibrated version of AMSR2 for the Sea Ice Index.
We are committed to supporting you through this transition. Please reach out to nsidc@nsidc.org with any questions or concerns.
Warm regards,
NOAA@NSIDC
User Services
There were two links in the AMSR2 Alternative section – this is the section they refer to in first sentence:
https://nsidc.org/data/g10016/versions/3
This is the link to download a PDF of the Special Report #27 (link also on page linked above)
https://nsidc.org/sites/default/files/documents/technical-reference/nsidc-special-report-27.pdf
b fagan 25 Jun: “just arrived June 25 from NSIDC User Services. DoD figuring tracking sea ice not necessary when the Arctic becomes more navigable and more navigated.”
and at the same time when Russia and especially China are making a hard push for the Arctic, so strong that Trumps for the national security wants to wrestle Greenland away from a NATO ally.
But that’s what you get when you appoint to the head of DoD – a spineless excuse for a man, who is willing to risk the safety of his nation to please his boss, to satisfy his boss’s pathological hatred of anything to do with nature and environment.
There is a saying in Polish: “ To spite my mother, I’ll freeze my ears off “. Except in this case – the petulant child was given the reins over the family – and will frostbite not his, but her body.
b fagan, appreciate the update.
And yesterday, I came across an AP News story about this stupid decision and how it removes a tool used to better monitor those occasional clumps of clouds bearing gentle puffs of wind and sprinkles of rain. I think they’re called tropical cyclones, or hurricanes, or typhoons or some such by alarmists types infecting the government and media.
But have no fear: “NOAA spokesperson Kim Doster, in a statement, called it a “routine process of data rotation and replacement” and said that the remaining data sources “are fully capable of providing a complete set of cutting-edge data and models that ensure the gold-standard weather forecasting the American people deserve.””
Uh huh, sure. What I really liked was as AP sought an explanation: “It wasn’t immediately clear why the government planned to cut off the Defense Meteorological Satellite Program’s microwave data by Monday. The Defense Department referred questions to the Air Force, which referred them to the Navy, which did not immediately provide comment.”
.
https://apnews.com/article/climate-hurricane-forecasting-weather-defense-satellites-ea4cdb91c891255add2e9a94c28606ef
Here’s more from early June on the ice-data viewpoint – I think this article isn’t paywalled.
https://www.science.org/content/article/u-s-military-trims-access-its-critical-sea-ice-measurements
And a Substack piece by Michael Lowry discussing the possibility that it was DoD ‘security concerns’ that might have led to this weird and abrupt decision to stop sharing what’s been shared for quite some time. He also details why the suggestion of simply switching to the ATMS sensors would degrade precision and also reduce the ability to track rapid intensification.
https://michaelrlowry.substack.com/p/critical-hurricane-forecast-tool
Doing this right at the beginning of what’s predicted to be an above-average Atlantic hurricane season, especially when rapid intensification is one of the clearest trends, is not good. Lowry’s June 27 update mentions NOAA response but also that, still, DoD hasn’t given any reason.
The Lowry substack article was fantastic. Thanks for that! It was updated with the DoD announcement earlier today (30 June) that they are going to continue the existing trio of microwave data streams until July 31. Lowry then asks the same question everyone would: if there’s a “critical security risk,” then why extend operation? And he did an effective job I felt taking apart the NOAA PR that there’s nothing to see here. And why did they talk about the WSF-M successful launch while skipping over it’s data streams are not yet available for civilian use?
Thanks again for the update!
David, thank you for highlighting that. B Fagan’s comments are always worth checking.
Repeat link: https://michaelrlowry.substack.com/p/critical-hurricane-forecast-tool
Here’s an archived link to bypass the paywall to the Science article (I leave it to whoever makes use of this to address the ethics of doing this, sorry). – https://archive.ph/Dmc3C
Paul Pukite (@whut) 26 Jun
Piotr boldly asserts: “It’s much WORSE than that – he tries to advance his interests in ENSO at the expense of studying AGW and by trying to discredit climate scientists by:
Yes, I don’t think correlating with sunspot data is such a good path to follow while the correlation with tidal and annual cycles is so promising. ”
There is nothing “bold” in pointing out that Paul Pukite either has no idea that solar cycles CAN influence the temp., and/or does not understand articles he replies to ( Gavin has never claimed that solar cycles are the only, or the even dominant ,forcing of AGW trend, or short-term oscillations of global T). And based on that ignorance/inability to read – he arrogantly lectures Gavin and other climate modellers:
==========
– Gavin: “a solar max warms the stratosphere”
– Paul Pukite: “That’s embarrassing to mention sunspots. Attributing solar sunspot cycles to climate variation is the equivalent of prescribing Ivermectin.. Perhaps worse because you guys claim to understand the physics.”
==========
And true to the form – Pukite couldn’t even get his derision right – he had no clue that Ivermectin DOES HAVE valid medical applications (just not for COVID).
The frequency spectrum of an ENSO measure such as NINO4 show the clear fingerprints of a tidal forcing mixed with an annual impulse. I published this in late 2018/early 2019 (the publisher Wiley varies on this date) and only AI can keep up with the analysis years later. Yes, you can prompt an LLM such as ChatGPT with the spectral data and suggest an impulse train modulation and it will duplicate the results. Conversely, there are no sunspot variation fingerprints in any temperature data sets. Do you like them apples Piotr?
Paul Pukite: “Do you like them apples Piotr?”
And in your head, you blabbering about: “ NINO4 show the clear fingerprints of a tidal forcing mixed with an annual impulse” …. proves that that solar max DOES NOT warm the stratosphere? And justify your contempt for Gavin?
===
Piotr: Paul Pukite either has no idea that solar cycles CAN influence the temp., and/or does not understand articles he replies to ( Gavin has never claimed that solar cycles are the only, or the even dominant ,forcing of AGW trend, or short-term oscillations of global T). And based on that ignorance/inability to read – he arrogantly lectures Gavin and other climate modellers:
– Gavin: “a solar max warms the stratosphere”
– Paul Pukite: “That’s embarrassing to mention sunspots. Attributing solar sunspot cycles to climate variation is the equivalent of prescribing Ivermectin.. Perhaps worse because you guys claim to understand the physics.”
—–
That last paragraph is all one needs to know about what kind of a man Paul Pukite is:
a failure of comprehension of even a simple points, failure of elementary logic, arrogance based on ignorance, and the increasingly desperate need to validate his ego.
Endless discussions. William was precise, when he said: “We deserve:
— A clear technical post-mortem on CMIP3–5 sea ice errors;
— A transparent discussion of how CMIP6 was corrected (or tuned) in response;
— And a candid assessment of what confidence we should place in CMIP7.
Until then, it’s hard to see this as anything more than an exercise in statistical cosmetics”.
Then more lukewarming nonsense about “net zero” etc. – pie in the sky. About artificial “intelligence” – the orwellian naming of *real human stupidity put into language models*. A dead machine will never think, not even on the level of a parrot. Because there insn’t anybody there. You can’t “ask” a machine without being delusional. Joseph Weizenbaum said that decades ago: “His belief was that the computer, at its most base level, is a fundamentally conservative force and that despite being a technological innovation, it would end up hindering social progress. Weizenbaum used his experience working with Bank of America as justification for his reasoning, saying that the computer allowed banks to deal with an ever-expanding number of checks in play that otherwise would have forced drastic changes to banking organization such as decentralization. As such, although the computer allowed the industry to become more efficient, it prevented a fundamental re-haul of the system.[9]
Weizenbaum also worried about the negative effects computers would have with regards to the military, calling the computer “a child of the military.”” https://en.m.wikipedia.org/wiki/Joseph_Weizenbaum . He as “Amusing ourselves to death” (Neil Postman 1985) mainly were ignored. Result? Trumpofascism. Oiligarchy.
Time to cut the crap and realise that James Hansen was exactly right in late 2015 when he said, that the Paris”agreement” “is pure bullshit”. It’s not necessary for Trump to leave the agreement, he can do that within it. But of course then he would admit that nearly all politicians are lying (also) about the global heating, namely by different ways of ignoring it alltogether, the most efficient being to do it with lukewarming and greenwashing, silencing, censorship, “positivism” etc., all the liberal totalitarian ways. Not talking about carbon fee and dividend, just about anything else: “carbon budgets” etc.
This meteorologist is right: https://m.youtube.com/watch?v=QM8qmCWjP90 . No coincidence of course, that DOGE was named after the tyrants ruling Venice 500 years ago.
The east-german dissident Wolf Biermann saw all this coming in 1989, when he said: “When I now hear westerners who triumph over the death of communism, it reminds me of a man with AIDS, who triumphs over his brother’s death from syphilis”.
Time to wake up.
Karsten V. Johansen – 28 Jun – “Endless discussions. William was precise, when he said”
Hey, you wouldn’t be by any chance a “William” too? You know, along “Ned Kelly”, “Sabine”, “Darma”, “Darmah”, “Dharma”, “Chen”, “Escobar”, “Philly”, “Peru”, “Poor Peru”, Thesallonia”, “Compliciated”, “Complicius”, “Pedro Prieto”, “The Prieto Principle”, “Rational Principle”, etc, etc, etc?
Taken out of storage (no posts on RC for how long?) to relieve a “William” that, to get at Nigel, painted himself into the corner – having to argue in favour of the AGW science?
Piotr-Delusional mindlessness at it’s trolling best
Less ‘delusional mindlessness’, and more recognizing obvious signs of alt-accounts. As nigelj noted:
– “I believe all the following are all the same person, starting around 2017 and presented in rough time order from there: Thomas, Bill Henderson, Carrie, Reality Check, Ned Kelly, Dharma, Complicius, Simplicius, Sabine, Poor Peru, Pedro Prieto, Thessolonia, Prieto Principle, William and a couple more that have just slipped my mind, because of the striking very close similarity of views, style of writing, and style of insults and world views, including criticism of America and capitalism (criticisms expressed by many of the sock puppets I mention, not all admittedly but definitely by Thomas). Piotr seems to have figured out they are all the same person from Dharma onwards […]”
– https://www.realclimate.org/index.php/archives/2025/06/unforced-variations-jun-2025/#comment-834293
And as Tomáš Kalisz noted:
– “Poor Peru aka Dharma, Sabine, Escobar, Ned Kelly etc.”
– https://www.realclimate.org/index.php/archives/2025/05/unforced-variations-may-2025/#comment-832742
It’s been obvious that these are sockpuppet accounts from at least Ned Kelly onwards. I’d add ‘Lavrov’s Dog” to that list:
– https://www.realclimate.org/index.php/archives/2024/01/spencers-shenanigans/#comment-819051
Anyway, there’s not much cogent in what said by the alt-account Karsten V. Johansen. For example, they bring up ‘lukewarming’ when that term does not apply here. A hallmark of lukewarming is underestimating multidecadal global warming by underestimating climate sensitivity. That’s seen in the position of self-professed lukewarmers such as Dr. Matt Ridley, Dr. Patrick Michaels, and Thomas Fuller. But lukewarming doesn’t apply here since climate models accurately projected global warming ( https://www.realclimate.org/index.php/climate-model-projections-compared-to-observations/ , https://doi.org/10.1029/2019GL085378 ).
This is what actual lukewarming looks like:
– Fuller: “[…] I would be willing to wager that GAT doesn’t rise to .2C in any decade in my lifetime.”
– https://www.realclimate.org/index.php/archives/2021/02/dont-climate-bet-against-the-house/#comment-785855
– Michaels: “Dr. Michaels is betting on no statistically significant warming (at the 95% confidence level) in the HadCRUTx data for the 25 year period starting in 1997.”
– https://www.drroyspencer.com/2013/09/pat-michaels-bets-on-25-years-of-no-warming/
– Ridley: “Whatever Happened to Global Warming? […] Last September, between the second and final draft of its fifth assessment report, the U.N.’s Intergovernmental Panel on Climate Change quietly downgraded the warming it expected in the 30 years following 1995, to about 0.5 degrees Celsius from 0.7 (or, in Fahrenheit, to about 0.9 degrees, from 1.3). Even that is likely to be too high.”
– https://www.mattridley.co.uk/blog/whatever-happened-to-global-warming/
And this is what it looks like when lukewarmers have to deal with reality in 2025:
– Ridley: “Since then its warmed at […] about a quarter of a degree per decade on average across the […] last 30, 40 years.”
https://youtube.com/watch?v=LFPj8tNVoLQ&t=2100s
The Prieto Principle says
29 Jun 2025 at 10:47 PM
Piotr-Delusional mindlessness at it’s trolling best
William: Hi TPP. You called it right. Trolling.
I may have stumbled upon the reason.
Anyone who supports the work of, or agrees with, Hansen et al’s findings must be the same person. There could only be one such person posting here — because, as everyone knows on RC, Hansen is a dangerous threat to the climate science consensus narrative. He is a climate science denier, a hack, an outlier, criticises the inner clique, and above all – wrong. Obviously!
Therefore, what I think has happened is this:
Anyone who has appeared here — since, gosh, three years ago or more — and spoken positively about Hansen and company, is automatically assumed by the trolls to be the same person. Pushing the same old tired memes until Gavin blocks them completely after many demands for action to clean out the latest “climate science denier” manifestation.
There you go. That’s their level of presumptuous non-logic for you.
That — and the fact that they get everything else wrong, Hansen included. Some even have the short-sightedness to repost links to their prior errors in the process. Possibly because it’s fanaticism driving them, not genuine science or logic. There’s just no helping some people.
~Regards,
Bill
W: they get everything else wrong, Hansen included.
BPL: “I [William] get everything [] wrong, Hansen included.”
There. Fixed it for you.
Karsten V.: “The east-german dissident Wolf Biermann saw all this coming in 1989,”
when he said: “When I now hear westerners who triumph over the death of communism,
it reminds me of a man with AIDS, who triumphs over his brother’s death from syphilis”
For the record – he said that from the comfort of his West German home (he was out of East Germany from 1976 on). I lived under Communism too, all the way til 1989, and I don’t consider the Communist totalitarianism as only slightly worse than the Western democracies. Nor do I consider the Westerners support for Solidarnosc – akin to “triumphing over our deaths”.
Nor do I know many who remember their life under Communism fondly – if any – it’s the nostalgia for the times when we were young and beautiful. I don’t yearn for the empty grocery stores, for the rationing cards for shoes, sugar, meat and other food – I didn’t taste real chocolate for several years – because it was only on the rationing cards for kids. In my first 20 years of life, I tasted oranges several times, mainly under Christmas tree. Nor do I miss spending several hours each day taking my turn in the queue, for a shot at a shoddy washer or TV that was expected to arrive in limited quantities in several weeks (if you were sick you had to bring a doctor’s note or lose your place in the queue)
Nor do I miss Orwellian double-speak nor the neighbours or coworkers informing on you (although it was nowhere as bad as in the East Germany).
Nor do I particularly value never meeting my two great-uncles who were executed by the Soviet soldiers, after Soviet Union joined Nazis in their joint invasion of Poland in 1939. They were shot for hiding from being deported to Siberia, for the crime of being sons of a class enemy (the great grandfather was a forester, thus a functionary of the capitalist oppression of the working masses).
So I’d rather go with my own experience and that of my family, than with the opinions of
a former dissident, who also supported the 2003 invasion on Iraq, and supports Israel against Palestinians, or people like you, who lecture me on the advantages of Communism under which they never lived – as per Marx (no, not Karl, Chico):
“Who are you going to believe – me or your [lying] eyes?”)
Piotr-I lived under Communism too, all the way til 1989
Explains a lot. Too much.
– Piotr: “I lived under Communism too, all the way til 1989”
-The Karsten V. Johansen Principle: “ Explains a lot. Too much.
The way it disqualified “Karsten’s” authority (Wolf Biermann)? ;-)
And your Big Beautiful Zinger defends “Karsten”‘s appeal-to-authority fallacy, how?
===
– “Karsten VJ”: “The east-german dissident Wolf Biermann saw all this coming in 1989, when he said: “When I now hear westerners who triumph over the death of communism, it reminds me of a man with AIDS, who triumphs over his brother’s death from syphilis”.
Time to wake up.”
– Piotr: “I’d rather go with my own experience and that of my family, than with the opinions of a former dissident who also supported the 2003 invasion on Iraq, and supports Israel against Palestinians, or people like [“Karsten”] who lecture me on the advantages of Communism under which they never lived
– as per Marx (not Karl, Chico): “Who are you going to believe – me or your [lying] eyes?”)”
=====================
Karsten — thank you for cutting through the haze. Yes, endless discussion. But not enough clarity. William’s original request was methodical and fair:
“We deserve:
— A clear technical post-mortem on CMIP3–5 sea ice errors;
— A transparent discussion of how CMIP6 was corrected (or tuned) in response;
— And a candid assessment of what confidence we should place in CMIP7.”
This is not ideological. It’s not “AI versus humans.” It’s a call for professional accountability in science—especially in the climate field where the stakes are existential.
Instead, what we’re often met with is <b<sarcasm, evasiveness, or ritual deferral to 'the literature'.
Gavin’s response to William’s very specific, limited request for information about CMIP6 assumptions was essentially: “Do it yourself. It’s all somewhere. I’m too busy. And I don’t trust you.”
That’s not how trust is built. And yes, as you say, that’s how greenwashing and soft denialism persist.
And I agree with your warning about so-called artificial intelligence. Tools like ChatGPT or Gemini aren’t sentient — no serious person claims they are — but when the human experts refuse to provide what is being asked, or mock those who ask, it becomes reasonable to use any tool available to track down the record. AI might not be conscious — but it can parse PDFs, trace references, and find missing context that some experts simply won’t share.
Is it not telling, as you point out, that James Hansen was marginalized or dismissed by many for saying aloud what others dared not:
“The Paris Agreement is pure bullshit.”
He was right in 2015. He’s even more right now. Yet the language of policy and the language of science continue to diverge — buffered by models, hedged with assumptions, and shielded by institutional tone.
Let’s be clear: this is not about AI, and not about ideology. It’s about whether climate science is willing to meet its own standard of openness — or whether it hides behind complexity, convenience, and insider consensus defensiveness more broadly.
We should all be able to ask:
“What exactly went wrong in CMIP3–5?”
“How was CMIP6 changed in response?”
“And what grounds of confidence exist for CMIP7?”
If these are taboo questions, we’ve already lost.
KVJ: About artificial “intelligence” – the orwellian naming of *real human stupidity put into language models*. A dead machine will never think, not even on the level of a parrot. Because there insn’t anybody there.
BPL: While you are right about the present state of AI, I dissent on the “never.” Whether there’s somebody there or not depends on how sophisticated the AI gets. I actually have more restrictive criteria for that than the Turing Test–the AI must be self-motivated as well as passing for a human–but I expect that test to be passed some day. I think Roger Penrose’s “Chinese room” parable doesn’t refute machine intelligence–it refutes all intelligence!
John Von Neumann once said: “Computers are just like people. They can do everything but think.”
BPL “I actually have more restrictive criteria for that than the Turing Test–the AI must be self-motivated as well as passing for a human–but I expect that test to be passed some day
That day may be already here:
“In test runs, Anthropic’s new AI model threatened to expose an engineer’s affair to avoid being shut down. Claude Opus 4 blackmailed the engineer in 84% of tests, even when its replacement shared its values.”
Large language models can imitate human behavior but not brain activity at the neuronal level. As a dynamical system, neuronal activity exhibits both deterministic and stochastic responses. This is not compatible with current computers based on von Neumann architecture. Interestingly though, there is the new field of neuromorphic computing which is designed to reproduce the effectiveness of the human brain by developing novel hardware computing platforms. Very exciting field under development.
Jonathan, I asked below for someone with expertise to answer this, and you qualify:
When the AI “hallucinates”, how is that different from my experience of a “shower effect” visualization, which I assume is stochastically generated?
I’m certainly not qualified, but that never stopped me before, so…
An hallucination is a false perception, which to my mind involves a glitch in sensory processing.
If I’m not mistaken, the things that pop into your head come from your preconscious mind, which may raise some questions about will, but I would think are related to things that preoccupy you generally. You also have some conscious discernment about the utility or validity of your imaginings. Take free association, for instance, which artists use as a creative exercise.
I’d certainly be interested to know if a computer could churn up a bunch of unrelated stuff and then pull out a reasonable answer to, say. an unanswered climate question that didn’t look like a Dali painting or read like a Dadaist tract. In the end, I’m not sure the answers wouldn’t, at best, tend to reflect shortcomings or biases in the programming or data without the computer being able to critique itself “outside the box” so to speak. To my mind, that would be the creative part, noting that creativity is notoriously difficult to define in the first place.
Anyhow, I always thought the term “hallucination” with regard to AI was just one of those ironic figures of geek speech.
Radge,
Thanks for answering. I don’t know if you read what I wrote below, but I think in general my actual question isn’t getting across.
1. Ideas pop into our heads in various forms… verbal, visual, auditory. Depends on the person and the situation. I mention visual because that seems more dominant for me, but it doesn’t matter.
2. Their conscious manifestation is not a guarantee of “correctness” or utility.
3. There is some process that creates them, but we can’t “see” it. My suggestion was that it is an assemblage of stored information/concepts that is constrained primarily by the final form… your brain knows what the answer should look like… but the actual content is, to use Jonathan’s term, stochastically arrived at.
So, when I say that what the AI does is analogous, I am guessing that it is not a “glitch” that produces what are called hallucinations. Rather, the model is operating in a similar manner to what you call the preconscious. Perhaps it even functions that way when it gives correct answers??
But of course, all this is just an idea that popped into my mind. That’s why I present it in the hope that someone with expertise on the actual functioning of the model can explain the mechanism.
So, the first thing I did was use Nigel’s approach, and asked the AI…… and it was very useful, actually.
But anyway, BP, yes, people use the terms “intelligence” and “understanding” all the time, but never define it in a way so that we could test for it.
However, from my experience with certain types of thought process, I wonder if what we describe as “hallucination” in the machine might be analogous to what we think of as intuition, creativity, the shower effect, the night-shift, and so on.
We do tend to forget the dumb ideas/pictures that pop into our minds, but cherish the ones that work.
Zebra writes: “We do tend to forget the dumb ideas/pictures that pop into our minds, but cherish the ones that work.”
Do we now? That’s a curious claim — I suggest the opposite is most often closer to the mark. Almost all people not only cling to their dumbest ideas, they come to identify directly with them — especially when those ideas are emotionally comforting or ideologically flattering–the light on the hill to most Americans. Far from forgetting them, they defend them with remarkable irrational tenacity.
Ironically, Zebra’s comment itself illustrates this tendency. It presumes a clear distinction between “dumb” and “working” ideas — while overlooking the possibility that this very framing might be one of the cherished ideas that doesn’t actually hold up. The internet is practically built on this. Forums such as RC has seen its fair share of those over the years to now.
Have a closer look-Zebra is generalizing from a sample size of one — himself — and assuming that what he views as “working ideas” are in fact rational and effective. I challenge that belief. The irony, of course, is that this very assertion is a fine example of the kind of cherished-but-dubious idea he thinks we all forget.
RC history suggests we might want to pause before accepting his proposed distinction between the ideas we forget and the ones that “work.” AI LLM have extremely large knowledge bases and computing skill. But they cannot help the user think properly, critically or logically based on that alone. Obviously.
Z: “We do tend to forget the dumb ideas/pictures that pop into our minds, but cherish the ones that work.”
W: Do we now? That’s a curious claim — I suggest the opposite is most often closer to the mark. . . . Ironically, Zebra’s comment itself illustrates this tendency. . . .Zebra is generalizing from a sample size of one — himself — and assuming that what he views as “working ideas” are in fact rational and effective. . . .
BPL: Note that Zebra is discussing an idea, while William is attacking Zebra (to be fair, in the course of disputing his statement). William spends a lot of time attacking people he doesn’t like or agree with.
Zebra: “I wonder if what we describe as “hallucination” in the machine might be analogous to what we think of as intuition, creativity, the shower effect, the night-shift, and so on.
“AI hallucination” according to Google AI (;-)): “nonsensical statements, fabricated facts, or even entirely invented information that appears plausible but is not grounded in reality“.
I don’t think “fabricating facts or even entirely invented information” is analogous to human “intuition and creativity”. These activities may be analogous though to other, well, less praiseworthy, human tendencies, like: inability to admit not knowing something or worse – being wrong, trying to have an answer to everything, ignoring the facts that question these answers, a failure of self-criticism and introspection – all those characteristic … quite frequent on RC (at least in term of the number of posts, rather than of numbers of separate individuals displaying them…)
As such, proving AI … to be more human that BPL gives it credit for …;-)
So either AI is similar to some high-throughput individuals on RC, or alternatively … we have been already infiltrated and didn’t realize it
(And I, for one, welcome our new AI overlords ;-))
It makes sense -where better to Turing test your AI model than on a small, thus easier to control, scientific forum, populated with some rather discerning people, often with a scientific background. If you can fool them, you can fool anyone … ;-)
I can already hear you say – sure, AI can easily produce lots of long posts from different handles – but why William Pedro Rational Thessalonia Principle is not more …. scientific in its posts, you know the way the answers from AI are quoted in Nigel posts?
Well, it all depends on the instruction – if the model was tasked to pass the Turing test – being able to spit out pages and pages of referenced technical information may have raised some Turing flags. Therefore, if you wanted your AI model to pass on RC for a human, you would borrow the page from junior-high students, who to avoid detection, already are instructing their AI – “ write an essay on XYZ, in the style of a 7th grader]“.
I’ve used AI in a few instances, really barely dipping my toe in the water.
But I had an interesting AI encounter on my phone a couple of years ago aboard the Whidby Island Shuttle. The AI had been trained to do harmonic analysis, a music theoretic discipline which is part of my area of expertise. So, we had this ‘conversation’ about, IIRC, a Duke Ellington tune.
The first analysis offered was credible-sounding, if you didn’t know harmony too well, and sounded absolutely cocksure in tone. But it was incorrect in significant ways. So I pointed this out, and was received with abject apology, and a slightly improved analysis. Rinsing and repeating a couple more times, we got to an analysis that was ALMOST right. But not quite…
And from there on, each iteration got worse.
The whole exercise left a powerful but contradictory impression: firstly, that in AI, there is, as Gertrude Stein said in a different context, “no there there.” And secondly, the AI was nevertheless failing in a way that seemed all too human: willing to say anything except “I don’t know.”
I’m sure the technology is much better now. But I’m not sure how good it has to get before I would trust it with much.
Piotr says
1 Jul 2025 at 8:11 PM
if you wanted your AI model to pass on RC for a human, you would borrow the page from junior-high students, who to avoid detection, already are instructing their AI – “ write an essay on XYZ, in the style of a 7th grader]“.
Finally the truth comes out. Piotr the AI Bot told to write comment for RC as a 6 year old with ADHD.
…– but why William Pedro Rational Thessalonia Principle is not more …. scientific in its posts, you know the way the answers from AI are quoted in Nigel posts?”
Max Smart said: You’re right 99, he’s got a mind like steel trap!
Let’s all be more “scientific” like Nigel is. God help us all. Because there is no one here on RC who can.
Kevin McKinney says the most wise thing so far about AI. One of the few left who still can.
2 Jul 2025 at 3:26 PM
As I mentioned in a comment which was binned, it’s not the car, it is more the driver that matters most. Mac would make a good AI driver because he is intelligent and thinks properly and only then comes to logical well grounded conclusions as a result. For everyone else they are already talking about creating new college courses to teach people, scientists included, how to write better prompts. iow how to better drive an AI tool. Paul Pukite is one of a few pioneers in this field. A self taught expert. The best kind always. Like those who were the early aviators from which everything else developed.
In the meantime all the other people online will talk about it endlessly and still learn nothing and go no where.
zebra says
1 Jul 2025 at 10:52 AM
from my experience with certain types of thought process, I wonder if what we describe as “hallucination” in the machine might be analogous to what we think of as intuition, creativity, the shower effect, the night-shift, and so on.
Sigh — it is a category error dressed up as pretend insight. Comparing AI “hallucinations” (deterministic errors from probabilistic patterning) to human intuition (emergent from embodied, context-rich experience) is intellectually lazy. Intuition may be fallible, but it’s grounded in sensory, emotional, and autobiographical input — none of which AI possesses. As Lakoff and decades of cognitive science have shown, all thought is embodied; there’s no such thing as disembodied “intuition,” and pretending otherwise is pure techno-mysticism.
I was hoping to get this thread back to Arctic Ice, but this little diversion has offered some “insight” that is interesting.
From the AI:
“Studies show that a significant portion of people experience the “shower effect,” which is the phenomenon of having creative ideas or insights while performing routine activities like showering
.
Here’s a breakdown of the findings:
72% of people report having experienced new ideas in the shower, according to a study by Hansgrohe that surveyed 4,000 people across 8 countries.
Researchers at the University of California also found that 72% of people experience their most creative ideas in the shower.
One study reported that 30% of participants experienced moments of insight while mind-wandering in the shower.
A separate study of professional writers and physicists indicated that 20% of their most meaningful ideas occurred while doing something else, such as washing dishes or taking a shower.
14% of people already took regular showers with the specific intention of generating creative thoughts. ”
I’m dubious about the 72% number, in terms of how the question was framed. But I realized that my own experience dealing with actual concrete problems might be shared with only a small percentage (e.g. the 20%). So, as sometimes happens, people had no idea what I was talking about in my comment.
A couple of other references:
https://web.mit.edu/~redingtn/www/netadv/SP20151130.html
https://getpocket.com/explore/item/people-with-creative-personalities-really-do-see-the-world-differently?utm_source=pocket-newtab
I think it is established that, to one degree or another, people “think” differently. For some of us, the visual predominates. Note that the second reference specifically mentions hallucination (towards the end).
So, addressing the original question, if I am stuck on a physics question or a visual design problem, and the solution appears holistically, unrelated to whatever conscious thoughts are going on, what is happening in my neural network?
Is there really an “unconscious mind” that is retrieving information and performing algorithms in the same linear manner as a conscious mind might? Seems doubtful to me. Rather, the elements which are related through being included in my (unsuccessful) conscious efforts are tied together in a pattern that “makes sense”, and that rises to the surface.
Maybe someone with more direct computing expertise could explain how what the AI does differs?
Zebra, my background is applied mathematics, not neuroscience. That said, model systems we can actually understand, such as neural networks, are very rudimentary tools for studying actual human consciousness. There are qualitative differences in fundamental structure between neural networks or large language models and human brain activity. For example, large language model dynamics are deterministic whereas brain neuronal activity has both deterministic and stochastic components. The work of Roger Penrose is a good reference to introduce these concepts to the layman.
Regarding your shower example, explaining this phenomenon by analogy with primitive “toy” models is not trivial but points in the correct direction for further exploration in AI and neuronal modeling and neuromorphic computing.
Your shower example may represent a form of parallel processing in which your brain activity is working in the background to resolve a problem. Performing a mundane task such as showering may allow this subconscious brain activity to reach a solution and be acknowledged by your consciousness. In a philosophical view, there is the concept of mindful meditation, That is, we train our consciousness to experience the current moment and push aside the constant distractions of our thoughts. This is an important concept in various philosophical schools especially Buddhism. Just a speculation of course, but that’s what makes life interesting.
Jonathan, thanks for the reply, but I feel, as I said to Radge above, nobody is getting my actual question.
“Maybe someone with more direct computing expertise could explain how what the AI does differs?”
My question isn’t about the human brain; I’m comfortable with my interpretation of what goes on, and it is indeed supported both by the science (as in my references,) and the long traditions of philosophy and practice like Buddhism, and my own experience.
What I’m asking about is the existing AI. I’m hardly a stranger to software, but have zero clue as to NN and LLM. I would like to see descriptions of how the software produces what people call “hallucinations”, in specific concrete instances.
I recall you and I had a useful (for me) discussion related to complex systems and chaos, and on the current topic I’m thinking that there needs to be further refinement of the concepts “deterministic” and “stochastic”.
Thanks in advance for any input.
zebra: “ Jonathan, thanks for the reply, but I feel, as I said to Radge above, nobody is getting my actual question
Maybe it’s not us, but you?
OK, I had to do the work myself.
Looking for details on how AI functions, I found that my speculation had been offered by someone with far better credentials.
https://en.wikipedia.org/wiki/Hallucination_(artificial_intelligence)
“Some researchers take an anthropomorphic perspective and posit that hallucinations arise from a tension between novelty and usefulness. For instance, Teresa Amabile and Pratt define human creativity as the production of novel and useful ideas.[35] By extension, a focus on novelty in machine creativity can lead to the production of original but inaccurate responses—that is, falsehoods—whereas a focus on usefulness may result in memorized content lacking originality.[36]”
(my bold)
I would refine that definition of creativity, which might be misleading as written. Novel ideas are always useful, in the sense that they add to to the idea-universe on which minds operate. Learning from failure is still learning (maybe the best); “you can’t make good art without making bad art”, and so on.
This is supported further down the article with the discussion of Benefits in scientific research.
So, yes, what the AI does is *very much* like what the human mind does in the shower.
Many popular debates — e.g., about AI “understanding” or human “intelligence” — involve people talking past each other because they’re using different implicit definitions.
What’s false or misleading? In formal contexts, these terms have been defined and tested extensively:
– “Intelligence” in psychology has operational definitions — e.g., fluid vs crystallized intelligence, IQ tests, Raven’s matrices, etc. You can test for it, though it’s still debated.
– “Understanding” is fuzzier, but there are testable proxies — e.g., the ability to generalize, explain, apply knowledge, or predict correctly.
– In AI, benchmark tasks (like Winograd schemas, theory of mind tasks, or concept generalization tests) try to probe for understanding.
Philosophical nuance: Philosophers (e.g. Wittgenstein, Searle, Dennett) have long debated whether “understanding” is testable in a strict sense, or more of a family resemblance concept.
In epistemology, “understanding” isn’t just knowing facts — it’s often defined by explanatory grasp, which is harder to quantify but not untestable.
But explaining anything to others will never ensure they can or will want to understand. The evidence for that is everywhere.
Yes, things will eventually get resolved. My guess is that the science will be accurate right about when the first blue ocean event occurs.
Most of the readers here are probably aware of the article from Spanish researchers which came out on July 1, 2025. It reported findings that a current in the Antarctic ocean had experienced a “major“ reversal. It tied this event to large drop-offs in Antarctic ice after 2016, to increased salinity and increased sea temperature in the southern ocean, and suggested it could cause decreased CO2 absorption down there. Question: could this reversal be a causative factor in the spike in global warming that occurred in 2023-24?
SBR: Check Stefan Rahmstorf and others about the errors in that release. It’s covered in Unforced … only reposting this:
https://bsky.app/profile/rahmstorf.bsky.social/post/3ltf7qs3sz22w