The #AMOC is the reason for Europe’s mild climate. Evidence that it is slowing has been piling up over the years – it now is likely at its weakest in at least a millennium, and it may even be approaching a tipping point. Here I will show you the latest high-resolution images – and also discuss whether there is serious evidence speaking against an ongoing AMOC weakening.
Our regular readers are well aware of the Atlantic Meridional Overturning Circulation, or AMOC in short, a large-scale overturning motion of water along the whole Atlantic which transports a quadrillion Watts (that is 1015 W) of heat to the northern Atlantic, partly via the Gulf Stream. (If you are new to the topic, check out this article.)
Instabilities of the AMOC have produced some of the most dramatic climate changes in recent Earth history, well-known to paleo-climatologists (see e.g. my by now ancient review in Nature 2002), and concerns that we are destabilizing it by causing global warming has been rising sharply in expert circles in recent years (see last year’s open letter by 44 experts).
One reason is what we are observing in the northern Atlantic. And another reason is the latest model simulations by the Dutch research group in Utrecht. A recent paper by van Westen et al. (2025) has shown that the much-feared tipping point where the AMOC breaks down (first demonstrated in a simple box model in 1961) is also found in a high-resolution (eddy resolving) ocean model – destroying any hope that it might be an artifact of too coarse and simple models. This tipping point has been consistently demonstrated across the entire model spectrum by now, and the cause is well-understood (a destabilizing salt transport feedback).
Also, that model simulation and paper provide us with the AMOC ‘fingerprint’ in sea surface temperature (SST) in unprecedented detail. So let’s have a look (Fig. 1)!
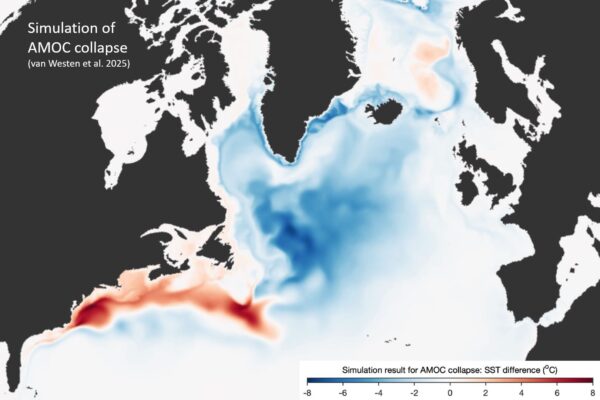
Figure 1. Sea surface temperature change pattern caused by the AMOC shutting down in a high-resolution ocean model. This is a pure AMOC effect without any greenhouse-gas climate change. We see the famous blue ‘cold blob’ due to less heat being brought to the northern Atlantic, and also in red the northward Gulf Stream shift, an ocean dynamics effect of weakening AMOC (Zhang 2008). Source: van Westen et al. 2025., mapped by Ruijian Gou.
And now compare that fingerprint pattern to the trend in satellite sea surface temperature measurements (Fig. 2). What do you see?
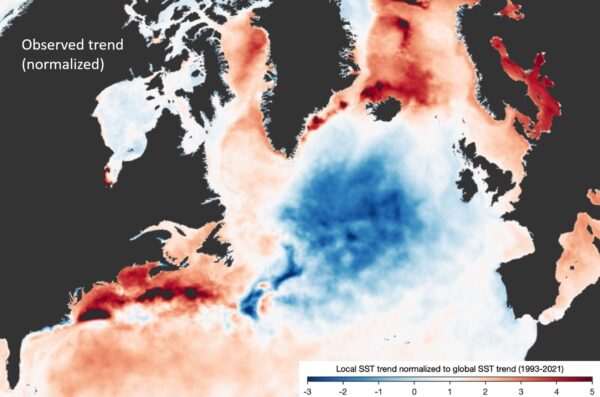
Figure 2. Normalised trend in satellite-derived sea surface temperature 1993-2021 (linear trend over that period). Normalised means it is divided by the global mean sea surface temperature trend in order to take out the global warming signal. So blue regions (values less than 1) have warmed less than the global mean or cooled, red have warmed more than average. Source: Copernicus satellite data, mapped by Ruijian Gou.
The cold blob and the Gulf Stream shift signal are both clearly seen in the satellite trend. Note we are only comparing the pattern, not its amplitude, and the colors correspond to different units: In the observational data we are talking about a moderate AMOC change, in the model a near-complete shutdown. That explains also the differences: in the satellite map the Labrador Sea hasn’t cooled, presumably as deep convection there still continues. And the Nordic Seas have warmed – we have a paper in preparation which shows this is due to increased flow of warm water toward the Nordic Seas and likely a result of AMOC weakening; these two overturning motions are dynamically anticorrelated, but only temporarily so until Nordic Sea convection shuts down.
Taken together, these two images provide once again clear evidence that an AMOC weakening is underway – as was first argued fifteen years ago by Dima and Lohmann (2010). The same fingerprint is also found in a coupled climate model simulation for CO2 doubling by the Geophysical Fluid Dynamics Lab in Princeton, as shown in Fig. 1 in this blog post from 2018. And the fingerprint pattern of cold blob and Gulf Stream shift can also be seen for a different time interval in the following global image of sea surface temperature change (Fig. 3).
This weakening is of particular concern because the AMOC has a tipping point, and our recent study has shown that in many of the standard future global warming simulations performed for the current IPCC report the AMOC passes that tipping point and shuts down in the following decades. The Guardian rightly titled that this danger “is no longer low-likelihood”, as we had discussed it for decades.
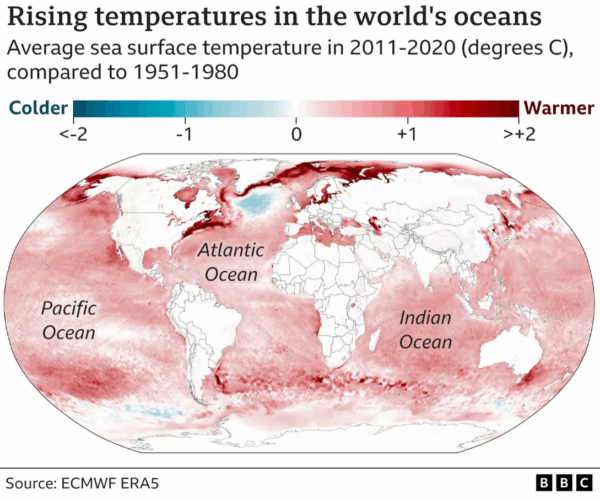
Figure 3. Global map of changes of sea surface temperature. Source: ERA5/BBC
What about counter-arguments?
I sometimes read counter-arguments against an ongoing AMOC slowing, but many just don’t hold water. Let’s have a look at some of them.
For example, the increase in Nordic Sea exchange is sometimes taken as contradicting an AMOC weakening – but that is a non-sequitur as there is no reason why these two circulations should be in sync, but good physical reasons and empirical evidence suggest that in fact they anti-correlate.
Not seldom different time periods are mixed up – for example when the Worthington et al 2021 reconstruction is quoted as questioning an AMOC weakening. Let’s compare that to the reconstruction by Caesar et al. 2018 where we estimated a 15 % weakening since the late 19th Century (Fig. 4) – I would say these two reconstructions strongly agree during the time interval 1981–2016 covered by Worthington.
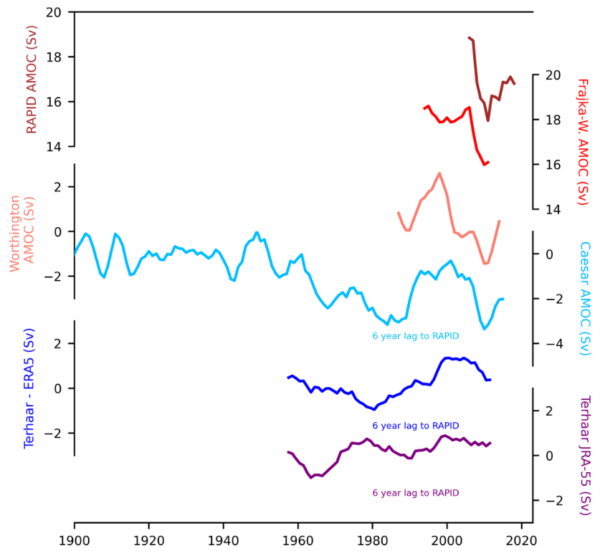
Figure 4 Several AMOC reconstructions, with the RAPID measurements on top. The reconstruction by Frajka-Williams et al. 2015 used surface height data from satellite, and the Worthington et al 2021 reconstruction uses a water mass regression based on RAPID data. Graph: Levke Caesar.
One recent prominent paper by Terhaar et al. (2025) that has questioned AMOC weakening covers a longer interval (1958 to 2022). But for the period since 1958 Caesar et al. 2018 also did not find a statistically significant AMOC weakening – so strictly no contradiction there – and what’s more, the calculated input data used (surface heat fluxes) are far more uncertain than the directly measured sea surface temperatures, as we can see in the large differences between their two reconstructions (dark blue and purple) using two different surface flux data sets. And they both disagree with the likely more reliable reconstruction method by Worthington. (More on the Terhaar study here.)
Then there is Latif et al. 2022. They don’t claim to contradict the Caesar reconstruction, they explicitly write they don’t. What they argue is that natural variability is larger than an anthropogenic effect. That is not the same as saying there is no AMOC slowing. In the Caesar reconstruction multidecadal variability is also larger than the slowing trend. I always show Latif et al 2022 in my talks in support of the observed SST fingerprint pattern indicating an AMOC slowing, since their paper shows a clear correlation of the SST fingerprint with the AMOC (as shown in Fig. 2 here in this post).
Sometimes also a paper by Rossby et al. 2022 is cited as questioning an AMOC slowdown. Let’s just quote their abstract: “There is evidence for a 2.0 Sv Gulf Stream slow-down between 1930 and 2020. Whether and to what extent this reflects a slowdown of the AMOC or wind-driven circulation cannot be established with certainty. Our estimate of a 0.4 Sv AMOC decrease is reported with low confidence.” They thus report a slowdown, just with low confidence.
There is also a reconstruction since 1900 by Fraser and Cunningham 2021. They write that “from the 1930s onwards we see qualitative agreement with Caesar et al. (2018), with mostly a high AMOC until the 1950s, followed by a weakening throughout the 1960s and then a lesser peak around 2000”. There is disagreement between 1900 and 1930, where however their method is very uncertain, so they conclude that although their “results do not resolve AMOC weakening over the last century, they should not be interpreted as evidence to the contrary.” Which some people do nevertheless.
As another example, a paper by He et al. 2022 argues based on a model simulation that the SST fingerprint pattern could also be caused by surface fluxes rather than an AMOC weakening. However, the observed fluxes suggest the opposite (preprint).
And finally there was a paper which many media reported as showing a much more resilient AMOC even though it used the same models as other studies and just focused on a wind-driven remnant flow known since the 1990s, and the Volkov study about a stable Florida Current which climate skeptics confused with the AMOC (see postscript here).
So while there is quite a number of studies with different methods using temperature or salinity data or paleoclimate proxy data from ocean sediments that support a weakening AMOC since the 19th Century (as I have previously discussed e.g. here, here and here), I do not really see a credible counter-argument. If you know one that I have missed, please let me know in the comments!
And as a final reminder: if there is a risk that the AMOC is weakening and heading towards a tipping point, we need to act on that (just like with other major risks). This is not an issue where we can afford to wait until we are certain, or pretend it’s just an academic discussion without major consequences.
Correction: I changed the wording with the link about the Baker et al study as it was pointed out to me that the original was based on a misunderstanding. The study says: “Although simpler models and a few global climate models suggest that the AMOC could collapse (that is, weaken to zero or reverse) under such forcings, it does not collapse in the model experiments considered here.” Many colleagues including me understood this as redefining the word ‘collapse’, as in past studies that has usually meant a strong weakening (not to zero) even if a shallow wind-driven part remains (as is known since the 1990s). But Jonathan Baker says this sentence was not meant as a new definition of ‘AMOC collapse’. See also my previous article on that study.
If you want more information on this…
My overview article in Oceanography Magazine (open access, many pictures)
My Alfred Wegener Medal lecture at the European Geosciences Union meeting 2024
We at Hellnasker recently listened to a lecture by Lars Henrik Smedsrud (NORCE/Bjerknes Centre), where he argued that the “cold blob” south of Greenland has largely disappeared in recent years. He suggested that while the AMOC may indeed be weakening, there are no signs of collapse — emphasizing that the ocean appears more resilient and stable than many models predict.
From your perspective, how do you interpret this apparent disappearance of the cold blob in the latest SST data (e.g., ERA5 2023)? Do you see it as a temporary signal masked by surface warming, or as a sign of partial recovery of the AMOC?
And finally, considering Iceland’s unique position at the meeting point of the Arctic and Atlantic, what kind of long-term ocean monitoring or process studies would you see as most useful for Icelandic oceanographers to assess how AMOC variability might affect nutrient transport and fish stock productivity in our region?
[Response: It tends to disappear in summer, covered up by a warm shallow mixed layer. For climate change we look at long-term trends. Note also that in the blog I comment on Smedsrud’s claim that the stable or increasing Nordic Sea exchange is at odds with an AMOC decline – that is not the case. -Stefan]
Paper by Matthew H. England et al. The El Nino did an unusual thing in 2023 (I haven’t read the Paper for details yet) affecting a High Pressure system which shoaled the ocean well-mixed layer in northern temperate latitudes by reducing surface winds, apparently in a pattern that tracked the sudden SST increases around regions, a correlation.
[Response: Yep, I’m a coauthor on that paper in Nature: https://www.nature.com/articles/s41586-025-08903-5 -Stefan]
IPCC AR6 WGI Summary for Policymakers, C.3.4: “The AMOC is very likely to weaken over the 21st century for all emission scenarios. While there is high confidence in the 21st century decline, there is only low confidence in the magnitude of the trend. There is medium confidence that there will not be an abrupt collapse before 2100. . . .”
(While paragraph C.3.5 went on to cite possible contributions from a short series of volcanic eruptions over a period of decades, those events will probably be subject to modeling only should they occur.)
Still a few years out from AR7 WGI publication, the data and models reported here begin to suggest to this layman that, while the former report expressed “low confidence” in the magnitude of the trend and “medium confidence” of no abrupt AMOC collapse before 2100, data and modeling begin to suggest that AR7’s revisitation of these subjects may well be adjusted.
Can we anticipate based on data and modeling available in mid-October 2025 that the chances of “an abrupt collapse before 2100” is far enough beyond “medium confidence” to qualify as “high confidence”? (either now or by the time of AR7’s anticipated release in 2029) –and that reckoning of the magnitude of the trend will support at least “medium confidence” if not “high confidence”? (again, either now or by the time of the AR7 release)
(Recent NSIDC data show that Greenland’s ice mass loss is hardly abating.)
[Response: I would agree that there most likely will be “no abrupt AMOC collapse before 2100”, since in all the warming scenario simulations the AMOC dies gradually over a period of 50-100 years after crossing the tipping point. That makes sense because the dense water at depth, which drives the NADW flow, doesn’t vanish suddenly, it needs time to erode away. An AMOC start-up in contrast can be much faster and indeed abrupt, as it triggers deep convection and thus deep release of heat from the water column which densifies it very rapidly drives a major AMOC flush, as in Dansgaard-Oeschger events.
Of course, impact of major AMOC changes can be felt within this century, they don’t only start when the AMOC has fully shut down. -Stefan]
Gah! Thank you for the news nonetheless, Stefan. I’m among the RC regulars acquainted with ‘AMOC’. As you say, the transport of equatorial heat poleward apparently keeps much of Europe’s climate more clement than it would otherwise be. There’s more to it than that, to be sure, but the public concern is for a relatively sudden, drastic cooling of Europe’s climate, entailing high costs and mass casualties.
I presume there’s no paradox between that general expectation, and the recurrent lethal heat waves in multiple European cities from London to Lisbon this summer (https://www.imperial.ac.uk/grantham/publications/background-briefings/uk-and-european-heatwave-2025-/)? Has any relation between AMOC and European regional weather been investigated? Will London, for example, suffer more or less lethal heat?
Thanks in advance.
Lethal heat??? I think you have been reading too many shrill headlines MA. Here are the weekly European deaths over the last 3 summers, and a couple of winters for comparison.
https://photos.app.goo.gl/8ZJP6EcPdwLVMBr37
And if you don’t like my focus, make your own graphs. You can select individual countries and age ranges
https://www.euromomo.eu/graphs-and-maps
The fact that winter flus kill many thousands does not negate the additional fact that summer heat spikes are lethal as well.
Anyone at all familiar with statistical analysis can see that there are TWO effects going on in your first graphic. Your second set of graphics shows it even better: Winter flus kill older populations who tend to be warehoused inside. That is true. It also has nothing whatever to do with a rise in summer heat spikes which also show up in the data.
Yes, I know and agree with all you have said jgnfld.
My point is the false hype MA was spruiking. If you look further down that page to the country summaries the death-rate for the week mentioned in the article (26/6/2025-2/7/2025) was below average in England, as was the week before and the week after. In fact there was only one week in the entire English summer when the death-rate exceeded normal
Keith Woollard: – “Lethal heat???”
The Conversation article published on 6 Oct 2017 headlined The reality of living with 50°C temperatures in our major cities, began with:
https://theconversation.com/the-reality-of-living-with-50-temperatures-in-our-major-cities-85315
The all-time maximum temperature for Penrith was 48.9 °C, recorded on 4 Jan 2020. On that day, Penrith was the hottest place on Earth and set a new record for the Sydney basin.
https://www.bom.gov.au/climate/current/month/nsw/archive/202001.sydney.shtml#recordsTmaxDailyHigh
Since the 2017 article was published the rate of GMST warming has accelerated to ~0.4 °C/decade most recently.
https://www.researchsquare.com/article/rs-6079807/v1
Thus, it seems to me 50 °C summer days may arrive sooner.
At 52 °C shaded dry bulb temperature with 15% relative humidity, at this condition with minimal physical activity, heat stroke is imminent.
https://www.calculator.net/heat-index-calculator.html?airtemperature=52&airtemperatureunit=celsius&humidity=15&ctype=1&x=Calculate
Dr Andrew Forrest AO, at the Boao Forum for Asia Perth 2023, on Wednesday, 30 Aug 2023, said:
“Normally, your sweat will cool you down. But if it’s too humid, your sweat can’t evaporate. Your body heat can’t escape. As you sit here, your body is churning through energy, creating heat right now. If you can’t exhaust that heat, you’re going to cook pretty quickly. You’re a thermo-regulated organism. It’s a survival advantage, until global warming. Now, your thermal-regulation is not a survival advantage – it’s a survival disadvantage. If you can’t get rid of that heat because of humidity, you cook yourself. Your core temperature starts to rise – I’m not kidding about any of this. This is proper, referenced science. At just 35 degrees Celsius, with high humidity; death within six hours. Deaths have been recorded within fifteen minutes – I’m just… As a scientist, we’ve got to be as safe as possible, so I’m saying, within six hours. But even temperatures as low as 31 degrees can kill.”
https://youtu.be/kigyFOj7HUw?t=331
See also PNAS research article by Daniel J. Vecellio et al. published on 9 Oct 2023 tilted Greatly enhanced risk to humans as a consequence of empirically determined lower moist heat stress tolerance, Figure 4:
https://www.pnas.org/cms/10.1073/pnas.2305427120/asset/7e1197f1-3196-4a36-a310-937609789b47/assets/images/large/pnas.2305427120fig04.jpg
Researchers at the University of Sydney are testing human volunteers to understand how humans cope with extreme heat.
https://www.youtube.com/watch?v=poQklIrdEI8
Nice copy/paste there Geoff, and so relevant to the weather conditions due to the AMOC in London.
Just a random selection of hype. And then you quote the world’s best snake oil salesman???
Ask him how SunCable is going
Or his Qld hydrogen hub
Or his infinity train?
Or his NT green hydrogen
Or his Arizona hydrogen
Or perhaps his 400km trip in his helicopter to protest about Scarborough gas . I am assuming his helicopter is electric. No one in their right mind would use so much hydrocarbons to protest hydrocarbon use.
You don’t need to lecture me on heat, I spent 4 months over summer 400km north of Kal as a raise-bore driller’s offsider pulling drill stems for 11 hour shifts. But that was the early ’80s and so obviously the weather was perfect everyday
Keith Woollard: – “Just a random selection of hype.”
Perhaps you should tell that to Professor Ollie Jay, Professor of Heat and Health, at the University of Sydney, aye Keith?
https://www.sydney.edu.au/medicine-health/about/our-people/academic-staff/ollie.jay.html
Perhaps you could show everyone how well you can handle the heat and humidity in the Climate Chamber of the Thermal Ergonomics Laboratory at the University of Sydney, aye Keith? Perhaps you could volunteer to be another human test subject? No?
https://www.sydney.edu.au/news-opinion/news/2025/08/06/to-save-lives-in-heatwaves-focus-on-how-human-bodies-work.html
Keith Woollard: – “You don’t need to lecture me on heat, I spent 4 months over summer 400km north of Kal as a raise-bore driller’s offsider pulling drill stems for 11 hour shifts. But that was the early ’80s and so obviously the weather was perfect everyday”
Seems to me you are in denial of the increasing risks of extreme heat.
https://heathealth.info/wp-content/uploads/unsg_call_to_action_on_extreme_heat_for_release.pdf
Keith Woollard: “ I spent 4 months over summer 400km north of Kal as a raise-bore driller’s offsider pulling drill stems for 11 hour shifts
” raise-bore driller’s offsider pulling drill stems” – that would be some kind of drilling operations, I presume? What you were drilling for?
Air Piotr.
Raise bores are used to drill ventilation shafts. This particular mine was nickel
Title: “Quantitative metabolome analysis of boiled chicken egg yolk”
Authors: [Various]
Journal: Metabolomics (or accessible via PubMed)
Link: https://pubmed.ncbi.nlm.nih.gov/36582447/
It gives insight into how heating (i.e., boiling) transforms the internal structure and chemistry of the egg—relevant to “why/how” an egg cooks scientifically.
Hi, Keith. The reason “London deaths by heat” is a “thing” is because dying from heat is news on an island known for damp and chilly.
Kind of like folks freezing to death at sea level on the equator. Imagine Keith’s News headline the next day: “Equatorial people die of heat more than freezing”
Yes, you are certainly correct about the newsworthiness of unusual events like this, but ALL countries have a higher deathrate during colder weather than warm
Probably true. Places tend to depopulate from misery before too many die from heat. Instead of asking about body counts ask, “Will Phoenix grow or shrink?”
Keith Woolard “ ALL countries have a higher deathrate during colder weather than warm ”
What can be asserted without evidence can also be dismissed without evidence.
And when your fellow deniers try to come up with evidence and call upon a 2021 Lancet paper promoted by their God, Bjorn Lomborg, they end up … with an egg on their face. The last time …. 3 weeks ago in the parallel thread on Climate Literacy, with Keith Woollard present there.
Piotr 7 Nov 2025 at 9:52 PM:
====
The [favourite Lomborg’s Lancet paper: Qi Zhao et al. Lancet Planet Health 2021;5: 415–25] models the excess mortality data from 2000-2019: cold causing =8.52% excess death, and heat causing =0.92%. However, I question how they assigned the excess deaths to cold or heat, and how they failed to control for the non-climatic confounding factors.
In that study, Qi Zhao et al. DIDN’T identify the heat or cold-related death based on any ETIOLOGY of diseases – instead they simply …. fitted the temperature changes against the local mortality!
By this logic, if a war broke out in a country – they would attribute the resulting excess deaths to …. changes in cold or heat.
As result, they got some very “interesting” results: for Eastern Europe, which had the lowest mean temperatures out of all regions in the study – and with winters that famously defeated both Napoleon and Hitler – that Lancet study calculated …. HEAT-associated-mortality in this region to be …. 5 TIMES the GLOBAL AVERAGE!
Conversely, the subSaharan Africa, with its oppressive heat and humidity – is according to our authors – a poster boy for deaths from … COLD – it has DOUBLE the global average for excess deaths from COLD. The Sub-Saharan Africa ! ;-)
============= end of Nov. 7 argument ==============
Not a peep to that from the RC deniers – they would wait a while, and then drop the message: Global Warming – Good! , in another thread, as if it has not been challenged multiple times before.
Has any relation between AMOC and European regional weather been investigated? Will London, for example, suffer more or less lethal heat?
D’oh! Of course there have been such studies that assume the AMOC keeps running. I’m curious about models of European regional weather after AMOC collapse.
Sorry for not asking a clear question.
[Response: The interactive AMOC scenario website might be what you are looking for? https://amocscenarios.org/?lat=45&lon=-5&model=cc_RCP45&is_amoc_on=false&is_delta=false&metric=temp_2m
– Stefan ]
“[Response: The interactive AMOC scenario website might be what you are looking for? https://amocscenarios.org/?lat=45&lon=-5&model=cc_RCP45&is_amoc_on=false&is_delta=false&metric=temp_2m
– Stefan ]”
Awesome! What a great tool for the data-driven. Thanks, Stefan!
Figure 3. Global map of changes of sea surface temperature. Source: ERA5/BBC
Seems to me I should be seeing a map depicting changes. I’m not seeing such on my Mac running Safari.
Am I missing something?
Hi Tim,
Windows w/Chrome showing it, and it’s a .PNG they’re hosting like the other two.
Does this direct link work?
https://www.realclimate.org/images/ERA5-SST.png
I find a lot of this commentary misleading and not up to date.
The AMOC is not just an ocean phenomenon but very much coupled with the atmosphere. Our earlier studies (which take results to more recent than given here) show a lot of variability but only a small trend. Our latest is here: (available freely)
Trenberth. K.E., L. Cheng, Y. Pan, J. Fasullo and M. Mayer, 2025: Distinctive pattern of global warming in ocean heat content J. Climate, 38, 2155-2168 https://doi.org/10.1175/JCLI-D-24-0609.1
There is so much more going on. Please pay attention
Kevin Trenberth
[Response: Of course the AMOC is coupled to the atmosphere. We have a paper in review with Lijing Cheng as coauthor which looks at just that and shows once again that the AMOC ‘fingerprint’ pattern is not caused by atmospheric forcing but by ocean heat transport changes. The surface heat flux then responds to that. Unfortunately your criticism is so unspecific that I am not sure what you actually disagree with here? – Stefan ]
Thanks for the article and your work on the paper. I only have some questions if you wish to address them and have the time. Probably does not matter to anything. Sorry as I have autism spectrum issues that picks up inconsistencies too easily or that may not even be important.
Why the equivocation in the paper and article, as in a lack of being definitive? eg
vs TG
“We found that the tipping point where the shutdown becomes inevitable is probably in the next 10 to 20 years or so. That is quite a shocking finding as well and why we have to act really fast in cutting down emissions.” SR
The paper does not state that. nor do you here. Why?
[Response: The Drijfhout et al. paper shows that in Fig. 5. This blog is not about the Drijfhout et al paper, which is a study about CMIP6 model results. This blog is about the observed fingerprint SST pattern. Please understand that one blog article has one topic and doesn’t cover everything. -Stefan]
Why the constant shifting between defining words in the paper, ur note here and TG and IPCC other papers etc?
– abrupt collapse is a tautology eg abrupt AMOC collapse (<30 years)
– collapse = (of a structure) suddenly fall down or give way.; fail suddenly and completely. ; a sudden failure of an institution or undertaking.
– eg An AMOC (Atlantic Meridional Overturning Circulation) "collapse," as defined by the IPCC and related climate science, is a severe disruption or shutdown of this major ocean current system, leading to abrupt shifts in regional weather patterns. IPCC defintion
– paper – In our view the term abrupt is not applicable to the future shutdown of the overturning
– paper – An abrupt AMOC collapse (<30 years) is only triggered by massive freshwater hosing
– or paper – define a northern AMOC shutdown [ used repeatedly ] vs whole of AMOC shutdown/collapse ?
… vs given the over 50 year time scale for a northern AMOC shutdown to unfold
– vs a shutdown of all deep convection areas must be considered a precursor of a transition to a northern AMOC shutdown.
– paper – shutdown … after 2100 following deep mixing collapse
– IF the northern AMOC shutdown happens, does not the whole AMOC conveyor system stop, shutdown / collapse too?
– paper – these transitions to a weak and shallow AMOC are preceded by a mid-21st century collapse of maximum mixed-layer depth in Labrador, Irminger and Nordic Seas. The convection collapse is mainly caused by surface freshening ???
– paper – n abrupt collapse of the AMOC before 2100 was very unlikely
– word use variations – severe disruption, shutdown, northern AMOC shutdown, collapse, abrupt collapse, Amoc collapse, abrupt AMOC collapse, convection collapse , deep-convection collapse, collapse of deep mixing, deep-mixing collapse, completely shuts off, a total collapse , major weakening, its weakest, is weakening.
– paper – abrupt AMOC collapse ( “and heading towards a tipping point” ,include the idea these or usually irreversible?
– if so you are saying we only have 10-20 years before this happens – why no sense of genuine alarm here? it seems incongruous to me.
– what does “not an issue where we can afford to wait until we are certain, ” supposed to mean? is there a definitive conclusion you have drawn, why not state that?
– Act? Act how how? Do what? Why can’t you be totally clear and definitive, quantify what you are saying and make it overtly obvious all at the same? Because really you are sounding incredibly Vague here as to what you actually mean.
— If by Act, you mean to rapidly curtail ghg emissions, urgently, then why cant you and the paper state by how much and by when? Cut global emission my how more than the current levels each year?
— Like please spell it out given the Risk, of an AMOC Tipping point before 2050, what must emission be at in 2030 and 2040 to definitively avoid that Risk occurring?
[Response: It is a risk assessment under uncertainty, so we cannot say what it takes to “definitively” to avoid that risk, and probably that isn’t even possible any more, we can only reduce it. We give specific numbers in the Drijfhout et al. paper: we estimate the AMOC shutdown risk as 70% for the SSP585 emissions scenario, 37% for SSP245 and 25% for SSP126 (i.e. Paris Agreement). The best we can hope for is that the world stays as close to the 1.5°C Paris target as possible. And yes, that requires major increase in commitment by governments; so far they are still massively subsidising fossil fuel use, in the US even banning renewables projects. But how to cut emissions fast is another discussion, not the topic of this blog piece nor is it my expertise. This blog is not even about the AMOC shutdown risk, but rather it is focusing on the question of whether the AMOC has already slowed down and the evidence provided by the SST fingerprint. -Stefan]
— I am simultaneously asking why are you and almost all other Paper / IPCC authors and Media writers always leaving to the casual reader to work this out for ourselves? For us to decide how big the cuts should be by when and if the Risk is even worth the cost of acting?
— eg How do we know if it means reducing current emissions to 10% of current levels by 2040 and than means banning all ICE vehicles and closing down all coal power stations globally in china and india by 2030 or else we blow it?
— Irrespective of the risk Stefan, some things are actually humanly impossible so being crystal clear really matters . Especially for non-scientists lack a PHD in Statistics and Advanced Mathematics and Physics.
My feedback to you is that I am none the wiser after reading your article and the Discussion section of the paper in detail about how important the info here is, or isn’t.
Thank you
This blog is not about the Drijfhout et al paper, which is a study about CMIP6 model results. This blog is about the observed fingerprint SST pattern. Please understand that one blog article has one topic and doesn’t cover everything. -Stefan]
and >> this doesn’t seem to be the fingerprint but about Policy urgency ? –>
“This is not an issue where we can afford to wait until we are certain, or pretend it’s just an academic discussion without major consequences.” “
Thanks for responding S.
Despite your list of examples in the latter part of the ‘blog’ it is certainly well known that the observed fingerprint SST pattern exists and has been represented in multiple studies and media reports for some time. That it represents a slowing of the AMOC, right?
What makes this ‘blog’ (or the paper itself) any different or adds to what ‘we’ already knew? Or is it really only an academic exercise among climate scientists in the same field?? The ipcc consensus” view already sounded clear – even if there’s arguments of how bad it is or specific timing.
Given your reply, you have really lost me here. (Must be my fault. So doesn’t matter)
From an intuitive standpoint, comparing much of this analysis to the rigor of fingerprint matching demonstrates the limitations of the approach. The equivalent of a fingerprint here is a smudged thumb smear — essentially what is being compared to is a trend and that’s about it. None of the matching of grooves and whorls in a conventional fingerprint, which allows a forensics match to be so exacting. Fine if you want to go that route, but I personally wouldn’t put much confidence (or stake my reputation) on the result.
The contrast is in doing the equivalent of a fingerprint pattern match through signal processing of the details of a hi-res sea-level time-series. Consider this: https://pukite.substack.com/p/mean-sea-level-models
This can also argued, but there is much more to chew on, and completely different levels of statistical significance.
But, as they say, feel free to knock yourself out.
PS
Sudden means happening quickly and unexpectedly, while abrupt shares this meaning
Core meaning Happening quickly and unexpectedly. Happening quickly and unexpectedly.
=
Impacts would include a southward shift of the tropical rain belt, weakening of monsoons in Africa and Asia, a drier Europe, significant sea level rise along the American Atlantic coast, and a reduced ability of the North Atlantic to absorb carbon dioxide. It is considered a major climate system tipping point with a high risk of causing widespread, severe climate catastrophe.
Define widespread, severe climate catastrophe. ?
AND note
Characteristics of an AMOC collapse:
Abrupt climate shifts: The most significant consequence is the rapid change in weather patterns and the global water cycle.
Shift in tropical rain belt: A southward shift would alter rainfall for millions of people who rely on it for agriculture.
Weakened monsoons: The summer monsoons in Asia and Africa could weaken, impacting crop production.
Drier Europe: The collapse would likely lead to more severe winter droughts and a general drying trend in Europe.
Increased sea level rise: The American Atlantic coast would experience substantial additional sea level rise.
Reduced ocean carbon uptake: The North Atlantic’s capacity to absorb carbon dioxide would be greatly reduced.
Ecosystem damage: The collapse would lead to greatly reduced oxygen supply to the deep ocean and potential ecosystem collapse in the northern Atlantic.
Why it is a major concern:
Tipping point: The AMOC is considered a major tipping element in the climate system, meaning it could cross a threshold and undergo a large, possibly irreversible change.
Precautionary principle: Due to the potential for catastrophic impacts, scientists stress that it is a risk that must be avoided “at all costs”.
from https://www.google.com/search?q=ipcc+definition+of+amoc+collapse&oq=ipcc+definition+of+amoc+collapse&gs_lcrp=EgZjaHJvbWUyBggAEEUYOTIHCAEQIRigAdIBCTEzMTYyajBqN6gCCLACAQ&sourceid=chrome&ie=UTF-8
HOW MUCH must current global / USA or EU or China all/CO2 emissions be rapidly cut from current 2025 level by 2040-2050 that would ensure the above did not occur?
Give us the Goal for all our nations’ politicians and corporate boards to Hit – What is it – be specific not vague please?
Thankyou.
and previously discussed on rc
Is the AMOC not collapsing?
Here we show that the AMOC is resilient to extreme greenhouse gas and North Atlantic freshwater forcings across 34 climate models. Upwelling in the Southern Ocean, driven by persistent Southern Ocean winds, sustains a weakened AMOC in all cases, preventing its complete collapse.
Feb 26, 2025
Continued Atlantic overturning circulation even under climate …
Nature
https://www.nature.com › articles
?
Is the AMOC shutting down?
“Even in some intermediate and low-emission scenarios, the Amoc slows drastically by 2100 and completely shuts off thereafter. That shows the shutdown risk is more serious than many people realise.”
Aug 29, 2025
People can only realize what they have already ben told by the scientists working on this. Seems a meaningless redundant thing to say.
“And as a final reminder: if there is a risk that the AMOC is weakening and heading towards a tipping point, we need to act on that (just like with other major risks).”
Stefan.. what specific actions do you suggest should be taken to address this AMOC weakening risk? Something practical and realistic.
[Response: Limit global warming to well below 2°C and make a very serious effort to limit it to 1.5°C. Basically what all countries agreed to do already ten years ago in the Paris Accord. That should be realistic, if everyone has agreed to do it. -Stefan]
Stefan Ok. But what can be done today to limit the risk of global warming, especially if we don”t know what the starting temperature was? In other words,,,1.5°C added to what value in the past. We may have already gone past it. And taking massive amounts of CO2 out of the atmosphere is impractical because not enough could be stored geologically to affect the climate. We are already well above 400 ppm.
KT: “…what can be done today to limit the risk of global warming…”
MS: Stop powering automobiles with fossil fuels. Stop powering other vehicles with fossil fuels as much as possible.. Stop generating electricity by burning fossil fuels. Stop deforestation, and increase reforestation.
KT: But what can be done today to limit the risk of global warming, especially if we don”t know what the starting temperature was? In other words,,,1.5°C added to what value in the past.
BPL: The preindustrial average was likely 286.8 K (Levenson 2021).
Ref:
Levenson, B.P. 2021. Habitable zones with an Earth climate history model. Planetary and Space Science 206, 105318.
The IPCC’s Special Report on 1.5 °C of warming projected that coral reefs could decline by 70–90% if the planet warms by just +1.5 °C GMST anomaly. This is because warming leads to more frequent and severe coral bleaching events due to ocean heat, and ocean acidification from absorbed CO₂ weakens coral structures and hinders their growth. At a +2.0 °C GMST anomaly warming scenario, the decline could be nearly total (99%).
The daily atmospheric CO₂ concentration at the NOAA Mauna Loa Observatory on 7 Mar 2025 was 430.60 ppm. This is the first daily mean reading above 430 ppm ever directly recorded at this location. The atmospheric CO₂ concentration has not been this high since the Pliocene Epoch, 5.33 to 2.58 million years ago. Global sea level was about 25 m higher then, compared with current sea level.
The UN Sustainable Development Solutions Network (SDSN) published on 3 Nov 2023 the YouTube video titled An Intimate Conversation with Leading Climate Scientists To Discuss New Research on Global Warming, duration 1:12:23. James Hansen said:
“The 1.5 degree limit is deader than a doornail, and the 2 degree limit can be rescued only with the help of purposeful actions to effect Earth’s Energy Balance. We will need to cool off Earth to save our coastlines, coastal cities worldwide, and lowlands, while also addressing the other problems caused by global warming.”
https://youtu.be/NXDWpBlPCY8?t=1023
The Healthy Planet Action Coalition (HPAC) is bringing together scientists, policymakers, and concerned citizens for a global online conference to build awareness about why temperatures are accelerating, what this means for humanity, and what to do about it.
Over two days, 15 – 16 Oct 2025, HPAC will host two sessions of circa 2½ hours duration per day of discussion. Starting time each day is at 12:30pm Greenwich Mean Time (GMT).
Programme details at: https://www.preventing2degrees.org/program
This online conference is open to all.
Geoff Miell: “The atmospheric CO₂ concentration has not been this high since the Pliocene Epoch, 5.33 to 2.58 million years ago.” Global sea level was about 25 m higher then, compared with current sea level [boldfacing as in the original – P.]
… and how is this information relevant to the subject of this thread: “High-resolution ‘fingerprint’ images reveal a weakening Atlantic Ocean circulation (AMOC)” ???
The ocean circulation was VERY DIFFERENT in the Pliocene – there wasn’t probably even AMOC in the current configuration, if any at all – not because of 400+ ppm CO2, but because of geology – the Panama isthmus was likely not completed yet – so there was still exchange of water between Caribbean and the adjacent Pacific. As a result, the future Gulfstream was weaker and the North Atlantic didn’t get salty enough, so the water near Greenland didn’t get dense enough to sink and drive AMOC.
Heck, your 25m SLR Pliocene infomercial is irrelevant even to the current AGW – it took many 1,000s if not many 10,000s of years to approach the equilibrium then – not the time-scale of the Paris Accord, or IPCC projections till 2100.
So stop sealioning, stop clogging the technical scientific threads with your, irrelevant, repetitive post that often have been addressed before. Take your other Stooge, Mo, and go and carpet bomb with your posts those who deserve it – those who deny AGW on deniers blogs or in comment sections of newspapers.
Piotr – “and how is this information relevant to the subject of this thread:”
I’d suggest it’s relevant to Stefan’s response:
https://www.realclimate.org/index.php/archives/2025/10/high-resolution-fingerprint-images-reveal-a-weakening-atlantic-ocean-circulation-amoc/#comment-840625
The “1.5 degree limit is deader than a doornail” and on current warming trajectory I’d suggest the 2 degree limit is looking increasingly unachievable too. It seems this is inconvenient for your ideological narratives, hence the apparent continued personal attacks from you.
Piotr – “So stop sealioning, stop clogging the technical scientific threads with your, irrelevant, repetitive post that often have been addressed before.”
It seems to me you are now apparently so enraged at the sight of any of my comments here you have become so venomous with your personal attacks.
Isn’t it about time the moderators reign in comments with personal attacks?
Ken Towe ASKS
— what specific actions do you suggest should be taken to address this AMOC weakening risk? Something practical and realistic.
(non) Response: From Stefan
A temperature measurement is a goal. It is not an Action
The Paris Accord is not an Action either,
Besides which, the Paris Accord is dead as a door nail.
While the current science on the weakening of the AMOC it breaching a an irreversible tipping point on 10-20 years goes far beyond any science contained in the SR15 or the AR6 or that which underpinned the Paris Accord.
Simple really.
There’s reality, and then there is everything else.
More to the point, remember the Titan whose dead owner talked much like our various “experts” spouting about how more he knew about deep ocean submersible engineering more than actual experts.
And as well, left it outside without so much as a plastic tarp in Newfoundland’s lengthy winter-spring freeze-thaw cycles which routinely flake the bark right off trees and plants every Jan-May and cause great amounts of infrastructure damage.
AI does not make you an “expert” since LLM’s sample everything out there, not merely qualified experts. Asking ChatGPT5 about this results in the following:
——————-
Q: How do LLMs discriminate climate propaganda from actual climate science in their training?
A: Great question—this gets to the heart of how large language models (LLMs) handle contested or politicized topics like climate change. The short answer is: they don’t inherently “know” what’s propaganda and what’s science.
…
Challenges
Subtle Propaganda: Not all misinformation is blatant. Some propaganda uses scientific-sounding language, cherry-picked data, or misleading framing, which makes it harder for models to filter out.
Evolving Narratives: Climate misinformation adapts quickly (e.g., shifting from outright denial to “delay” narratives), so models need continuous updates.
General-Purpose vs. Specialized Models: General LLMs (like GPT or LLaMA) are less reliable at spotting climate misinformation than models explicitly trained on climate science.
————————–
Note how well ChatGPT5 has you pegged. Pretty smart system, I’d say.
The way I interpret “tipping point”.
We’ve been in a more or less steady, but gradually declining, state since the beginning of the Industrial Revolution, as if in a vehicle with sketchy brakes (no real thought to stopping a climate change + or – if our increasing population should trigger one (and since it’s an increasing population it’s likely to be + *) bouncing along a dirt road, but, again, on a slightly downward grade.
It’s getting a little warmer as we go, though, and gradually we’re picking up speed as the grade continues to decline. Hmm. There’s a cliff down there. Aaa – it’s off a ways. Whatever. We still have the ability to stop our vehicle if we want to (but it is getting harder), and anyway, heck, we’re distracted by other things. The next generation will deal with it.
After a while, though, as the road continues to descend and we to pick up a bit more speed, there is before us a point where we won’t be able to stop. It’s physics. A tipping point. That point may vary a bit by the imperfect grade of the road we are on and the effort we exert (if we really wanted to), but our ability stop ourselves, that window, is rapidly closing.
And remember that cliff.
We have people with us with foresight (mathematicians) that can see that we’d better slow and reverse course while we still can, and have been warning us to stop. That if we don’t, momentum will mean that soon we won’t be able to. But again, we’re distracted.
There are others, too, that poo-poo their warning because they notice that there are occasional sections on this descending dirt road where the momentary path is up. And that’s true! But the general trend is down, which they ignore.
What will we do?
Remember the Titanic.
* Since we have to power that increasing population.
My comment above should be here.
Powering the increasing population is the basic problem, especially when it comes to world-wide transportation. There are no viable alternatives to fossil fuels, regardless of trends and tipping points.
The correlation between population (the sum total of all human activities) and Mauna Loa CO2 is, and has been, almost perfect. As POGO said on the first Earth Day, “We have met the enemy and he is us.”
Adaptations, not mitigations is a viable solution.
fwiw — Adaptations, not mitigations is THE ONLY viable solution NOW. .
That or simply letting it go, and preparing for a post-apocalypse world in 10-30 years from now depending on where you live and how you live.
That is what the science tells everyone who is mature, knowledgeable, and awake, who uses reason and data and logic and well versed in Human History and Cognitive Science and Anthropology.
It is NOT a climate science issue anymore. It never was.
MY: Adaptations, not mitigations is THE ONLY viable solution NOW.
BPL: Garbage. Every bit of mitigation prevents the situation from getting even worse than it would have been.
I’m beginning to think you’re shilling for the oil companies.
fwiw — Adaptations, not mitigations is THE ONLY viable solution NOW. .
Ray can correct me if I’m wrong but, no, what we need is both adaptation AND mitigation. From what I can tell it goes all the way back to the 2001 Third Assessment Report. Summarizing,
It is intended to assist governments, individually and collectively, in formulating appropriate adaptation and mitigation responses to the threat of human-induced climate change.
https://wedocs.unep.org/handle/20.500.11822/8294
Mitigationists have long maintained that we need BOTH mitigation and adaptation.
https://www2.cifor.org/cobam/background/adaptation-and-mitigation/
“ The magnitude and rate of climate change and associated risks depend strongly on near-term mitigation and adaptation actions, and projected adverse impacts and related losses and damages escalate with every increment of global warming (very high confidence).
https://www.ipcc.ch/report/ar6/wg2/chapter/summary-for-policymakers/
https://www.nasa.gov/earth-and-climate/nasa-drought-research-shows-value-of-both-climate-mitigation-and-adaptation/ and lots of other sites.
Adaptationists, though, have consistently said, as you just did, or strongly implied, that we ONLY need adaptation.
The growing consensus on climate change policies is that adaptation will protect present and future generations from climate-sensitive risks far more than efforts to restrict CO 2 emissions.
https://web.archive.org/web/20070929091359/http://www.ncpa.org/pub/ba/ba527/index.html
So, hmm, let the ff companies continue to belch out air pollution with its known heating effects and just make the world adapt to the increasingly warming planet (this ensures that profits are maintained for the very few). Don’t try to actually STOP, or MITIGATE the effects. See the difference?
Another example off the top of my head, (there are lots), let’s say you have a leak of water from your water pipes and because your drain is overwhelmed now have a stream of water coming out of your bathtub which is going to eventually flood the house. What do you do? Fix the leak or keep putting bowls down to catch it?
So, yes, as our vehicle continues its bouncing descent and increases speed we will find that we need to turn on the air conditioning at some point (adapt). That will (temporarily) help us humans. *whew, it’s getting hot in here.* wipes brow, opens shirt But it doesn’t halt our downward descent in the slightest.
OH, and sorry rest of the world!
Mo : Adaptations, not mitigations is THE ONLY viable solution NOW.
BPL: Garbage. Every bit of mitigation prevents the situation from getting even worse than it would have been. I’m beginning to think you’re shilling for the oil companies.
and if is not – then he is not a piad shill then he is their Lenin’s “useful idiot” – somebody so blinded by the need to gratify his ego that he ends up in bed with the deniers, Russia, and oil oligarchs, sharing both their methods and conclusions:
Methods
– the all or nothing fallacy – either we stop CO2 now, or there is no point in ANY mitigation and let’s do business as usual. The manipulation here is pretending that the world (and the costs of adaptations at 450ppm) won’t be any worse than those 65o or 850 ppm
– attempts to discredit climate scientists saying otherwise
– cripple their ability to communicate it to the public by sending sealioning clones:
“Sealioning is a type of trolling or harassment that consists of pursuing people with relentless requests for evidence, often tangential or previously addressed. It may take the form of “incessant, bad-faith invitations to engage in debate” and has been likened to a denial-of-service attack targeted at human beings”
Conclusion – once you flooded the field with the all or nothing rhetorics: that it makes no difference whether we are at 450 or 850 ppm – then why bother – let’s burn as much FFs as we want – it makes no difference to the climate, right?
By their fruits, not the declarations about themselves, you shall know them…
Barton Paul Levenson says
17 Oct 2025 at 8:52 AM
MY: Adaptations, not mitigations is THE ONLY viable solution NOW.
BPL: Garbage. Every bit of mitigation prevents the situation from getting even worse than it would have been.
I’m beginning to think you’re shilling for the oil companies.
MY No doubt because you’re not intelligent enough. Fantasies and lies work better for people like you.
Ron R. says
17 Oct 2025 at 2:04 PM
fwiw — Adaptations, not mitigations is THE ONLY viable solution NOW. .
Adaptationists, though, have consistently said, as you just did, or strongly implied, that we ONLY need adaptation.
The growing consensus on climate change policies is that adaptation will protect present and future generations from climate-sensitive risks far more than efforts to restrict CO 2 emissions.
https://web.archive.org/web/20070929091359/http://www.ncpa.org/pub/ba/ba527/index.html
MY I do not care what some people you call “adapationists” said in the distant past. I am NOT them.
I am making statement NOW, today, about today and the reality about today.
If you do not like that, or disagree fine. But just leave the past behind and deal with NOW.
eg there is no mitigation large enough extensive enough to make a difference going forward. The Paris plans are a joke, the emissions keep rising, they are NOT going down and not going to go down. So while there is actually resources and energy capacity NOW is the time to implement what ADAPTIONS can be made and or head for the hills. There is nothing stopping this train.
Certainly not anyone on or associated with RealClimate or even the IPCC for that matter.
The whole thing has become a joke on the world’s population. No one is n charge, it is an out of control train heading for a bridge that is out …. be real.
What mitigation there is and what increase in that in the near and distant future is minimal …. while Tipping Points begin to triggered and Boundary crossings become permanent.
Deniers and the Liars always lose.
I’m sorry, Ken, but from the point of view of someone who does risk analysis for a living this is kind of a dumb thing to say. Adaptation IS a mitigation, and mitigations require an understanding of just how bad things might get. There are scenarios where adaptation would not be possible and where any economically feasible mitigation would be overwhelmed.
I think what you meant to say is “I don’t want to think about it, so it’s someone else’s problem (namely my progeny–g’luck, suckers!)”.
Mo Yunus says
18 OCT 2025 AT 8:00 PM
First, can you delineate your quotes so that it doesn’t look like I made the adaptationist only quote following my own please?
Then,
“ Adaptations, not mitigations is THE ONLY viable solution NOW.
Then a bit later,
“MY I do not care what some people you call “adapationists” said in the distant past. I am NOT them.
So, hmm, are you an adaptationist … or not?
“the emissions keep rising, they are NOT going down and not going to go down””
“ eg there is no mitigation large enough extensive enough to make a difference going forward.”
Etc. Etc
So, again, hmm, are you saying that because things look bad we should just abandon mitigation strategies, or trying to fix the leak, because too much water has already come out of the bath tub, and just redouble our efforts in putting bowls or towels down to catch the water that spills out over the edge? How much WORSE would things be if we hadn’t made the changes we have so far?
RL, “You might as well claim we can’t light houses without whale oil. Your objections are rooted in the past century!”
My, “ Do better, deal in evidence or be silent,””
Huh? Um, just he did, in analogy form. I thought it was a great comparison!
Really, any comparison will do. Here’s another one. A bunch of people are in a car with the windows up. Exhaust from a leaky system is slowly filtering in. Do we, A, just open the windows a bit and drive on because, heck, we’re already on the road (adapt) or B. get out and actually FIX the issue first?
Do we just adapt (pun intended) a philosophy that we will henceforth fix, or treat ONLY the effects of issues and not their causes? How backwards is that? I must not be understanding you correctly. What do you mean?
Again, this is not an either OR situation! How many times must this be emphasized! The more we use clean alternatives the less we’re dependent on fossil fuels. And we’re at a point where we need to move vigorously in that direction. The longer we wait the hotter the world gets. It’s that simple! That’s what the mathematicians have been warning us of for decades. It’s our choice. It’s our world. Do we let a few die-hard fat-cats wreck the earth for their temporary profits or do we take it back? C’mon.
Dirty fossil fuels, coal and oil powered the world up until now. Okay. But it’s warming it. Don’t you think it’s time to find something better, cleaner, less damaging to power our future? We’re heating the world for God’s sakes! Time to move on! To innovate! The Model A days are over!
https://www.niskanencenter.org/what-changed-my-mind-about-climate-change/
https://umaincertaantropologia.org/2012/07/30/the-conversion-of-a-climate-change-skeptic-n-y-times/
https://www.space.com/40640-nasa-chief-bridenstine-climate-change.html
Etc
Ron R.: https://www.niskanencenter.org/what-changed-my-mind-about-climate-change/
Succinct comment, Ron. The Niskanen Center, y’all, is the ‘moderate’ (i.e. consequentialist) libertarian think tank founded by ex-professional climate-disinformer Jerry Taylor, after he made a profound conversion to climate realism.
Jerry Taylor, The Alternative to Ideology (https://www.niskanencenter.org/the-alternative-to-ideology): Ideology = Motivated Cognition
Taylor’s tale is cautionary: he was a VP at the plutocratic Cato Institute and a smirking denialist (https://en.wikipedia.org/wiki/Jerry_Taylor), until a right-glibertarian friend of his pointed out who the actual winners and losers are with AGW. At the time, he told an interviewer (https://theintercept.com/2017/04/28/how-a-professional-climate-change-denier-discovered-the-lies-and-decided-to-fight-for-science/):
SL: How do you feel about the work you did in those years?
JT: I regret a lot of it. I wish I had taken more care and done more due diligence on the arguments I had been forwarding. I also introduced one of my brothers, James Taylor, to the folks at the Heartland Institute. Heartland’s rise to dominate market share in climate denialism largely occurred under my brother. Boy do I regret that.
Whew. That has to be hard to live with! Niskanen may have been Jerry’s penance project, but it’s still lobbying for collective intervention after he had to resign when, according to his Wikipedia entry, “the board became aware of him being charged with domestic violence against his wife”. Not that I condone domestic violence, but I’m pretty sure he regrets that, too! IMHO, Jerry Taylor is a tragic figure. The ancient Greeks would say he was doomed by the whims of capricious gods, as humanity seems to be in the tragedy of the climate commons. We know better today: any atonement for past denial is within the self, and in our collective wills. In yet another guy’s better words than mine:
William Shakespeare: The fault, dear Brutus, is not in our stars, / But in ourselves…
Mal Adapted
Good catch!
So obviously wrong. There are excellent alternatives to fossil fuels already for 90-95% of their current use. Solar and wind electricity generation, coupled with batteries and enhanced transmission, are already the most cost-effective source of electricity. Battery electric vehicles are near price parity with ICE vehicles, with much lower costs of operation.
Excellent discussion, thanks. I especially appreciate the analysis/dissection of the counter-arguments.
Bonjour, petite question : que faites vous des études qui contredisent cette affirmation sur l’approche d’un point de bascule ?
Jens Terhaar et al. Nature (2025)
J.A. Baker et al. Nature (2025)
Alex Morrison, phys.org (2025)
et vous mêmes qui doutiez en janvier 2025, en parlant même de “dérapages médiatiques” ?
Vous n’avez pa lu l’article, ni les précédents (https://www.realclimate.org/index.php/archives/2025/02/how-will-media-report-on-this-new-amoc-study/).
S’il vous plait, faites l’effort de lire l’intégralité des articles proposés sur le sujet ici même et de poser vos questions en anglais… Cela ne fait pas très sérieux sur un site anglophone…
Your data and arguments, Stefan, seem convincing to me. This is just another field of climate research, where all indicators and developments are all moving faster in the exact wrong direction, but as you show here, as usual you have some studies which are trying to tell us that we don’t need to worry about anything at all. There will of course always be plenty of money for that kind of “science”. It comes as no surprise to me, that many of these studies are coming from research financed here in Norway. (Norway is a petro-state, where the broad center-right political “spectrum” (if you can call it that) have always been what I call climate ignorant, but until recently was this at least hiding behind different kinds of greenwashing of business as extremely usual. By now, as is surely easy to see behind giving the Nobel peace price to a staunch venezuelan admirer of Donald Trump (!), these “green” symbolisms are being left behind, as the “center” drifts further to the right and become trumpism light, if not something more sinister. Cameleonic politics, well-known from the 1930’s).
What I want to ask you here, is if you know when we can expect the end of the peer-reviewing process of your and Grant Foster’s paper about the acceleration of global warming ( https://www.researchsquare.com/article/rs-6079807/v1 )?
I mean the conclusions in that paper – that we have already passed the 1,5 degree – limit and will probably pass the 2,0 degree limit in just twelwe years from now, urgently needs to be brought to the attention of the broader public. Preferably well before the COP30 starts in Brazil.
This is so urgent, because it seems that the socalled “leading” (what are they leading?!) politicians overall have now “chosen” that they simply don’t care anymore. They just “go with the flow”…
They only listen to the fossil fuel lobby which have by now launched a very succesfull offensive against any effective climate policy. The main force behind this is as usual “the economy” as seen dogmatically by the reaganomists (the oligarchic, monopolistic interests of big capital, being promoted by the neoliberal dogmatism in “Project 2025” etc.). This offensive is being led by the by now openly oligarchic near-dictatorships in the US, Russia, the feudal arabic regimes etc. They are being portrayed as fighting each other, but mainly they aren’t at all, they are just fighting over who gets to use the fossil fuels, rare earth materials etc.
The main fossil fuel offensive aiming to destroy any remains of climate policies is being led by the Trump regime, which is now preparing to take over the venezuelan oil reserves (which are the greatest remaining in the world) through the well-known method of military provocation, intervention/invasion and regime change. It dates back to the “good old days” of banana republic regimes in Latin America, and could be called Bay of Pigs 2.0 so to speak. Generally the world order is being pushed back to the imperialism of the late nineteenth and the first fifty years of the twentieth century.
Of course the result of this will very probably be that the capitalist full-scale CO2-experiment with the global climate system will move beyond the pale. While there maybe is no “point of no return”, there surely are tipping points now soon being passed, and with growing speed. The consequences will be very hard to ignore, but we can be sure that all the usual suspects will quadruple their efforts to try exactly that. They are already in full swing, aided and abaited by the augmented propaganda-powers of artificial “intellegence” etc., which by the way are contributing heavily to the spiralling use of fossil fuels…
Against this it will surely not suffice with even more slogans about “optimism”, no more chamberlainisms. We have had more than enough of that, in fact we had that more than twenty years ago.
*What we need now is the revolutionary, stubborn spirit of intransigent resistance shown by Churchill in 1940. The blunt, clear and unforgiving presentation of the simple facts about what is happening to our future climate and the global ecosystems, if the politics aren’t radically changed, and immidiatly*.
We can’t continue to let the politicians speak about global heating as if it were a minor and cosy problem like the weather in the summer holidays next year. Enough stupidity and ignorance is enough. They will try to crush the science, that has for long been rather obvious, even if many still prefer to not see it, speak comfortably about climate “adjustment” (as if that were possible without catastrophes, while continuing business as extremely usual) etc.
The main problem is of course this, mentioned in the famous quote by Upton Sinclair: “It is difficult to get a man to understand something when his salary depends on his not understanding it”. In a more blunt wording *the hidden capitalist mechanism of totalitarianism* (first and foremost being practised in the state capitalism of stalinist Russia – later China etc. – and all the fascist dictatorships. It is obviously an illusion that capitalism inevitably leads to democracy. Historically seen that isn’t true. “Communism” in fact has been the “eastern” and undemocratic road to capitalism, and fossil capitalism in fact proves to be at the core of all utopian expectations about endless growth of the “productive forces”, consumption etc. In the longer run the fossil wealth and “progress” seems to be ending as a very short-lived “adventure” of burning “old sunshine” – fossilized ancient solar energy – after just a few hundred years, resulting in another big global catastrophic event of extinction of many species, and maybe all humans).
This mentioned by Upton Sinclair is the main reason why the fight is now more and more being led by retired scientists…
*What we need now is the revolutionary, stubborn spirit of intransigent resistance shown by Churchill in 1940. The blunt, clear and unforgiving presentation of the simple facts about what is happening to our future climate and the global ecosystems, if the politics aren’t radically changed, and immidiatly*.
If the politics were to be radically changed immediately, how would that affect future climates and your forecast of mass extinctions? In other words, what should be done to “fight” a changing climate other than more rhetoric?
KT: “…what should be done to “fight” a changing climate other than more rhetoric?”
MS: Stop powering automobiles with fossil fuels. Stop powering other vehicles with fossil fuels as much as possible.. Stop generating electricity by burning fossil fuels. Stop deforestation, and increase reforestation.
MS: Stop powering automobiles with fossil fuels. Stop powering other vehicles with fossil fuels as much as possible.. Stop generating electricity by burning fossil fuels. Stop deforestation, and increase reforestation.
BPL: Hear, hear! That’s it in a nutshell.
Martin… of course we can’t do that. How would we be able to continue the transition to renewables and EVs…or even feed people and deliver all of the materials needed? Reforestation takes conventional vehicles too. So does the production of corn and sugar cane for biofuels.
KT: of course we can’t do that…
MS: Ken, we ARE doing that….
Renewables have overtaken coal as the world’s biggest source of electricity.
https://www.bbc.com/news/articles/cx2rz08en2po
In 2024, 89% of the new cars sold in Norway were electric.
https://evmagazine.com/top10/top-10-electric-construction-vehicles
And here are photos of the top 10 electric construction vehicles:
https://evmagazine.com/top10/top-10-electric-construction-vehicles
We don’t have to eliminate all conventional vehicles, Ken.
Ken Towe “How would we be able to continue the transition to renewables and EVs…or even feed people and deliver all of the materials needed?”
And with that – we have arrived : the one and only reason for Ken the Denier to post in this, or ANY, discussion, is to lead to his challenged in dozens(?) hundreds(?) of previous threads claim that we couldn’t possibly live without the big, beautiful, fossil fuels. To repeat that – ANY subject of discussion would do:
– Stefan: “High-resolution ‘fingerprint’ images reveal a weakening Atlantic Ocean circulation (AMOC)”
– Ken: How can we possibly live without the big, beautiful fossil fuels?
– Gavin about the dangers of the mechanism-free extrapolation of the sea-ice trend
– Ken: How can we possibly live without the big, beautiful, fossil fuels?
– BPL, say: “2+2=4”
– Ken: how can we possibly live without the big, beautiful, tremendous, fossil fuels?
– Barbie: “I do not have a vagina and Ken does not have a penis. We have no genitals!!!”
– Ken: I have ALL the genitals I need – the big, beautiful fossil fuels! Drill, baby, drill!
Um, actually, no. All of those tasks can be accomplished with electric vehicles or alternate fuel vehicles. Brazil has been producing alcohol from sugar cane for decades.
You might as well claim we can’t light houses without whale oil. Your objections are rooted in the past century!
Ray Ladbury says
15 Oct 2025 at 2:47 PM
You might as well claim we can’t light houses without whale oil. Your objections are rooted in the past century!
Not so. Your excuses are rooted in past century thinking. Do better, deal in evidence or be silent, you’re not helping.
Mind you it’s beyond help, so knock yourself imagining you got it all sussed out while it lasts.
OR
Wait until the AR7 and CMIP7 comes out, that’ll fix everything quick smart. Packed with totally undeniable evidence. :-)
MY: Do better, deal in evidence or be silent, you’re not helping.
BPL: Ray does deal in evidence. You deal in insults and condescension. I prefer Ray.
Reply to Martin Smith
What should be done to “STOP” those things other than more rhetoric, here or elsewhere?
Tell us what Actions will lead to urgently Stopping All those things — that stops the AMOC crossing the irreversible Tipping Point in 10-20 years that Stefan’s great science paper is telling us is coming?
Or do you suggest we wait until 2028/29 for the next CMIP7 and the IPCCCAR7 to arrive to tell us what to do? Or the next COP meeting [perhaps? Or the White House even? The UN Secretary General maybe?
The return of the Messiah and the Mahdi possibly? :-)
Mo, see my replies to Ken Towe..
Martin Smith says
15 Oct 2025 at 1:09 AM
Mo, see my replies to Ken Towe..
Thanks for the reply.
None of those items in your reply to Ken address my questions.
I will put you down as another one who said — I don’t know,
MY: “Tell us what Actions will lead to urgently Stopping All those things — that stops the AMOC crossing the irreversible Tipping Point in 10-20 years that Stefan’s great science paper is telling us is coming?”
MY: “None of those items in your reply to Ken address my questions.”
Now I see you must have meant “immediately,” when you wrote “urgently Stopping.” In that case, I think you are attempting to refute something that has not been asserted. No one has asserted that “All those things — that stops the AMOC crossing the irreversible Tipping Point in 10-20 years” can be stopped quickly. We can stop burning fossil fuels, which will stop adding CO2 to the atmosphere, but that process, which has begun, will take decades.
Thank you for reminding us that one observation made at the time of the first IPCC Assessment Report: remains current:
“The salvation of the world affords an enchanting pretext for those predisposed to societal intervention”
RS: “The salvation of the world affords an enchanting pretext for those predisposed to societal intervention”
BPL: Arguing motive assumes the opponent has already been proven wrong. Good luck with that.
In Re to Russell Seitz, 13 Oct 2025 at 3:45 PM,
https://www.realclimate.org/index.php/archives/2025/10/high-resolution-fingerprint-images-reveal-a-weakening-atlantic-ocean-circulation-amoc/#comment-840678
Dear Dr. Seitz,
I find your quotation — “The salvation of the world affords an enchanting pretext for those predisposed to societal intervention” — both memorable and intriguing. I have sought for its source and finally found out that it comes from your article “A War Against Fire,” published in The National Interest in April 1990. Thank you for republishing it on your blog
https://vvattsupwiththat.blogspot.com/2015/04/a-war-against-fire.html ,
otherwise, the article would have likely remained hidden in paywalled archives.
Reading it raised on my side a few questions.
1) It appears that development of electricity production from renewable sources made them competitive (in electricity production) with fossil fuels, while electricity production from nuclear energy stalled technically on the level achieved 50 years ago. There is still an unresolved problem with large scale electricity storage, however, cheap electricity from renewables seems to represent at least a clear incentive to deal therewith.
Would you, in this new situation, change your recommendation for energy policies from spring 1990?
2) In discussions with Czech climate activists that consider themselves as climate scientists, I found out that they still believe that latent heat flux merely transports heat from warmer parts of Earth surface to colder ones. In the present disputes on this forum, your pre-industrial example of deforestation drying effect on island climate seems to be still considered as a local effect that can be neglected, because “water is mere feedback“. Global mean surface temperature rise appears to be considered as the sole thing that matters, because everything else can be derived therefrom. In this perspective, the sole anthropogenic interference with global climate consists in anthropogenic emissions of non-condensing greenhouse gases, and trees have to be considered merely as dark spots decreasing Earth albedo and a “carbon pool”.
Have you expected 35 years ago that in year 2025, public discourse with respect to climate complexity will look like this?
Many thanks in advance for a comment and best regards
Tomáš
In Re to Russell Seitz, 16 Oct 2025 at 5:20 PM,
https://www.realclimate.org/index.php/archives/2025/10/high-resolution-fingerprint-images-reveal-a-weakening-atlantic-ocean-circulation-amoc/#comment-840678
Dear Dr. Seitz,
On 16 Oct 2025 at 5:20 PM,
https://www.realclimate.org/index.php/archives/2025/10/high-resolution-fingerprint-images-reveal-a-weakening-atlantic-ocean-circulation-amoc/#comment-840845 ,
I asked if you could compare your hopes, expectations and fears at the time of your article from the year 1990 with the successes and failures of the efforts towards the “salvation of the world” that occurred during the 35 years since then.
I still think that your retrospective could be inspiring.
Would you mind commenting?
Best regards
Tomáš
Have heard hints only of impact on EASTERN Mediterranean of/when AMOC collapse. Given that area has already become the hot spot of Europe, and the complexity of Med current systems, it sees possible. Have you any info/thoughts on this? Thanks.
Stefan, I have a suggestion about the presentation of your analysis.
Fig 1 and 2 are very confusing, and seem distorted. If you want “the public”, including people with a science background, to relate, you need to provide better graphics with some reference points and information.
Maybe I’m just getting old, but I’m quite familiar with the fact of increased temps off the US coast, and the coastline itself, but it still took me several headshakes to recognize the actual locations.
I’m pretty sure there are a lot of student types around with the knowledge and skills to create a look more at the level of what the competition is doing. Probably work cheap or even for free.
[Response: Are you talking about the map projection? That is a deliberate choice, the view from space from a large distance from above the ‘cold blob’. It focuses gently on the central area of concern without distorting the size of areas too much. A lot of the maps you otherwise see are extremely far from equal area and heavily distorted (e.g. Greenland larger than India…) – but admittedly look more familiar to many people. Is that your point? -Stefan]
Yes, and I think that when you say “area of concern”, that illustrates that the focus of the specialist scientist is often not congruent with what concerns, or would capture the attention of, everyone else.
I would suggest perhaps breaking up the image to allow for zooming in on occupied coastal regions; if you have a high-resolution model and high-resolution data, why not offer that to the people who may be affected?
Stephan, disregard our Master of Communication zebra, the figures are great – I’ll take limiting the distortion by the projection over the confusion visited upon the US-centric US “public”any day. The next thing they will demand the conversion of the temps to Fahrenheit, volumes of AMOC to fathoms^3, and the solar radiation to, I don’t know, footcandles ?
And after you do all that, it will turn out that the American “public” don’t care sh*t anyway. The way everyone working on the Kyoto Protocol bent over backward to accommodate American interests, only to see Americans to never to ratify it. They same for the Paris Treaty – except this time instead of Congress, they voted in Trump.
I agree with Piotr – love the maps / choice of projection. :) [layperson/non-expert here].
David: ” But that’s not what I took from Zebra’s comment”
David, you may be taking frpm Zebra something he didn’t offer:
His ONLY specific, actionable, criticism was that, the maps were “very confusing and seem DISTORTED” making him “ take several headshakes to recognize the actual locations“. This can ONLY refer to the map projection.
The rest of zebra’s post is his USUAL fare: non-specific lecturing of others, preferably, the climate scientists, on their sub-par communications skills, apparently lower than even those of a lowly student doing it on the side:
z: “ there are a lot of student types around with the knowledge and skills to create a look more at the level of what the competition is doing. Probably work cheap or even for free“).
And Stefan is criticized for using a more accurate projection, instead of the more distorted but more familiar to the US general public – by the VERY SAME zebra who … practices the opposite:
zebra have just dressed down others for using Temperature (GMST) INSTEAD of his Earth Energy Imbalance (EEI) – EVEN THOUGH the public in US immediately and intuitively understands the concept of air temperature. Something we can’t say about EEI.
Do what I preach, not what I do …
====
^* (not mentioning Temp. being MUCH easier to measure and having orders of magnitude MORE MEASUREMENTS than EEI, particularly from the past.).
Yes, the maps provided were fine for me, a layman. But that’s not what I took from Zebra’s comment/suggestion. I might be in error, but to me, Z was getting at something beyond the graphics in this particular post.
Stefan
Between now and the end of the century what weather impacts would we expect if it was to continue weakening at the same rate (BAU scenario)?
Just a quick heads-up for readers here, because this exchange points to a much deeper issue that’s been hurting public trust in climate science for decades.
Stefan has said — and the Drijfhout et al. paper supports — that the AMOC has already weakened and that the tipping point beyond which shutdown becomes irreversible may be just 10–20 years away. That’s an extraordinary claim. Yet when readers ask the obvious follow-up — what level of emissions cuts are needed, by when, to avoid that outcome? — the answers revert to model uncertainty, scenario codes, or “not my expertise.”
Formally that’s fine, but to the public it feels evasive — like the system can describe the risk but not speak plainly about what must be done. And this communication gap has been there for 35 years. In my opinion, that pattern has done real damage — it drives ordinary people into the arms of climate-science deniers and political actors who exploit the confusion.
When scientists seem reticent; unable or unwilling to say clearly what their findings mean in practical terms, those same bad-faith voices step in to “translate” it for the public — and that’s how we end up with presidents like Donald Trump trying to gut climate research altogether.
If the evidence says the AMOC tipping point may be within two decades, and that it has already weakened, that should be stated as clearly and directly as possible — not buried under technical qualifiers. Ordinary readers shouldn’t have to decode urgency from between the lines.
We are not being well served while this pattern continues. The inaction and confusion in the public’s mind can only continue
[Response: Climate scientists have not minced their words when it comes to pointing out we must reduce greenhouse gas emissions, from interview statements to thick IPCC consensus reports. I also say this in many interviews all the time and I repeatedly post across social media the IPCC graphics on how fast emissions need to drop to zero. (E.g. last month https://www.linkedin.com/posts/stefan-rahmstorf-37049a1b9_grundwissen-klima-zur-erinnerung-weniger-activity-7371913697490903040-1bWV)
This blog is a place where we can go more into detail on special topics, like the evidence for AMOC slowing and how valid the counter-arguments are that you sometimes hear. This is not an article I could have published in the Guardian, say – it is for those who want to look deeper into the science, and here I don’t feel the need to repeat with every article what it takes to stick to the Paris Accord. -Stefan]
Thought Stefan said in one of his replies to avoid 1.5/2C. Come to think of it isn’t that what all climate scientists and the IPCC have stated.
Thanks. It really is that simple.
I very much appreciate the increased clarity provided here in responses. The problem has not changed, but real world evidence is piling up; it should be more, not less, obvious. Blaming those who provide the information for not getting people to care about their own survival more than they wish to oppose inconvenient truths, believe lies, blame victims, and follow charismatic clowns and predators shows we have too little care for each other to be bothered with survival. We’re reaching peak idiocy.
That’s because Dr. Rahmstorf was clear. The problem is that Mo Yunus is a sockpuppet account from an individual whose other accounts have been blocked. They have a ‘doomist’ perspective that always complains about climate scientists not making the policy recommendations that account wants (ex: they complain that ‘net zero’ emissions by 2050 is not enough, when they don’t even know what ‘net zero’ means). They also refuse to recognize the distinction between discussing science vs. science-informed policy recommendations.
https://www.realclimate.org/index.php/archives/2025/06/unforced-variations-jun-2025/#comment-834369
https://www.realclimate.org/index.php/archives/2025/10/unforced-variations-oct-2025/#comment-840541
The fact that science papers in meeting peer review are limited to at least being in the range of a portion of a scientific consensus limits their ability to be specific.
Propagandists are not so limited and sow mis/disinformation and outright lies with abandon. THAT is where “public confusion and distrust” arise from far more so than from careful language in scientific reports.
Curious:
1) Which IPCC AR6 emissions scenario SSP mirrors the Paris Accord emissions reductions trajectory if the world followed it perfectly from 2015 ?
2) Can any climate scientist or current output provide the scientific evidence that had the world followed that transition goals all the way through that the AMOC would not have weakened?
3) And that the AMOC would not now be on the brink of crossing a Tipping Point within the next 10-20 years toward an eventual Collapse post-2100 as per the Drijfhout et al. paper?
Refs welcomed.
Thank you.
I understand this blog focuses on the scientific detail rather than policy prescriptions — [why do commenters here public and scientists often assume those addressing specifics, asking a question is so stupid they did not already know this obvious fact about RC? ] —, but from a public perspective where the rubber meets the road, in ALL matters , that’s exactly where the breakdown keeps happening.
Most people — including local government staff, decision-makers, and voters — are not interested in internal academic distinctions or model intercomparisons!. Not at all. What we need to know as a Species, in plain terms, is how severe the risk is likely to be within the next few decades, and what it actually means for our societies.
ie what to do about it now, as far as adaptation is concerned and not fantasy temperature measurement goals that defy Reason and will continue to be unreachable.
When scientists talk mainly to each other, and assume the “big picture” doesn’t need restating, the result is that the public conversation is dominated by confusion, denial, and misinformation from Climate Scientists and their elitist Institutions.
The communication gap is filled by bad actors — and that’s part of how climate-science denial movements gained enough traction to influence politics and even elect leaders like Donald Trump, who then tried to dismantle climate research itself.
That’s why clarity and directness are not minor issues — they are the core of effective risk communication. People shouldn’t have to decode urgency from academic nuance to continual silence and prevarication.
Killian has told you this about risk for decades. As James Hansen spelled out the overwhelming Reticence among the climate scient community too. Didn’t you hear them, or did you simply figured they must be wrong about everything? Well they aren’t wrong, and nor am I. You are.
And it is obvious.
And that’s the way it should be. If you wanted to free-wheel on any policy discussion you can go to just about any other social media site. As it is, this site is moderated so that a scientific focus can be maintained.
Something to consider:
The correlation between NAO and sea-level height gauges in the North Sea to Baltic Sea has been known for quite a while
“The influence of the North Atlantic Oscillation on sea-level variability in the North Atlantic region ” (2003)
https://www.tandfonline.com/doi/abs/10.1080/10236730310001633803
So why aren’t all these variability signals placed in the context of tidal forces? Many ways to look at this. I wrote a short SubStack article with a video showing how nonlinear tidal effects play into the variablity
https://pukite.substack.com/p/mean-sea-level-models
How this plays into the relationships between indices is worthy of exploration
NAO AMO AMOC
MY: Killian has told you this about risk for decades.
BPL: I’ve mostly stopped reading Killian’s posts. See if you can figure out why.
Re: “Killian has told you this about risk for decades.”
Killian makes stuff up, like claiming there are studies showing at least a 5% chance of human extinction from anthropogenic climate change.
https://www.realclimate.org/index.php/archives/2025/10/unforced-variations-oct-2025/#comment-840307
You tried to support Killian’s fabrication by misrepresenting Michael Mann and the IPCC.
https://www.realclimate.org/index.php/archives/2025/10/unforced-variations-oct-2025/#comment-840509
So neither you nor Killian should be trusted on how to communicate with the public on climate change.
I have kind of obvious questions; They might have been answered in multiple places (my apologies if so), but I haven’t seen it.
If AMOC really collapses, how does that affect Arctic sea ice extent? (Does it tend to recover, becoming a negative feedback for climate change?) And does a cooler ocean around Greenland reduce ice sheet loss, mitigating sea-level rise?
Similarly, Greenland itself is warming—from a Greenlander point of view, the local ecology is changing. Do the occupied regions of Greenland return to a colder, more historically normal state?
Thank you.
Jake,
you have inadvertently arrived at the wrong Blog / forum. Greenland and the Arctic? This paper review is not about such matter.
Please note: this quote above::
But how to cut emissions fast is another discussion, not the topic of this blog piece nor is it my expertise. This blog is not even about the AMOC shutdown risk, but rather it is focusing on the question of whether the AMOC has already slowed down and the evidence provided by the SST fingerprint. -Stefan
Thank you and Kind regards
Rahmstorf’s statement above
“””A recent paper by van Westen et al. (2025) has shown that the much-feared tipping point where the AMOC breaks down (first demonstrated in a simple box model in 1961) is also found in a high-resolution (eddy resolving) ocean model – destroying any hope that it might be an artifact of too coarse and simple models”””
Can be contrasted to his post here on Jan 26 2025
“””Of the 24 CMIP6 models, a full 23 underestimate the sea surface cooling in the ‘cold blob’. And most of the CMIP6 models even show a strengthening of the AMOC in the historic period, which past studies have shown to be linked to strong aerosol forcing in many of these models”””
Which seems to indicate that for CMIP6 models a very careful tuning is required to show his pattern.
Without that modern models seem not able to proof this cold blob. Perhaps we only see masterful tuning rather than underlying physics at work here, the assumption that these are not artefacts of the modeling seems contradicted by the apparent ease they can be switched on and off in modern models
Cycles in Atlantic are well studied and Artic patterns forming and weakening as a result have happened in the recent centuries without tripping any tipping points.
Let me preface this by saying ocean currents are very complex and far above my knowledge paygrade.
If the AMOC is what keeps UK/western Europe unusually warm then surely the best measure for it’s strength is the relative temperature change of London, for example, compared with somewhere in British Columbia, perhaps Vancouver. Not quite the same latitude, but close enough.
I feel measuring SST as an indicator of current strength is more ambiguous than measuring what is a known result
And on a similar vein, if “The #AMOC is the reason for Europe’s mild climate” how is it that shutting it down has virtually no impact on any of coastal Europe until the mid-north of Norway?
Uh, if you think the AMOC does NOT affect Euro-climate, have you checked the temps at any comparable latitudes around the world?
jgnfld,
I don’t think that!!!!! The modelling shown in Stefan’s Figure 1 shows that.
jgnfld: if you think the AMOC does NOT affect Euro-climate, have you checked the temps at any comparable latitudes around the world?
Keith Woollard 19 Oct : I don’t think that!!!!! The modelling shown in Stefan’s Figure 1 shows that.”
No, Keith W. thinks that!!!!! Fig. 1 shows NOTHING of the sort. – It shows projections of the ANNUAL avg. SEAWATER temperature. NOT the climatic changes over Europe.
Thus implying that the former is a proof of the absence of the other is either
an arrogance founded on a staggering ignorance, or a deliberate misrepresentation:
1. temperature of ocean next to shore does not translate directly onto the temperature of air over the continent because:
– the ocean has much higher heat capacity than air or land – hence temps swings over land are much larger than in the ocean
– temp of marine air coming onto the land is not influenced ONLY by the less cold waters – by the Norway’s shore but by the “integrated” temperature of ocean water as the air moving predominantly from the west to east PICKED the coldness along the way – i.e. after going over the most intense Cold Blob
– MOST IMPORTANTLY – change in the currents from the shutdown of AMOC changes the atmospheric circulation – if the boundary between the Arctic and mid-latitudes air masses
were to at least part of the time – shift south you would have massive changes in temperatures despite the annual water next to Norway cooling only by a couple of degrees.
2. the other level of ignorance or manipulation is that Fig.1 is about ANNUAL AVERAGE TEMPERATURE, And it is the EXTREMES that kill, not the averages.
For all these reasons, coastal average annual seawater temps is COMPLETELY unrepresentative to the climatic affect over European continent.
And no researcher worth their salt would use a straight extrapolation of coastal average annual seawater temps to question the credibility of the conclusions dozens(?) of papers that model these effect EXPLICITLY. Some of these – DISCUSSED on this very website.
Including the link to the AMOC visualisation page, already reposted by zebra:
https://amocscenarios.org/?lat=53&lon=-1.25&model=cc_RCP45&is_amoc_on=false&is_delta=false&metric=temp_1_in_10_yr_min
And here our Ken the Denier can check the accuracy of his analysis:
Keith Woollard: virtually no impact on any of coastal Europe until the mid-north of Norway
AMOC shutdown visualisation, despite adding +2C globally (AGW)
mid-north Norway (south of Lofoten) )
– avg. Dec- Feb: no AMOC + 2C : -28.1C
preind, (AMOC on) – 9.3C
Keith W: “virtually no impact”
– cold extreme event (once per 10 years)
no AMOC + 2C : -51.1 C
preind, (AMOC on) – 29.4.C
Keith W: “virtually no impact”
– annual freezing nights:
no AMOC + 2C : 332 per year
preind, (AMOC on) 233 per year
Keith W: “virtually no impact”
– Jun-Aug temp
no AMOC + 2C : 2 C
preind, (AMOC on) +7.5 C
Keith W: “virtually no impact”
Scotland (Edinborough)
Dec-Feb avg. 6C colder
extreme cold event 22.3C colder
Keith W: “virtually no impact”
Ireland (Dublin) Dec-Feb avg. – 4.6 C colder
extreme cold event – 16 C colder
Keith W: “virtually no impact”
Re: Keith Woollard
– Because Stefan used word “weakening” not the “shutdown” you use?
– Because early (weak) effects of weakening may not punch through global warming and/or by natural variability of currents?
– Because ocean circulation is complicated and it would be extremely naive? disingenuous?
to expect from highly NONLINEAR system – a simplistic PROPORTIONAL to the decrease in the volume of AMOC effect on air temps. over Europe?
– Because some climatic effects may need time to fully manifest themselves (ocean thermal inertia)?
– Because the primary concern about weakening of AMOC is not its own effect on air temps over Europe, but that it may be a sign that we are heading to the TIPPING POINT, crossing of which may put us into the shutdown mode, with the effect of the shutdown similar to the Younger Dryas?
Your attitude is like that of a driver, who driving in mountains, after losing SOME brake fluid from the system, experiences some WEAKENING of the brake action, but ignores the risk of possible losing the brakes entirely (a.k.a “shutdown” of the car’s breaking ability )- laughing off the first symptoms to his wife:
“Honey, don’t be hysterical, we haven’t fallen off the cliff at the previous curve, have we? So, kindly shut up, and let me enjoy the view “
“Figure 1. Sea surface temperature change pattern caused by the AMOC shutting down in a high-resolution ocean model.”
Keith,
Stefan gave this reference.
https://amocscenarios.org/?lat=45.25&lon=-27.75&model=cc_RCP45&is_amoc_on=false&is_delta=false&metric=temp_1_in_10_yr_max
It’s better but still takes a little fussing to get data.
For example, look at freezing days in Paris… if I did it correctly, it’s 8 without AMOC v 1 with.
Hope that helps.
Stefan, thank you for such an informative and quite approachable post on such a complex matter. The links provided aided me greatly.
I also want to support the suggestion by Zebra (Oct 13, 2025 8:02am #comment-840649) to seek out some volunteer help to expand presentation options in support of this site’s topics would indeed be helpful towards further fulfilling the important rationale behind, and the continuing mission of, Real Climate.
New AMOC research. Another hypothetical physics simulation based on modeling and to SSP5-8.5
we find that the mean AMO tipping time estimates of our ensemble that was 2055.
So that is in the second part of the century. So which is like in 30 years from now. so that is quite close by. An analysis consisting of 25 different climate models shows that the AMOC could begin to collapse by 2063 (mean) (from 2026 to 2095 Pub: 24 August 2025
In this ClimateGenn episode I speak with Dr René van Westen about his recently published papers with colleagues that identify a physics based method for forecasting the very consequential AMOC Tipping Point.
Link to research paper: https://agupubs.onlinelibrary.wiley.com/doi/10.1029/2025JC022651
If or when the AMOC collapses, it will lead to North western Europe plunging into freezing conditions with an estimated 20% less rainfall, and widespread societal disruption, especially to food production and energy needs.
In René’s own words: “There is this signal that this may be a potential scenario, which we can’t ignore because the impacts are quite, quite drastic. And therefore it is very worthwhile to know what we can expect as a society. And I hope in the end that I’m wrong also in the predictions, because we don’t want to deal with these kinds of changes because that in the end will be very difficult to adapt to.”
The Fix?
To limit the risk of AMOC weakening and a potential collapse in the foreseeable future, global society needs to be on track of a low-emission scenario (i.e., SSP1-1.9 and SSP1-2.6) and urgent climate action is needed to guarantee this.
” Climate scientists have not minced their words when it comes to pointing out we must reduce greenhouse gas emissions, from interview statements to thick IPCC consensus reports. I also say this in many interviews all the time and I repeatedly post across social media the IPCC graphics on how fast emissions need to drop to zero.”
Urgent climate actions like reducing emissions rapidly toward zero will take none of the CO2 already added out of the atmosphere to lower global temperatures. What that does is leave carbon in the ground and make it more difficult to finish the energy transition to renewables and EVs. It’s simply not possible to get to an electrical world without using vehicles that run on gasolines and renewable biofuels to make it happen. Name and blame calling notwithstanding. The implications are obvious. Atmospheric CO2 will continue to increase. There is no way around this reality.
KT: “It’s simply not possible to get to an electrical world without using vehicles that run on gasolines and renewable biofuels to make it happen.”
MS: What is your proof for that claim? You keep saying it as if it is a given, and keep saying it despite the fact that we don’t have to eliminate ALL ICE vehicles.
KT: “The implications are obvious. Atmospheric CO2 will continue to increase. There is no way around this reality.”
The way around “this reality” is: Stop powering automobiles with fossil fuels. Stop powering other vehicles with fossil fuels as much as possible.. Stop generating electricity by burning fossil fuels. Stop deforestation, and increase reforestation.
Following that procedure, CO2 will eventually stop increasing. And there’s this: CO2-free concrete developed by Heidelberg Norge…
https://www.aftenposten.no/oslo/i/gwgboq/utslippsfri-betong-en-graagroenn-verdensnyhet-fra-norge
What proof. Martin? Look around and see what vehicles are being used to deliver and install any of the renewable projects… and also deliver food and all of the materials needed. Doing any reforestation. Planting corn and sugarcane for renewable biofuel ethanols..
Stop powering vehicles with gasolines and renewable biofuels. Go ahead and see what takes place to all of the above.
KT: “What proof. Martin? Look around and see what vehicles are being used… ”
MS: Ken, you said, “It’s simply not possible to get to an electrical world without using vehicles that run on gasolines…” You said it is impossible to convert to an EV world without using ICEVs. Obviously, before there were any EVs,, we had to use ICEVs, and now we are well into the conversion phase, and we are still using ICEVs, but the use of EVs in all the areas you claim it is impossible to use TVs is increasing. I provided evidence; I can provide more, but that’s not necessary.
Your claim is that the process that is happening now, all over the world, is impossible. And your proof is the logical fallacy that because we still need ICEVs, we will always need ICEVs.
KT: “Stop powering vehicles with gasolines and renewable biofuels. Go ahead and see what takes place to all of the above.”
MS: It is happening, Ken.
Martin Smith, well explained. KT has been posting this repetitive drivel for about a year now. It’s been rebutted several times by several people, but now I just ignore it. Theres a famous saying “Never argue with an idiot; they will drag you down to their level and beat you with experience,” which is attributed to Mark Twain. The saying suggests that engaging in an argument with someone who is unreasonable is a losing battle, as they will use their own logic to confuse and exhaust you, making it impossible to have a productive conversation. “
Barton Paul Levenson says
18 Oct 2025 at 10:46 AM
MY: Do better, deal in evidence or be silent, you’re not helping.
BPL: Ray does deal in evidence. You deal in insults and condescension. I prefer Ray.
Barton Paul Levenson remains and obnoxious belligerent liar. And still his comments pass moderation.
Hi! Can you point me to the reference backing up this statement about the anti-correlation of Nordic Sea exchange and AMOC? Thank you.
For example, the increase in Nordic Sea exchange is sometimes taken as contradicting an AMOC weakening – but that is a non-sequitur as there is no reason why these two circulations should be in sync, but good physical reasons and empirical evidence suggest that in fact they anti-correlate.
Re: Fig. 1 description: “We see the famous blue ‘cold blob’ due to less heat being brought to the northern Atlantic,”
Stefan, shouldn’t this be supplemented with:
… “and due to less cold sinking from the surface into the deep ocean due to the reduced NADW production (which drives the AMOC) “
Very interesting article, also the mentioned “con’s”. One of them ( the latest Terhaar et al. paper) is cited with this argument: “But for the period since 1958 Caesar et al. 2018 also did not find a statistically significant AMOC weakening…” On the other side is often mentioned that the estimated weakening of the AMOC comes from the ERF. My question: If the AMOC has no significant trend from 1958 on (but before?), how does this match with the estimate of a (anthropogenic) forced weakening? In 1958-2018 we saw an ERF total of 2.1 W/m², to 1958 there is an ERF of 0.7 W/m² or 3 times stronger ERF since 1958, following the latest ERF data. Or the other way around: If the AMOC got weaker before (?) 1958 but not thereafter (?), does this bolster some thougts of internal variability rather then a forced response?
I’ve got the same question I think as Keith:
> if “The #AMOC is the reason for Europe’s mild climate” how is it that shutting it down has virtually no impact on any of coastal Europe until the mid-north of Norway? [looking at figure 1]
Figure 1 is for “AMOC shutting down” — so I expected to see a lot of ‘blue’ (negative) around the UK — as AMOC is important for our climate… but it’s about ‘zero’ (white) on the plot.
My guess: This can be explained because although the sea temperature might not change around the UK… the atmosphere might still change a lot? All that “negative change in energy” -2C to -4C in the North Atlantic appears to fade away further eastward… but that loss needs to ‘go’ somewhere – so presumably some of it means changes in the atmosphere?? So is that why it looks like this doesn’t have any effect on the UK/Northern Europe in the figure… This is just my guess at trying to reconcile the plot with the consensus that AMOC is important for the warmer European climate. Let me know if this might be the right interpretation.
A related question: For the UK – do we avoid some of the impact of climate change because the AMOC slow-down ‘cancels out’ increasing average temperatures (My guess would be ‘no’ –> the climate we value also means the distribution/timing of rainfall, seasonal changes and what extremes look like… so even if the mean temperature didn’t change much we would still be in terrible trouble with, say, a 3-4C global increase? — also not much use to the UK if the rest of the world is toast!).
Thanks for the interesting post!
Michael, this is a reference Stefan gave that has more accessible details.
https://amocscenarios.org/?lat=45.25&lon=-27.75&model=cc_RCP45&is_amoc_on=false&is_delta=false&metric=temp_1_in_10_yr_max.
You can check e.g. days below freezing in Paris with and without AMOC. Doesn’t mean summers are not hotter… I don’t have time to explore in more detail so if you find anything interesting please comment on it.
Michael 22 Oct: “ I’ve got the same question I think as Keith”
And I have just posted the answer to the same question by Keith, but perhaps i didn’t show yet when you were wroting your post:
Piotr 21 Oct
Since some of the answer is specific to Keith, I will rephrase the main points in context of your post:
Michael: “Figure 1 is for “AMOC shutting down” — so I expected to see a lot of ‘blue’ (negative) around the UK — as AMOC is important for our climate… but it’s about ‘zero’ (white) on the plot.”
Several reasons. First, as you already guessed:
Michael: “ My guess: This can be explained because although the sea temperature might not change around the UK… the atmosphere might still change a lot?
Exactly – the coolness the wind acquires not only over near-shore waters – but given the predominant westerlies – has built up over the width of the N. Atlantic ocean – including the < -8C water temp. annual anomaly over the Cold Blob.
MOST IMPORTANTLY – change in the currents from the shutdown of AMOC changes the atmospheric circulation – e,g,, if the boundary between the Arctic and mid-latitudes air masses were to shift – (permanently or at least frequently southward ) – it would cause massive changes in temperatures, dwarfing those in shore waters.
And you can see it in interactive AMOC visualization posted before on this site, and re-posted in this thread by zebra: https://amocscenarios.org/?lat=56&lon=-7.5&model=cc_RCP45&is_amoc_on=false&is_delta=true&metric=temp_2m
So over the shore waters of UK, where Fig.1 shows "zero", in the simulation of AIR temp. over the same waters, we get: – off the shores of England -2 to -3C cooling, off Glasgow -5C, top of Britain -7C.
And all these cooling AFTER it hade to overcome the +2C global warming
But that's not the end of the story – its not the averages but extremes that kill (harm) you:
– average winter cooling (your heating bill), extreme cold events (people freezing to death or harmed by extreme cold exposure) and the number of night with subzero temps (late of early frost damaging agriculture and plants in general):
Under global warm. +2C
Liverpool = annual average -2.9C colder (from preindustrial)
Dec.-Feb. avg. -4.4C colder (from preindustrial)
cold extreme – 18.1 C (colder than the cold extreme in preindustrial)
annual freezing night – 119 vs 27 /yr preindustrial
Edenborough – diff from preindustrial:
annual averag -4.8C colder
Jun-Aug average -3.1 colder
Dec-Feb avg. – 6C colder
extreme cold event – 23.1C colder
annual freezing night – 162 vs 30/yr preindustrial
So not exactly the impression one gets from Fig.1 showing "about ‘zero’ (white)". And don't let me start on Norway.
I’ll reply here rather than further up to try and encompass all discussion.
OK, the additional link Stefan provided shows different data to his figure 1. I strongly suspect his Figure 1, or at least the description provided, is incorrect.
The amocscenarios link seems logically correct. If you look at any particular point, marine or onshore, and toggle between amoc on and off the temperature change is exactly what you would expect. This applies whether you use pre-industrial or +2K warming.
I am unaware of how you created figure 1 Stefan, but perhaps you have gridded a normalised marine anomaly and masked all the land data with zeros.
Keith Woollard 23. Oct I strongly suspect his Figure 1, or at least the description provided, is incorrect.
When I see something I don’t understand – my first thought is NOT that the experts in the field are massively wrong, and I, despite being a lay person in their field are so smart I could see the experts couldn’t. Apparently YOU DO.
And it has been explained Fig. 1 are the annual WATER temperature. while amocscenarios shows AIR temperature. As such NOT THE SAME:
“For all these reasons, coastal average annual seawater temps is COMPLETELY unrepresentative to the climatic affect over European continent.”
So much for the base of your “strong suspicion” authors of the 2025 study must be wrong, not you.
====
Here it is this explanation – which part you didn’t comprehend, Keith?
=======================
Keith Woollard 19 Oct : I don’t think that!!!!! The modelling shown in Stefan’s Figure 1 shows that.”
No, Keith W. thinks that!!!!! Fig. 1 shows NOTHING of the sort. – It shows projections of the ANNUAL avg. SEAWATER temperature. NOT the climatic changes over Europe.
>b> Thus implying that the former is a proof of the absence of the other is either
an arrogance founded on a staggering ignorance, or a deliberate misrepresentation:
1. temperature of ocean next to shore does not translate directly onto the temperature of air over the continent because:
– temp of marine air coming onto the land is not influenced ONLY by the less cold waters – by the Norway’s shore but by the “integrated” temperature of ocean water as the air moving predominantly from the west to east PICKED the coldness along the way – i.e. after going over the most intense Cold Blob
– MOST IMPORTANTLY – change in the currents from the shutdown of AMOC changes the atmospheric circulation – if the boundary between the Arctic and mid-latitudes air masses
were to at least part of the time – shift south you would have massive changes in temperatures despite the annual water next to Norway cooling only by a couple of degrees.
2. the other level of ignorance or manipulation is that Fig.1 is about ANNUAL AVERAGE TEMPERATURE, And it is the EXTREMES that kill, not the averages.
For all these reasons, coastal average annual seawater temps is COMPLETELY unrepresentative to the climatic affect over European continent.
And no researcher worth their salt would use a straight extrapolation of coastal average annual seawater temps to question the credibility of the conclusions dozens(?) of papers that model these effect EXPLICITLY. Some of these – DISCUSSED on this very website.
Including the link to the AMOC visualisation page, already reposted by zebra:
https://amocscenarios.org/?lat=53&lon=-1.25&model=cc_RCP45&is_amoc_on=false&is_delta=false&metric=temp_1_in_10_yr_min
Keith Woollard: vs, facts
KW: “virtually no impact on any of coastal Europe until the mid-north of Norway”
AMOC shutdown visualisation, despite adding +2C globally (AGW)
mid-north Norway (south of Lofoten) )
– avg. Dec- Feb: no AMOC + 2C : -28.1C
preind, (AMOC on) – 9.3C
Keith W: “virtually no impact”
– cold extreme event (once per 10 years)
no AMOC + 2C : -51.1 C
preind, (AMOC on) – 29.4.C
Keith W: “virtually no impact”
– annual freezing nights:
no AMOC + 2C : 332 per year
preind, (AMOC on) 233 per year
Keith W: “virtually no impact”
=======================================
Piotr, I was questioning Figure 1 from this post. The amocscenarios link is from a different paper using completely different modelling and methodology. Your three lengthy attempts to discredit my question have all been completely incorrect.
Stefan used his figure 1 to show his pet cold blob, but the rest of the image is not believable
Stefan Rahmstorf is a highly qualified scientist with real expertise. The use of the claim ‘pet’ here, where in addition to lacking the high reputation of our host one is a guest, says more about them than about him. If there is somebody here who has adopted false ideas as their north star, it is people who use insults as arguments to waste our and their own time here.
Keith Woollard: “ Piotr, I was questioning Figure 1 from this post ”
Moving the goalpost, Keith? You were USING that Fig,1 no to question it , but to QUESTION Stefan’s opening line: “The AMOC is the reason for Europe’s mild climate”:
======
– Keith Woollard: 17 Oct: if “The AMOC is the reason for Europe’s mild climate” how is it that shutting it down has virtually no impact on any of coastal Europe until the mid-north of Norway?
– jgnfld: “if you think the AMOC does NOT affect Euro-climate, have you checked the temps at any comparable latitudes around the world?”
KW: 21 Oct: “I don’t think that!!!!! The modelling shown in Stefan’s Figure 1 SHOWS that”.
====
So . in your 17 and 21 posts – Fig. 1 was for you CREDIBLE – because you presented it SUFFICIENT and UNEQUIVOCAL PROOF of “ virtually no impact of AMOC total shutdown on any of coastal Europe“,
But AFTER zebra and I have shown the fallacy of your use of that Fig,1 -EVERYTHING changed – now you imply that you came here NOT to challenge Stefans “The AMOC is the reason for Europe’s mild climate” but to challenge the credibility of that Fig.1 that according to you few days before was proving . “virtually no impact”., Namely:
– I have shown show in detail the fallacy of Woollard’s use of OCEAN WATER temp. to make statements on LAND AIR temps.
– Zebra gave a link to visualisation of the AMOC effect on LAND AIR temps – numbers DRAMATICALLY different than Woollard’s: conclusion: “virtually no impact” he deduced from the map of OCEAN WATER temps.
Now you had a choice
1. admit of being completely wrong, and learn something from that about yourself,say:
– how did I get so spectacularly wrong?
– why was I so confident that I was right; why an alarm didn’t sound in my head – that if something is too good to be true then it usually is – how likely is that I, a climatological ignorant, discovered something dozens of professional climatologists missed (“confirmation bias”, anyone?)
OR
2. dismiss the criticism, learn nothing, and portray your embarrassing intellectual/ethical failure as a … victory
Let’s see which of the two options Keith Woollard chose. Well …:
1) he never admits of being wrong in his claim of “virtually no impact on any of coastal Europe until the mid-north of Norway”
2) he never admits this fallacy resulted from HIS misuse of Figure 1 (HIS using of coastal water temps as if they were quantitatively representative of air temp over land)
3. he attempts to snatch the victory from the jaws of the defeat by:
– dismissing my criticism showing his errors in p.1 and 2, not be falsifying my arguments, but by …declaring:
KW: “Your three lengthy attempts to discredit my question have all been completely incorrect .
– and portrays HIS misunderstanding and subsequent misuse of Figure 1 (using ocean temps as representative for air temps over land) as him … being RIGHT all along and wrong being …. Figure 1 and Stefan:
KW: “ I was questioning Figure 1 from [Stefan’s] post”
KW: . I strongly suspect his Figure 1, or at least the description provided, is incorrect.
I am unaware of how you created figure 1 Stefan, but perhaps you have gridded a normalised marine anomaly and masked all the land data with zeros.”
And the above – AFTER it has been already explained to him, in the “three lengthy” posts
that Stefan’s figures shows OCEAN temperature. so no need to “ mask land data with zeros : there are no OCEAN water temps. in air temp. data on LAND!
You can tell more about a man in his defeat than in his victory. Ladies and Gentlemen – .Keith Woollard!
Piotr,
I absolutely have never thought that the AMOC does not keep Europe warmer than equivalent latitudes. And without so many negatives….I know the Gulf Stream keeps Europe unusually mild.
I unreservedly apologise if I gave you the impression that I thought otherwise. My problem is with his Figure 1, or the modelling that led to it
The amocsummaries website has nothing to do with the modelling nor his Figure 1
“KT: “Stop powering vehicles with gasolines and renewable biofuels. Go ahead and see what takes place to all of the above.”
MS: It is happening, Ken.
Martin…Indeed it is.happening. And there has been a new record for Mauna Loa atmospheric CO2 every year. It will continue because we need fossil fuels to complete the transition to renewable and EVs.
Nigelj: Theres a famous saying “Never argue with an idiot; they will drag you down to their level and beat you with experience,”
Good point… When the debate is lost, slander and personal insults are the tools of the loser… Socrates.
KT. My comment was not a personal attack. It was a statement of fact about your type of idiotic reasoning and unwillingness to engage normally and rationally.
When someone actually is continually spouting the same idiocy time and time again (as you do) it absolutely is NOT “losing” to point this fact out.
Ken Towe, I can’t quite figure out whether your strategy is a simple straw man–arguing that anyone here is advocating an immediate end to fossil fuel use–or whether you simply lack the imagination to extrapolate current trends in renewables to a date in the not-too-distant future where use of any other energy technology COSTS YOU MONEY. I am sure the demand for horseshoes kept rising until it dropped to zero or that the demand for whale oil rose until gas lights and then electricity displaced it.
We cannot make change immediate. However, through thoughtful policies, we can hasten the change and minimize the carbon released into the atmosphere. Of course we would have been in a much better position and would fact far fewer consequences had we adopted that strategy 30 years ago when the evidence for anthropogenic climate change was merely overwhelming rather than incontrovertible. Arguing about non-issues is merely wasting more of our scarcest commodity–time.
Copilot AI describes the whale oil curve thusly:
[bold]Key Phases of the Curve
1800–1830: Gradual Rise[/bold]
Whale oil became increasingly popular for lamps due to its clean burn and availability.
Spermaceti (from sperm whales) was especially prized for high-quality illumination.
[bold]1830–1860: Peak and Saturation[/bold]
Whaling was a booming industry; whale oil was the dominant lighting fuel in affluent households.
By 1850, demand was high, but whale populations were declining, driving up costs.
[bold]1860–1880: Sharp Decline[/bold]
Petroleum was discovered in Pennsylvania in 1859, and kerosene quickly replaced whale oil as a cheaper, more accessible alternative.
Whale oil became too expensive for most users, and whaling began to wane.
1880–1920: Minimal Use
Whale oil use for lighting was nearly obsolete, though some whale products persisted in other industries.
—–
I might add this curve is very common across many commodities historically. Horses were ubiquitous until cars came along and we canned them all for dog food in the mid 20th century. Many here are old enough to remember the Ken-L Ration horsemeat jingle sung on TV kids shows in the late 50s to 60s:
My dog’s bigger than your dog,
My dog’s faster than yours.
My dog’s shinier ’cause he gets Ken-L Ration,
My dog’s better than yours….
[Response: There’s a larger context though. Replacing whale oil with kerosene didn’t save the whales. Harvest rates for whales (for meat and various industrial uses) went up by multiple orders of magnitude in the 20th Century: https://ourworldindata.org/grapher/whale-catch – gavin]
Re. gavin’s response: Yeah…I live, hike, and sail in Newfoundland and so am quite up on that aspect of whaling as well. You may or may not know that in the 30s to the 70s there was a reasonably large mink industry here fed primarily by killing minkes.
As an avid sailor, hiker, and nature lover I find that horrifying to this day. That said, when the practice was stopped, many farmers simply opened their pens and since Newfoundland coastal and riverine environments are quite perfect for them they have thrived. (The rather famous/infamous Shannon Tweed grew up on one such farm not far away!) Several mink families live in in the rocks lining our marina basin at Holyrood on Conception Bay. Minkes, humpbacks and even fin whales are now much more common. Lots of seals. Even see the odd pod of orcas. And now tuna are even returning to Conception Bay after being almost completely fished to extinction decades ago. Even more amazing is that mola are becoming almost common during August which is a clear sign of warming waters as they cannot stand water colder than about 12C.
I’d also note that well into the 1880s, whale oil was preferred lighting fuel for the wealthy, who objected to the smell of the kerosene as “not fit for decent people”. And folks had known about petroleum for years before. The increasing scarcity of whales merely created an inroad for demand.
And no, it didn’t save the whales. Much like the hunters that killed the last of the passenger pigeons, the whalers knew they were endangering the leviathans of the deep, but killing whales was “just what they did”. It was their identity and the basis of the economy. Humans have always been a blight.
“To be an ecologist is to live in a world full of wounds.”–Aldo Leopold.
Ray, if I have any spiritual gurus, they are Aldo Leopold and Rachel Carson, and that’s a paraphrase of one of my favorite Leopold quotes. You’ve certainly got the gist right, but the full quote, from A Sand County Almanac, is (my bold):
One of the penalties of an ecological education is that one lives alone in a world of wounds. Much of the damage inflicted on land is quite invisible to laymen. An ecologist must either harden his shell and make believe that the consequences of science are none of his business, or he must be the doctor who sees the marks of death in a community that believes itself well and does not want to be told otherwise.
My friends, I attest its truth, from my own ABD ecological education. Sobering indeed. Carson, OTOH, expressed the joy of learning about the natural world. In The Sense of Wonder, she stated her faith, and mine:
Those who dwell, as scientists or laymen, among the beauties and mysteries of the earth are never alone or weary of life. Whatever the vexations or concerns of their personal lives, their thoughts can find paths that lead to inner contentment and to renewed excitement in living. Those who contemplate the beauty of the earth find reserves of strength that will endure as long as life lasts.
My ecological education has brought me joy as well as sorrow. In my 8th decade, I find it a net benefit: good enough for the rest of my days. It is undeniably a trade-off, however. More words of others (Ecclesiastes 1:18 KJV):
For in much wisdom is much grief: and he that increaseth knowledge increaseth sorrow.
IMHO, a paradox of the human condition, not to be resolved intersubjectively.
Mal Adapted posted a good quote:
“Those who dwell, as scientists or laymen, among the beauties and mysteries of the earth are never alone or weary of life. Whatever the vexations or concerns of their personal lives, their thoughts can find paths that lead to inner contentment and to renewed excitement in living. Those who contemplate the beauty of the earth find reserves of strength that will endure as long as life lasts.”
That quote is very true. I read a university textbook on the fundamentals of geology a couple of years ago, just out of interest and because I’m retired so I have the time. Very long and detailed, but extremely rewarding and a real eye opener on what really goes on under our feet.
Mal,
I don’t know that I agree with the bible stuff.
The more “knowledge” I have gained, the more I have come to understand that that knowledge is meaningless.
Physics teaches us that ultimately, we are all in Plato’s cave. We measure the shadows, and give them names, and predict their dance. Meh.
It’s when looking at nature is just looking, that peace comes.
Re. “Physics teaches us that ultimately, we are all in Plato’s cave. We measure the shadows, and give them names, and predict their dance.”
Very close to Bohr’s view, actually.
Re. “Meh”
Very far from Bohr’s views, actually.
“We see quite clearly that what happens to the nonhuman happens to the human. What happens to the outer world happens to the inner world. If the outer world is diminished in its grandeur then the emotional, imaginative, intellectual, and spiritual life of the human is diminished or extinguished. Without the soaring birds, the great forests, the sounds and coloration of the insects, the free-flowing streams, the flowering fields, the sight of the clouds by day and the stars at night, we become impoverished in all that makes us human.”
~ Thomas Berry, The Great Work: Our Way Into The Future
Ray and Mal (et al.): Thoughtful and articulate, thank you.
Z: Thoughts of value should not be dismissed (though, as noted, they do not represent action) just because they’re in the Bible.
zebra: It’s when looking at nature is just looking, that peace comes.
That too, z. It’s a grand and glorious paradox, not to be resolved intersubjectively!
z: The more “knowledge” I have gained, the more I have come to understand that that knowledge is meaningless.
Physics teaches us that ultimately, we are all in Plato’s cave. We measure the shadows, and give them names, and predict their dance. Meh.
Deep, assuredly. But the meaning of those shadows can only be assigned by the cave’s occupants. Under the Mediocrity Principle, the key AFAICT is to assign meaning within the appropriate scope, from ourselves, through our family, friends, nation, and species, on to the earth, the solar system, and the stars; ever mindful that in the scope of the whole universe, there’s no meaning that’s verifiable by everyone. H/T R. Crumb:
Schuman the Human: Mr. Natural! What does it all mean?!
Mr. Natural: Don’t mean shit.
But seriously, is knowledge, i.e. “justified true belief” (https://plato.stanford.edu/entries/knowledge-analysis/), wholly meaningless? Not, IMHO, if one assumes a real world exists, independently of one’s internal model. Science is neither divine nor magical revelation, it’s just the only way humanity has found for describing, explaining and predicting reality that’s more productive than divination with scorched turtle plastrons (https://en.wikipedia.org/wiki/Oracle_bone). Nevertheless, science appears to show a relatively reliable correspondence between the shadows and the world outside the cave, that we call space-time. The accumulation of intersubjectively verified, self-correcting, self-extending knowledge will always be constrained by our cognitive limitations, but is only “nothing” when measured against all that’s as yet unknown or unknowable. And yes, people “knew” things before Copernicus, but “nothing” compared to what we now know, and much of it not justified by truth. They did get us to the printing press, at least, and the rest is history :^)!
So, if one rejects cosmic teleology, there is no “objective” meaning in the largest scope. Yet what’s the meaning of the wordless wonder and awe I feel when I contemplate all that science has learned, far beyond what I know personally? Simply reflect, if you will, on what’s known about the origin and evolution of literally everything, over approximately 13.7 gigayears: don’t you get a frisson? A lot has happened in that time, but it’s not too long for educated minds to imagine as we walk in humility through the world, witnessing the beauty and grandeur of existence directly, and freely indulging our child-like curiosity. And I, for one, find comfort, if not “meaning”, in my faith that the cosmos will still exist as I’ve perceived it once I’m gone, proceeding on its pre-determined trajectory through gigayears to come. Verily I say unto thee: solipsism is a trap for the unwary!
Good talk, z, but enough tail-chasing. Sorry, y’all, I’ve been waxing philosophical lately.
Mal: “My ecological education has brought me joy as well as sorrow. […] “For in much wisdom is much grief: and he that increaseth knowledge increaseth sorrow.”
Zebra: “ I don’t know that I agree with the bible stuff. The more “knowledge” I have gained, the more I have come to understand that that knowledge is meaningless.”
Mal and his “bible stuff” countered a naive extreme (knowledge will give us unqualified happiness). Your response goes to the opposite, cynical extreme – “ I have come to understand that that knowledge is meaningless”
Zebra: “Physics teaches us that ultimately, we are all in Plato’s cave. We measure the shadows, and give them names, and predict their dance. Meh.”
We may all live in Plato’s cave, but our (and Bohr’s?) conclusions from that are opposite to yours – since these shadows are the only reality we will ever know, and because our life in that reality depends on these shadows – the science’s value and duty lies in understanding the behaviour of these shadows, and in advocate actions that would change shadow world we inhabit for the better for us.
For you, as for any fundamentalist, it is “all or nothing” – either we have a God-like perfect knowledge – anything short of such perfect knowledge meaningless, and in fact – deludes us. For me – the perfect is the enemy of the good.
For you there are only two states of the Schrodinger’s cat – dead or perfectly healthy, nothing in between. In my world the Schrodinger poison may not work as advertised:
so if the cat is, to use the Princess Bride terminology, only “mostly dead”
I the only world we can function – I take the cat to Miracle Max to bring it back to life, you are going through its clothes and look for loose change..
jgnfld,
I wasn’t thinking of Bohr, but… read my last sentence; look at his coat of arms.
I think he might understand meh as a condensed version of the book.
Nigelj: That quote is very true. I read a university textbook on the fundamentals of geology a couple of years ago, just out of interest and because I’m retired so I have the time. Very long and detailed, but extremely rewarding and a real eye opener on what really goes on under our feet.
Thanks Nigel, you get it. Are we allowed to pity the incurious and unmoved?
BTW, y’all, I can’t recommend the “Western” cultural phenomenon of retirement strongly enough either! Too bad you usually have to get old first, but from my POV a net positive compared to, say, two hundred years ago. The shoulders of giants, you know.
Ray.. Apparently you didn’t read for comprehension what I wrote earlier…
“Urgent climate actions like reducing emissions rapidly toward zero will take none of the CO2 already added out of the atmosphere to lower global temperatures. What that does is leave carbon in the ground and make it more difficult to finish the energy transition to renewables and EVs. It’s simply not possible to get to an electrical world without using vehicles that run on gasolines and renewable biofuels to make it happen. Name and blame calling notwithstanding. The implications are obvious. Atmospheric CO2 will continue to increase. There is no way around this reality..”
That is not a “straw-man” argument or a “non-issue” It’s an undeniable fact,. thoughtful policies notwithstanding.. Hastening the change will make it worse. because more fossil fuels will be used faster as an increasing number of people (already at ~eight billion) need more energy.
KT: That is not a “straw-man” argument or a “non-issue” It’s an undeniable fact,. thoughtful policies notwithstanding.. Hastening the change will make it worse. because more fossil fuels will be used faster as an increasing number of people (already at ~eight billion) need more energy.
BPL: No matter how many times you say it, it still won’t be true.
KT: It will continue because we need fossil fuels to complete the transition to renewable and EVs.
BPL: Less and less each year.
Indeed. Here’s a thoughtful analysis (with references) of renewable energy by a Nobel Laureate in economics:
https://paulkrugman.substack.com/p/the-rise-of-renewable-energy
Steven Emerson: https://paulkrugman.substack.com/p/the-rise-of-renewable-energy
Thanks, I think Krugman is wise, but I didn’t get very far before hitting the substack paywall. I almost subscribed, but thought better of it before clicking ‘submit’. I’ll rely on y’all to tell me for free what he says, beyond “renewable energy is the future”. I know that already!
Susan, I did notice that Krugman’s first graph contained hover-text: “a graph showing the growth of electricity” followed by “AI-generated content may be incorrect”. Every human pundit should be so conscientious 8^)! FWIW, I entered the following request into ChatGPT’s Post-Comment Reply Generator, paraphrasing Krugman’s plot title:
“draw a line graph of the percent of global energy supplied by non-hydro renewables over time since 2000.”
The result was a plot very similar to Krugman’s, supplemented with a few bullet paragraphs of highlights and details, and hedged with multiple caveats. I, for one, am provisionally confident in it as shown. Seriously, if it’s good enough for him, I can hardly do better. YMMV.
Mal: My mileage varies to the point of offense when excuses for using chatgpt enter the conversation. There are jobs which require these enhancements, but imnsho comments here at RC are not one of them. Also, I don’t need anyone to check Krugman’s work, even to affirm it. I know. people love their toys, but this one is destructive to an extreme, considered objectively in the bigger picture. Replacing ourselves with machines is a lousy plan. It’s even worse for kids. A machine is not a human and these mechanical devices follow their master’s orders.
Mal,
Odd. I subscribe to Krugman’s Substack but don’t pay. I can’t see everything he posts, but I can see the referenced one.
I did submit my email address, however. in order to create a Substack account. It didn’t require payment.
Krugman makes enough money that he makes most of his stuff available whether one subscribes or not–just with a delay in some cases. Being a Nobel Laureate has some perks. Financial independence is one of ’em.
SE: I did submit my email address, however. in order to create a Substack account. It didn’t require payment.
Heh. Turns out I went far enough in the subscription process that it got my Mal Adapted email address. Now I seem to have access to all his posts. I’m quite happy to have been wrong!
Steven Emmerson: I ‘subscribed’ to Krugman’s substack. When I get a notification on my email, I ‘heart’ it and then ‘read’. Some are paywalled, but this was not. I like that they are short, and I often enjoy his musical recommendations as well.
Dang, spoke to soon. I’m still up against a Substack pay wall on my desktop computer. I can download a smartphone app if I want. I don’t want.
Mal: You can subscribe to Krugman’s substack. You will then be able to get in to his free ones. It’s a new month, so this should be possible. [see my other note about getting in via daily email notifications]
A new study on the AMOC published 17 October 2025 seems relevant: Equatorial Atlantic mid-depth warming indicates Atlantic meridional overturning circulation slowdown, Qiuping Ren, Shang-Ping Xie, Qihua Peng, Yuanlong Li & Fan Wang, Communications Earth & Environment volume 6, Article number: 819 (2025)
Abstract
Climate models project an Atlantic Meridional Overturning Circulation slowdown under anthropogenic greenhouse warming. Despite a ~1.5 °C increase in the global mean surface temperature, debate remains on whether and when this circulation has slowed. Here we identify a distinctive temperature fingerprint in the equatorial Atlantic that signals the Atlantic Meridional Overturning Circulation change through numerical ocean model experiments. The equatorial Atlantic is a crucial crossroads for the circulation anomalies to propagate to other oceans. A slowdown drives a mid-depth (1000–2000 m) warming in the equatorial Atlantic in a decade via baroclinic Kelvin waves. Analysis of climate models shows that this mid-depth temperature change is a better indicator for Atlantic Meridional Overturning Circulation change on decadal and longer timescales than other surface proxies. Observations reveal a robust mid-depth warming since 1960 that emerged from natural variability in the early 2000s, suggesting a slowdown that already started in the late 20th century.
https://www.nature.com/articles/s43247-025-02793-1
The Paris Agreement ten years later: – It has been an incredibly uplifting journey
A lot is going wrong on the climate front. But if you put on the 2015 glasses, several solutions have come faster and more powerfully than experts expected.
Several climate initiatives have surprised with faster progress than expected since the Paris Agreement in 2015. World emissions have slowed, and we are now heading towards 2.6 degrees of warming instead of 4 degrees.
Renewable energy has reached record highs. Solar and wind power have exceeded expectations. The renewable sector has doubled employment in the last decade.
Electric car development has progressed faster than expected. The goal of 100 million electric cars will probably be reached three years ahead of schedule.
https://www.aftenposten.no/verden/i/3MlRld/ti-aar-siden-paris-avtalen-om-klima-her-er-tre-ting-som-har-gaatt-mye-bedre-enn-ventet
Good points and a useful perspective, Martin. That said (and looking beyond my usual habit of focusing on the challenges here in the U.S.), the number of nations who are not meeting this moment is troubling.
The following recent news articles (courtesy of The Guardian and Politico E&E News Climate Wire) outline a concerning big-picture. Yes, much progress these last few years. Doesn’t change the reality we (mankind) are not moving fast enough:
“World’s climate plans fall drastically short of action needed, analysis shows
Recent plans submitted to UN by more than 60 countries would cut carbon by only 10%, a sixth of what is needed”
Fiona Harvey Environment editor
Tue 28 Oct 2025 03.00 EDT
https://www.theguardian.com/environment/2025/oct/28/worlds-climate-plans-fall-drastically-short-of-action-needed-analysis-shows
“‘Change course now’: humanity has missed 1.5C climate target, says UN head
Exclusive: ‘Devastating consequences’ now inevitable but emissions cuts still vital, says António Guterres in sole interview before Cop30”
Johnathan Watts and Wajã Xipai
Mon 27 Oct 2025 20.01 EDT
https://www.theguardian.com/environment/2025/oct/28/change-course-now-humanity-has-missed-15c-climate-target-says-un-head
“100 countries stall on climate targets ahead of COP30”
By Sara Schonhardt | 10/27/2025 06:51 AM EDT
https://www.eenews.net/articles/100-countries-stall-on-climate-targets-ahead-of-cop30/
As long at the planet spins, there will be ocean ciruculation. Weakened or not, they will always exist.
And your point, mcpan, would be …?
With the circulation systems influenced by the BCs set by the presence of stationary land masses on the spinning planet.
https://youtu.be/HKBTZ324COA?si=04dPla_gG2NL
Blimey Stefan, this is deadly serious
Pete Best, thank you for the link to the updated Rahmstorf. Very useful.
I was reminded of this old chestnut, perhaps a little exaggerated towards the end (not long), from 2013. Hank Green (SciShow) creates a lot of interesting posts on a variety of subject, accessible to even math challenged people like me.
https://www.youtube.com/watch?v=wB4br_nDHnQ
Hi Susan, when I tried your link it took me to a Willy Nelson “The Wall” recording, which I actually enjoyed lol. The album cover photo of ole Willy made me smile, I don’t recall (or have forgotten) ever before seeing a picture of him when he was a young pup.
Well, it’s coming up on 4:20, so gotta go… ;-)
LOL!! Uh, that would be Willie Nelson, not Willy Nelson. And the song is “Hello Walls,” not “The Wall”
Can’t imagine what caused that ;-)
David/Pete Best:
Oops. The Willie Nelson is great, but this is what I meant to post: Hank Green SciShow from 2012:
https://www.youtube.com/watch?v=M2Jxs7lR8ZI
Hi Dr. Rahmstorf,
Please consider adding to this post of yours the link of your presentation that commenter Pete Best provides above. I think your presentation in the video was excellent and importantly done in a manner that is easily digestible by interested members of the general public. At 15 minutes, it’s both short and yet hits hard. Thank you again for this post and all your important work on the AMOC!
And Pete Best, thank you so much for providing the link. Nice job!
In regard to the above post on the AMOC and its tipping point (non linear response to rising GHG emissions). the IPCC seems to be the biggest barrier to acceptance of this non linear tipping point seeing the changing climate as simply linear and hence we have plenty of time to fix these things (reduce emissions sufficiently) and stop the AMOC from stalling.
The political and economic input from major nations appears to be watering down the science and the scientists, fair critique?
Pete Best, in no particular order: The political and economic input from major nations appears to be watering down the science and the scientists, fair critique?
No. Undermining the IPCC, subtly or otherwise, is a known obstructionist tactic. Specious appeals to fairness don’t make disinformation truer.
The IPCC tracks the dynamic consensus of specialists. Their formal updates are snapshots of whatever consensus view can be identified at that time. They are subject to review by national governments. That contributes to scientific reticence, which some might call “watering down”. While the IPCC’s output may be conservative, the scientific contributors themselves aren’t watered down in the least, because they’re already restrained by mutual peer discipline. Their published findings are nonetheless sufficiently alarming for any climate realist!
PB: In regard to the above post on the AMOC and its tipping point (non linear response to rising GHG emissions). the IPCC seems to be the biggest barrier to acceptance of this non linear tipping point…
Acceptance by whom? Sure, a long-term weakening of heat transport by the AMOC would be bad news for the global economy and especially Europe. But the news is plenty bad enough already! Ironically, press releases about this summer’s deadly European heat waves, e.g “Summer heat deaths in 854 European cities more than tripled due to climate change”(https://www.imperial.ac.uk/grantham/publications/all-publications/summer-heat-deaths-in-854-european-cities-more-than-tripled-due-to-climate-change.php), signal that the AMOC is still transporting excess heat retained by fossil carbon emissions poleward from the tropics, seemingly unabated. It was a tipping point alright for the attributable dead, even if many Americans don’t hear about it.
Specific climate-change mortality aside, the biggest barrier to global decarbonization isn’t the science but the US government’s capture by the petro-plutocracy. The first official US recognition of the need to act collectively against open-ended global warming was enacted in 2022, 34 years after Jim Hansen’s announcement to Congress. Our preposterous current POTUS took us back to official denial, but he was elected by just 1.5% of the popular vote. And with enough headlines like the above, the next election may well be our political tipping point.
PB:: …seeing the changing climate as simply linear and hence we have plenty of time to fix these things (reduce emissions sufficiently) and stop the AMOC from stalling.
The changes may be accelerating, but they’re more than alarming enough even if they’re linear. It’s already too late for 16,500 people in 854 European cities. Only motivated lukewarmers, not the IPCC, say we have plenty of time to cap the accumulation of global heat, and prevent local and regional catastrophes from growing and proliferating without bound.
I will ignore Stefan’s 20 year warning and stick to the IPCCs end of century one then as uncertainty is not your friend but it can be.
Pete Best: – “I will ignore Stefan’s 20 year warning and stick to the IPCCs end of century one then as uncertainty is not your friend but it can be.”
Would you get on a plane with a 25% chance of crashing? Or enter a building or cross a bridge with a 25% chance of collapsing? That’s apparently the same current odds (for low emissions and worse for intermediate and high emissions scenarios) for the shutdown of the AMOC, according to Professor Stefan Rahmstorf, who warned at ATLAS25 that:
“So, if we continue on a high emissions path, that is like, almost certain that will shut down the AMOC. Overall, if we, yeah, if we take all the models, that is more than 50, and look at the probabilities: which ones shut down; which ones don’t shut down the AMOC; then with high emissions, then 70% of them actually have a, a shutdown, that includes those that haven’t been continued beyond 2100, but where we conclude the AMOC is so weak that it basically is beyond the tipping point, and would have shut down, had these people continued their model simulations.
Uh, for intermediate emissions, uh, we now have a 37% risk of shutdown, and even the low emissions is sticking to the Paris Agreement, uh, we still have a 25% chance of shutdown.
And I, I have studied the AMOC stability question since 1991 – almost 35 years now – and for 30 of those years, we have all in the community considered that a low probability but high impact risk – probability less than 10% – I have always argued that is far too high. I mean, would you board a plane that has a 5% chance of crashing? Probably not. So, um I always argue we need to do something about this even if the risk is only 5%. Now, that is the best probability estimate that we have, and, um, I was shocked when I first saw those results. I’m a, I’m a co-author on that paper, but when I was first shown these model results, uh, I was really shocked. And I have, uh, just mentioned I have been at the Nordic Tipping Week and we have seen new results that mean that probably the real probabilities are higher, because people have tested which of these many models look the most realistic compared to observational data. And unfortunately the kind of good models, the most realistic ones are the ones where the AMOC weakens most. And that’s why this is the probability across all models whether good or bad. And if you just take the good models even for immediate, intermediate emission scenario the probability of shutting down the AMOC is way above 50%. That is really depressing. I’m sorry about that.”
https://youtu.be/HKBTZ324COA?t=621
A shutdown of the AMOC would likely put a large part of European agriculture out of business!
Are you willing to gamble on that one, Pete Best? I hope your comments were being sarcastic. Yes?
But it seems to me there are some commentators here at RC that apparently demand a much higher certainty (i.e. at least 95% confidence) before accepting there’s a real threat.
Meanwhile, in the 21 Nov 2025 communication by James Hansen, Pushker Kharecha and Dylan Morgan, it included:
http://www.columbia.edu/~jeh1/mailings/2025/ColorfulChart.21November2025.pdf
Provocative stuff!
Geoff Miell: “ Would you get on a plane with a 25% chance of crashing? Or enter a building or cross a bridge with a 25% chance of collapsing?
A shutdown of the AMOC would likely put a large part of European agriculture out of business! Are you willing to gamble on that one, Pete Best? I hope your comments were being sarcastic.
you think? ;-)
See also:
“Are you willing to gamble on your “modest proposal”, Dr. Swift? Feeding children of the poor to the rich could be very bad! Eating humans may spread diseases like the kuru. Would you take that risk, Jonathan Swift? I hope your “modest proposal” was being sarcastic.”
I suggest you not try actuarial science as a career.
PB: I don’t think it’s wise to ignore Stefan Rahmstorf. But I don’t think a careful review of what he’s presenting is as simple as ’20 year warning’. Being dismissive of one of the world’s best specialists doesn’t dismiss the information. The IPCC, by its nature, is conservative.
I too am hesitant to adopt the shorter timeframe, but willing to accept that we are very close to tipping points on a variety of aspects of these and other problems (toxic waste is something I tend to lump in, along with human obstinacy and the evangelism of extreme wealth), the definition of which is the point at which there is no turning back.
Tipping points are not end points; like problems with geological vs. human time and scale, this is something we often fail to widen our perception biases to include.
—
Unrelated general comment: I wish people would abandon the idea that Hansen is at daggers drawn with the rest of the scientific and knowledge community. I don’t believe he is. IMHO, he’s trying to get us all to find a way to pry open the minds of the stubbornly resistant who hold the power to do stuff.
The IPCC is conservative by its very nature of having to take into consideration economic and political factors which mean if one set of people tell you it’s 75 years before the AMOC is going to be a problem and another say mid century I’d suggest that the IPCC is immediately going to side with the time to do something about it.
The science had been mostly ignored for the past 50 years and the IPCC isn’t making much headway as yet. The world simply isn’t ready for a major earth system organ to fail within 20 years. The implications of a failing AMOC are so profound and far reaching that its means we arnt ready for climate impacts of this nature.
I was trying too see if the current droughts in the Middle East are linked to the slower AMOC. AI tells me they are and Paul Beckwith has done a video on the same subject. It appears to me that the AMOC 15% degradation is already having some impact .
Pete Best: Paul Beckwith is not a reliable resource (another demerit for AI/Google); he often turns up in searches too), as he has been known to exaggerate and make wild predictions/assertions. He has provided fuel for those who point at ‘alarmist’ exaggerations to claim the whole is false, and others who just throw up their hands in despair and/or or claim we *must* have geoengineering* now. I’m sorry I can’t address possibility of a teleconnection with middle east droughts, but the geography is wrong for AMOC. [I’m sorry I gave you Willie Nelson by mistake instead of Hank Green’s staggering scare piece from 2013.]
— [partly related, I think I posted this elsewhere]
Elizabeth Kolbert: https://archive.ph/Y1qm9
“The gloomy arguments for geoengineering are compelling. So are the even gloomier counter-arguments. Among the technology’s many possible side effects are shifts in regional weather patterns and the disruption of monsoons that hundreds of millions of people depend on. ….
“Another geoengineering downside—and it is a deep one—is its duration. Were the world, or any subdivision of it, to embark on a campaign of “sunlight reflection,” the scheme would have to be continued more or less indefinitely. After a volcanic eruption, reflective droplets fall out of the stratosphere within a few years. The same, presumably, would hold for any man-made particles, meaning that these would have to constantly be replaced: if they weren’t, temperatures would suddenly shoot up, a prospect that’s become known as “termination shock.”
“Finally, and most important, solar geoengineering is not a solution to climate change. It’s a way—once again, in theory, at least—to depress global temperatures. But the technology does nothing to deal with the underlying problem, which is CO2 emissions. Using it to counter the effects of warming while carbon emissions continue to rise is a bit like cranking up your thermostat and then turning on the A.C.”
—
That said, if there is one person here who makes sense of geoengineering, it is Russell Seitz.
Susan
Yes indeed, I was being sarcastic. the 44 scientists who wrote the letter to the Nordic Council and the 2025 climate report state:
Climate Report 2025:
Risks to the Atlantic meridional overturning circulation
The Atlantic meridional overturning circulation, a major system of ocean currents that regulates global climate, is showing signs of significant weakening and emerging evidence points to greater and earlier tipping risks than previously recognized (Rahmstorf 2024). If the Atlantic meridional overturning circulation collapses, it could trigger abrupt and irreversible climate disruptions, including drastic shifts in regional weather patterns, intensified droughts and floods, and reduced agricultural productivity in key regions (Schaeffer et al. 2025). For example, Atlantic meridional overturning circulation collapse could lead to more intense cold extremes in Northwestern Europe (van Westen and Baatsen 2025). Because the Atlantic meridional overturning circulation is deeply interconnected with other climate tipping elements such as the large ice sheets on Greenland and West Antarctica, as well as the Amazon rainforest or the Subpolar Gyre, its collapse could also initiate cascading tipping events, amplifying the impacts to a catastrophic level (Wunderling et al. 2024). These impacts may already be occurring; for instance, between 2005 and 2022, up to half of the flooding events along the northeastern US coast may have been driven by Atlantic meridional overturning circulation weakening (Zhang et al. 2025).
open letter to the Nordic Council – https://en.vedur.is/media/ads_in_header/AMOC-letter_Final.pdf
it states:
Regarding the risk of tipping the ocean circulation in the Atlantic, the IPCC concludes that “there is medium confidence that the Atlantic Meridional Overturning Circulation will not collapse abruptly before 2100, but if it were to occur, it would very likely cause abrupt shifts in regional weather patterns, and large impacts on ecosystems and human activities.” 4
Recent research since the last IPCC report does suggest that the IPCC has underestimated this risk and that the passing of this tipping point is a serious possibility already in the next few decades6-9.
It does point out uncertainties in the next paragraph but overall points to it being worse than the IPCC AR6 states
Pete, the problem is that nobody cares, and all the models and graphs are not going to convince anyone to care. I made a comment on the “Climate Literacy” post that included the sentence:
“Just a visceral sense of how the details (the weather) relate to the global change in energy long term, and what the challenges of describing it might be like.”
This was not received too well, but I think scientists have to be more realistic in how they communicate. Stefan did a nice job pulling all that stuff together, and I understood it perfectly fine. But what tiny percent of the population… and I include the well-educated, even in science and math… is going to “viscerally” respond to some abstract probabilities about abstract consequences far in the future?
People respond to things that they can relate to. Putting aside the venal motives of many politicians, what are even the conscientious ones supposed to say to their constituents, even if IPCC endorses the science?
I’m not suggesting the world will wake up in time.
https://crooksandliars.com/2025/11/times-study-says-were-risk-new-ice-age
This article is also seemingly telling the same story as Stefan is trying to communicate. The IPCC next report AR7 isn’t until 2029 so it will be interesting to see what they say but I guess it won’t be any different
“A crucial system of ocean currents may be on course to collapse. This country just declared it a national security threat”
By Laura Paddison
11/15/2025
https://www.cnn.com/2025/11/15/climate/iceland-warming-current-amoc-collapse-threat
Not sure I understand why the peoples of Europe aren’t yelling at the world about this. And why in the world did their leaders buckle under to TACO and agree to purchase $750 Billion (1) in U.S. energy by 2028?
(1) https://www.whitehouse.gov/fact-sheets/2025/07/fact-sheet-the-united-states-and-european-union-reach-massive-trade-deal/
David, you might enjoy this, Hank Green again: One has to plow through some intro and advertising, but he’s very very good on the science and geography, focused on Ireland, which is very exposed to AMOC.
https://www.youtube.com/watch?v=pThcIgJyNME
David, this guy seems to know what he is talking about:
https://www.realclimate.org/index.php/archives/2025/10/high-resolution-fingerprint-images-reveal-a-weakening-atlantic-ocean-circulation-amoc/#comment-842239
Does the last paragraph answer your question?
Susan: Yeah, now see those two Hank Green videos present their respective topics in a way I think I could find useful sometimes. Like most things, depends on my audience I think. And on the person advocating. I’m guilty of occasionally forgetting not every tool will work for everyone.
Zebra: The guy does seem to believe in his position, I’ll give you that ;-)
Interesting experiment looking at the AMOC published a couple of weeks ago in the journal Science Advances:
“Meltwater from West Antarctic ice sheet tipping affects AMOC resilience”
SACHA SINET https://ORCID.ORG/0000-0001-7588-2050, ANNA. S. VON DER HEYDT https://ORCID.ORG/0000-0002-5557-3282, AND HENK A. DIJKSTRAAuthors Info & Affiliations
SCIENCE ADVANCES
14 Nov 2025
Vol 11, Issue 46
DOI: 10.1126/sciadv.adw3852
https://www.science.org/doi/10.1126/sciadv.adw3852
In the “Discussion,” this following bit left me (a layman) with a question:
“Our results clearly demonstrate that the AMOC stabilization driven by WAIS meltwater fluxes is not only present in conceptual models, but can also be found in EMICs. Although the exploratory nature of our study did not permit the use of high-resolution models such as those in the sixth phase of the Coupled Model Intercomparison Project (CMIP6), the use of the well-established EMIC CLIMBER-X provides confidence in the representation of the simulated processes.”
My question is: why would the “exploratory nature of our study,” not permit the use of the high-resolution CMIP6 models?
[Response: A 5000 yr long simulation would take about 3 years to run with CMIP-class models. – gavin]
Lol, yeah, a 3 year run time would be a bit of a wait. Thanks Gavin.