 One of the most visually compelling examples of recent climate change is the retreat of glaciers in mountain regions. In the U.S. this is perhaps most famously observed in Glacier National Park, where the terminus of glaciers have retreated by several kilometers in the past century, and could be gone before the next century (see e.g. the USGS web site, here, and here). In Europe, where there is abundant historical information (in the form of paintings, photographs, as well as more formal record-keeping), retreat has been virtually monotonic since the mid 19th century (see e.g. images of the glaciers at Chamonix). These changes are extremely well documented, and no serious person questions that they demonstrate long term warming of climate in these regions. New work published in Science (“Extracting a Climate Signal from 169 Glacier Records”) highlights these results, and uses them to make a new estimate of global temperature history since about 1600 A.D., which agrees rather well with previous, independent temperature reconstructions.
Un des exemples les plus irrésistibles visuellement du récent changement climatique est le recul des glaciers dans les régions montagneuses. Aux Etats-Unis, c’est peut-être ce qui est le plus fameusement observé au Glacier National Park où les terminus des glaciers se sont retirés de quelques kilomètres au cours du dernier siècle (voir e.g. le site web de USGS, ici, and ici)ici et ici). En Europe, où il y a des informations historiques importantes (sous la forme de peintures, photographies, aussi bien que sous forme d’enregistrements plus formels), le recul a été virtuellement monotone depuis le milieu du 19ème siècle (voir e.g. images de glaciers à Chamonix). Ces changements sont extrêmement bien documentés si bien qu’aucune personne sérieuse ne doute que cela démontre le réchauffement à long terme du climat dans ces régions. Un travail récent publié dans Science (“Extracting a Climate Signal from 169 Glacier Records”) souligne ces résultats et les utilise pour faire une nouvelle estimation de l’histoire globale des températures depuis environ 1600 A.D., et qui est en assez bon accord avec les précédentes reconstructions indépendantes de la température.
(suite…)
![]()
Of course, as we frequently remind readers on this site, changes in one particular region do not necessarily translate to worldwide trends. That is why the work of such groups of scientists as the World Glacier Monitoring Service, which compiles observations on changes in mass, volume, area and length of glaciers, is important. From the compilations of WGMS (and many other groups and individuals), we know that glacier retreat is in fact an essentially global phenomenon, with only a few isolated (and well understood) counter-examples, such as western Norway. The figure at right shows an example from WGMS, as published in the 2001 IPCC report. (Click on the figure for details). The photos at left show South Cascade Glacier in Washington State in 1928 and 2000.
What causes glaciers to retreat like this? With the exception of glaciers that terminate in the ocean, and glaciers in the polar regions or at extreme high altitudes where the temperature is always below freezing, essentially just two things determine whether a glacier is advancing or retreating: how much snow falls in the winter, and how warm it is during the summer.
For typical glaciers in mid latitudes, the role of temperature is generally more important than winter precipitation. This is because a bit of extra heat in summer is a very efficient way to get rid of ice. A 1°C increase in temperature, applied uniformly across a glacier, is enough to melt a vertical meter of ice each year. For typical mid-latitude glaciers, winter snow accumulation is on the order of 1 m/year (ice equivalent — or about 3 m of snow). On balance then, a 1°C rise in summer temperature has roughly the same effect as a year in which no snow accumulates. Put another way, for every degree rise in summer temperature, an extra meter of ice-equivalent would be required to offset the extra loss. (This makes it clear why glaciers in coastal Norway are not as strongly influenced by temperature – at these locations, winter precipitation typically exceeds several ice-equivalent meters per year). To give another, more specific example, at a typical glacier on Mt. Baker, in Washington State, a summer temperature increase of 1°C translates to a ~150 m increase in the altitude of the equilibrium line (the point where annual ice accumulation = annual loss), and a resulting ~2 km retreat of the glacier terminus. The same change, if driven by winter precipitation, would require about a 25% decrease in local precipitation at this site.
What all this means is that glaciers comprise a rather nice “proxy” for climate change in general, and for temperature change in particular. Glaciologists have for many years used this fact to make estimates of temperature change from records of glacier change. This work received an important update in the journal Science, with the publication of a paper by J. Oerlemans, of Utrecht University. Oerlemans’s paper does three useful things. First, it provides a compilation of global trends in glacier terminus positions since 1600 A.D. Second, it uses this compilation to create a new estimate of global temperature change. Third it provides an estimate of uncertainties on the temperature estimates, taking into account plausible changes in winter precipitation.
Oerlemans’s reconstruction of global temperatures (largely from mid latitude glaciers) is entirely independent of the much talked about temperature records from other paleoclimate proxy data (e.g. Moberg and others, Mann and others, Crowley and others). Yet Oerlemans’s findings basically agree with the earlier results, as shown in the figure, below. Indeed, the reconstruction of temperature from glacier data is notable for having a rather distinctive “hockey stick” shape, the aspect of the original Mann, Bradley & Hughes reconstruction that seems to attract the most attention and criticism. This poses a substantial challenge to those who have dismissed the “hockey stick” as due to biases or errors. Some will of course quibble with this perspective, because the data prior to the 19th century are rather sparse. (Only a few records go back to the 17th and 18th centuries). However, the “hockey stick” shape is clearly in the data, from both the Northern and Southern hemispheres (see for example the data for Grindelwald, d’Argentière, and Franz Joseph in the figure at right).
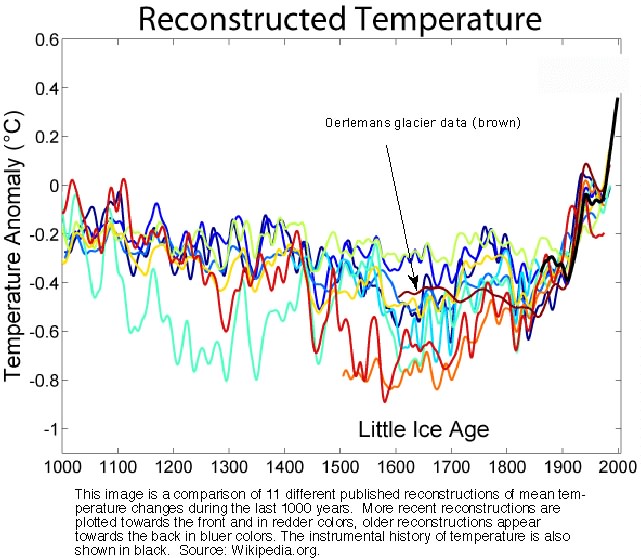
Figure shows comparison of the Oerlemans reconstruction with those of Mann et al. 1999, and Moberg et al., 2005. Click on the figure for comparisons with other temperature reconstrutions.
A few comments:
First, the exact relationship between a glacier and temperature is a bit more complex than implied above, and also depends on the glacier geometry and aspect (which direction it is facing), and on radiative as well as sensible heat fluxes. (The difference between radiative and sensible heat fluxes may be thought of as the difference between the ambient temperature is, and how intense the sun is. We all have had the experience of feeling warmth when sitting in the sun on a day when the air temperature is quite cold. Glaciers experience the same thing.) Oerlemans addresses this by using a simple linear model that relates the glacier length to temperature, with adjustments for the glacier geometry and the local annual precipitation for each glacier. It should be noted that a lot of work was required to do these calculations, much of it presumably by Oerlemans’s student L. Klok. Many of the details are not given in the paper due to the short space provided by Science, but all the information most will want is in the online Supplemental Data on the Science website. (If you want more, see the paper by Klok and Oerlemans in The Holocene.)
Second, Oerlemans’s reconstruction doesn’t say anything about the ongoing debate of whether the “Medieval warm period” was as warm as today. Certainly there is evidence that some glaciers were as small or smaller than they are today at some locations, around 1000 years ago. However, the extent to which the “Medieval warm period” was a pervasive, essentially synchronous retreat of glaciers worldwide (as is happening now) is still open to question (see e.g. Bradley et al., 2003).
Finally, Oerlemans’s work doesn’t address whether or not the worldwide glacier retreat is part of a “natural” phenomenon. Indeed, the fact that glaciers were generally more advanced in the 19th century than they are today is exactly what gave rise to the term Little Ice Age (coined by a newspaper reporter in California, writing about F.E. Matthes work on glaciers in the Sierra Nevada). Again though, the evidence that the Little Ice Age advances were as synchronous worldwide as the current glacier retreats are today is sketchy.
In any case, what Oerlemans’s paper does very well is to demonstrate (one more time) what we already knew: global temperatures have risen more than 0.5 degrees C in the last century (up to 1990 — we don’t yet have a compilation of the latest data). As Oerlemans points out, the only way for this to be substantially in error is if there has been worldwide decreases in summertime cloudiness (by 30% or so!), or in winter precipitation (by 25%!). There is no evidence for either of these changes occurring, and if there were, it would be a remarkable discovery in and of itself.
![]()
Les photos à gauche montrent le South Cascade Glacier dans l’état de Washington en 1928 et en 2000. Quel événement peut causer un tel recul des glaciers ? À l’exception des glaciers qui se terminent dans l’océan et des glaciers des régions polaires ou à des altitudes extrêmement élevées où la température est toujours sous le point de congélation, seulement deux choses déterminent essentiellement si un glacier avance ou recule : quelle quantité de neige tombe l’hiver et la température durant l’été.
Pour les glaciers typiques des latitudes moyennes, le rôle de la température est généralement plus important que celui des précipitations hivernales. Ceci est dû au fait qu’un peu de chaleur en plus en été est une manière très efficace de se débarrasser de la glace. Une augmentation de 1°C de la température, appliquée uniformément sur un glacier, est suffisante pour fondre une couche d’un mètre de glace chaque année. Pour les glaciers typiques des latitudes moyennes, l’accumulation hivernale de neige est de l’ordre de 1m/an (équivalent en glace – soit environ 3 m de neige). Ainsi, une augmentation de 1°C l’été a à peu près le même effet qu’une année pendant laquelle aucune neige ne s’accumule. Dis d’une autre manière, pour chaque degré en plus de la température estivale, un mètre supplémentaire d’équivalent glace serait requis pour contrer la perte. (Ceci rend plus clair la raison pour laquelle les glaciers de la côte norvégienne ne sont pas aussi fortement influencée par la température – dans ces endroits, la précipitation hivernale excède typiquement quelques mètres d’équivalent glace par an). Pour donner un autre exemple plus spécifique, sur un glacier typique du Mt. Baker, dans l’état de Washington, une augmentation de la température estivale de 1°C se traduit par une augmentation ≈ 150 m dans l’altitude de la ligne d’équilibre (le point où l’accumulation annuelle de glace = la perte annuelle) et résulte en un recul de 2 km du terminus du glacier. Le même changement, s’il devait provenir des précipitations hivernales, nécessiterait une baisse d’environ 25 % des précipitations locales à cet endroit.
Tout ce que cela signifie est que les glaciers comportent un assez joli “marqueur” pour le changement climatique en général et pour le changement de température en particulier. Les glaciologues ont pendant de nombreuses années utilisé ce fait pour faire des estimations du changement de température à partir des enregistrements du changement des glaciers. Ce travail a reçu une importante remise à jour dans le journal Science avec la publicationd’un article de J. Oerlemans de l’université d’Utrecht. L’article d’Oerlemans apporte trois choses utiles. Premièrement, il fournit une compilation des tendances globales dans la position des terminus des glaciers depuis 1600 A.D. Deuxièmement, il utilise cette compilation pour donner une nouvelle estimation du changement global de température. Troisièmement, il fournit une estimation des incertitudes sur les températures en prenant en compte les changements plausibles des précipitations hivernales.
Les reconstructions d’Oerlemans des températures globales (largement à partir des glaciers de moyennes latitudes) sont entièrement indépendantes de ce dont on parle beaucoup au sujet des enregistrements de température à partir des données des autres marqueurs de paléoclimat (e.g. Moberg et al. , Mann et al. , Crowley et al.). Néanmoins, ce que trouve Oerlemans est fondamentalement en accord avec les résultats précédents, comme montré dans la figure ci-dessous. En effet, la reconstruction des températures à partir des données de glacier est remarquable pour avoir une courbe “crosse de hockey” assez distincte, l’aspect de la reconstruction originale de Mann, Bradley & Hughes qui semble attirer le plus l’attention et la critique. Ceci pose un défi substantiel pour ceux qui ont rejeté la “crosse de hockey” comme résultat de biais ou d’erreurs. Certains chicaneront sans doute avec cette perspective car les données avant le 19ème siècle sont assez clairsemées. (Seulement quelques enregistrements remontent aux 17ème et 18ème siècles). Cependant, la forme “crosse de hockey” est clairement dans les données à la fois pour l’hémisphère Nord et l’hémisphère Sud (voir par exemple les données pour Grindelwald, d’Argentière, et Franz Joseph dans la figure à droite).
La figure montre la comparaison de la reconstruction d’Oerlemans avec celles de Mann et al. 1999, et Moberg et al. 2005. Cliquer sur la figure pour des comparaisons avec d’autres reconstructions de température.
Deuxièmement, la reconstruction d’Oerlemans ne dit rien sur le débat pour savoir si l'”Optimum climatique médiéval” était aussi chaud qu’aujourd’hui. Il est certain qu’il y a des évidences que certains glaciers étaient aussi petits ou plus petits qu’ils ne le sont aujourd’hui à certains endroits, il y a environ 1000 ans. Cependant, l’étendue sur laquelle l'”Optimum climatique médiéval” était un recul universel, essentiellement synchrone, des glaciers sur le monde (comme il se passe maintenant) est toujours soumise à question (voir e.g. Bradley et al., 2003).
Finalement, le travail d’Oerlemans ne commente pas si, oui ou non, le recul mondial des glaciers est une partie d’un phénomène “naturel”. En effet, le fait que les glaciers sont généralement plus avancés au 19ème siècle qu’ils ne le sont aujourd’hui, est exactement ce qui a donné du poids au terme “Petit Age Glaciaire” (inventé par un reporter d’un journal de Californie écrivant sur le travail de F.E. Matthes sur les glaciers de la Sierra Nevada). De nouveau, l’évidence que les avancées au Petit Age Glaciaire étaient aussi synchrones sur le monde entier que les reculs actuels de glacier le sont aujourd’hui, est schématique.
Dans tous les cas, ce que l’article d’Oerlemans fait très bien est de démontrer (encore une fois) ce que nous savions déjà : les températures globales ont augmenté de plus de 0,5 °C au cours du dernier siècle (jusqu’en 1990 – nous n’avons pas encore une compilation des dernières données). Comme Oerlemans le souligne, la seule manière que cela soit substantiellement dans l’erreur est s’il y a eu une baisse mondiale de la couverture nuageuse estivale (de 30% ou plus !) ou des précipitations hivernales (de 25 % !).Il n’y a aucune évidence pour l’un de ces changements et, s’il y en avait, ce serait une remarquable découverte en soi.
There’s been a lot in the news lately about the alleged effects of warming on the snowcap of Kilimanjaro, but another resource pointed me in the direction of this study by Mölg, Hardy, and Kaser, which suggests that
Perhaps someone more intelligent than I can explain to me how this paper jives with the above data (or if there’s a relationship at all).
[Response: See the comments from R. Pierrehumbert (#8), and my own (#16) below. -eric]
I haven’t read the Science paper yet, but an obvious question pops to mind on aspect: is albedo figured in? I’ve only stood on a couple of glaciers, but they were both surprisingly dirty. Of course, not all of the radiation absorbed by the dirt coating will ultimately be transmitted to the ice.
Rod has a point. However a retreating glacier is likely to look extra dirty because the embedded particulate material gets more concentrated by shrinkage of its substrate. Think of a roadside snowbank in early spring.
Still, it seems plausible that human activity could lead to an increase in soot and dust deposits on glaciers. Also the stripping of forest cover from foothills might locally warm nearby peaks without necessarily implying global climate change. It’s worth noting that a lot of forests were cut before CO2 release rose to its current high level. I’d like to see someone study whether the 150-year history of alpine glacial retreat tracks more closely with reduction of mature forest near glaciers than it does with atmospheric CO2 levels.
[Response: Albedo is of course taken into account in any detailed calculation of the influence of climate on individual glaciers. It has not been done explicitly in the Oerelemans work, since there simply is not enough data from each glacier to permit this. I would be exceedlingly surprised if local deforestation is an important factor, either in terms of local dustiness or local temperature. Still, there is no question that increased dust on snow increases ablation (mass loss) (though if the dust/dirt cover becomes thick enough, it actually winds up lowering ablation rates through insulation). The way to study this globally would not be to try to compare trends in deforestation with trends in glaciers, which almost certaintly follow a similar trajectory for independent reasons. Rather, one would want to evaluate whether there is evidence of changes in dust of significant magnitude to account for the observed glacier variations. Calculations as to the magnitude of this effect (that is, how dust is needed to significantly decrease glacier albedo) certainly have been done, though probably not on a global basis. -eric]
A few remarks:
Evaporation by dryer air/more sunshine/less clouds may have played a role in several glaciers. A typical example is the Kilimanjaro glacier, where the shrinking is largely due to dryer air, caused in part by deforestation at the foot, in part also by general faster air circulation, which dried the upper air in the tropics.
Further, the largest retreat of world glaciers was in the 1900-1940 period, when GHGs played a minor role. A typical example: the Illulisat (Jacobshavn, Greenland) glacier, where the breakup point had it’s largest retreat in the 1929-1954 period. See: NASA. Similar conclusions can be made for more glaciers world-wide, where the 1940-1945 period shows the largest retreat. See: http://users.aber.ac.uk/daa04/response_of_glaciers.htm
Some glaciers (especially in Norway) even are advancing again since 1980-1990 (own observations, but see the graphs in the right upper corner of this page).
What’s your take on Kilimanjaro? Is it really melting (as Crichton claims) because of local deforestation, with no observed temperature increase? Thanks!
If glaciers are retreating in part due to soot from burning fossil fuels, then burning fossil fuels has a double whammy (it really has many other harms, as well). The implications for me is to reduce fossil fuel burning; whether it melts the glaciers through its soot or through GW is a secondary issue, though as proof of warming it has implications for many other GW harms.
I understand that the increased melting causes much greater flood harm, and that once glaciers are melted, irrigation water in their watersheds during the hot, dry growing seasons will be greatly diminished, putting many millions of people around the world at severe risk. Do you have figures on projected death from such future famine?
As a big fan of snow and glaciers, this is way too depressing. I am extremely conscious of all this living next to Rocky Mountain National Park.
In response to Dave Archer’s query (#3), regarding Kilimanjaro:
As you might expect, the paper Crichton cites on Kilimanjaro does not imply what he says it does, though by cherry-picking some quotes from the abstract, he makes it look like it supports his case. I went to the trouble of reading the paper and the related literature when I was helping UCS prepare their own Crichton FAQ. In this case, Crichton’s abuse of the literature is even worse than usual.
The Kase paper footnoted by Crichton does not claim that deforestation is causing the melting of Kilimanjaro, and they have no data that would support that claim. In fact, the paper has rather little data of any sort, but they do cite a certain number of observations which raise the interesting question of whether temperature rise can account for the melting. They think that it’s a change in humidity or cloudiness, but point out that even that could be part of the remote impact of a global climate change signal. Their claim that temperature isn’t rising in the tropics is erroneous, especially in light of Fu et al’s new satellite estimates of tropical warming since 1970.
By the way, Crichton didn’t dig up this paper himself. The authors of the paper did an honest job of trying to raise some interesting questions about a complex subject, but as a reward, their paper got picked up by the Heartland Institute crowd, who trumpeted it under banners like “Global Warming Fears Melt Away.” Andy Revkin did a good piece on the Kilimanjaro flap in the Times last fall. Andy quotes one of the authors of the Kase paper as saying,
“We have a mere 2.5 years of actual field measurements from Kilimanjaro
glaciers, unlike many other regions, so our understanding of their
relationship with climate and the volcano is just beginning to develop,”
Dr. Douglas R. Hardy, a geologist at the University of Massachusetts and
an author of the paper, wrote by e-mail. “Using these preliminary
findings to refute or even question global warming borders on the
absurd.”
Maybe RealClimate ought to have a backgrounder specifically on Kilimanjaro and tropical mountain glaciers. I volunteer to write that, with a little help from Lonnie’s advice, if it can wait about a month.
[Response: Ray. Thanks for the offer. Gratefully accepted! -eric]
I would just add that the explanation you provide “For typical glaciers in mid latitudes, the role of temperature is generally more important than winter precipitation. This is because a bit of extra heat in summer is a very efficient way to get rid of ice…” applies equally to what appears to be happening with respect to ablation on the low altitude edges of the Greenland Ice Sheet. For example, Vanishing Ice or Greenland Melting?. Here’s some text from the latter news source including a quote from Jay Zwally, a glaciologist based at NASA’s Goddard Space Flight Center in Greenbelt, Maryland.
It has always seemed to me that the retreat of mountain glaciers around the world is one of the most compelling pieces of evidence for global warming. As I’ve probably said on another post, mountain glaciers are invaluable because they are almost never affected by urban heat islands and their distribution gives us a wider view of climate change than that obtained from the instrumental record. Glacier variations can also be reconstructed quite accurately for the last few centuries and, in many cases, we can show that glaciers are more recessed now than for several thousand years. The pattern of recent climate warming is also reinforced by the information coming out of permafrost monitoring (eg the PACE project.
Michael Crichton is described in his promotional material as “father of the techno-thriller.”
Crichton’s newest thriller “State of Fear” is a work of speculative fiction. As such his characters are permitted to use “scientific data” or other “facts” as the author chooses to further the plot of his novel.
Knowledgeable readers of this genre do not ascribe any particular truthfulness to the work, any more than they do to E.G. “The Andromeda Strain”, “Jurassic Park” or “The Lost World”.
While it is unfortunate that some readers may actually believe some of the “facts” alluded to by the fictional characters and some conclusions they reach, the purpose of this genre is to entertain NOT to educate.
Re #7, you obviously did not read the entire book. Crichton very definitely meant it as science fact, and made that point abundantly clear in both the fiction section of it & the “Author’s Message” at the end, and the bibliography & charts. Maybe some of his techno-gadgets were meant as sci fi, but not his discussion of global warming.
I happened to live near Mt Baker when it set a world record for snowfall in 98-99 (see http://www.usatoday.com/weather/news/1999/w514sno.htm). This was the year that the jet stream was nearly perfectly level with latitude over the Pacific ocean and sat over northern Washington state. At the same time the southern cascades got so little snow that the ski resorts were hurting for business.
This is going to skew a comparison because the snow on Baker should have made the glaciers advance like wild yet it did not. The weather patterns over the Pacific showed a striking regularity that showed up as a similar weather roughly 120 degrees longitude over in Switzerland on the same year.
While measuring the relative advancing and retreating of lower latitude glaciers is interesting, I assert that the weather patterns that control the precititation or lack of it show a striking pattern at time and therefore are more interesting. This fits well with the arctic heating up roughly twice as fast as the lower latitudes and the current anomalous heat that has wiped out the snow festival in Greenland.
Re #8 A book review By Richard Dyer of The Boston Globe (see) opens with:
|Michael Crichton’s new novel…comes equipped with appendices, an author’s message, a 21-page bibliography, graphs and charts in the text, and even footnotes. A disclaimer at the front indicates that this is a work of fiction, but ”footnotes are real.”|
My position is that the novel, footnotes, bibliography, author’s message and even the disclaimer are parts of the “work of fiction.” It is all part of his literary licence to entertain; if it helps to sell more books or even leads to a movie deal, so much the better. Any controversy Crichton scares up, by whatever means, is to HIS advantage.
I think that the graph shown in the note provides a basis for the following comments.
The snow and ice in glaciers might melt when the energy addition into the glacier material is sufficient to supply the energy necessary to raise the temperature to the melting point plus the latent heat of melting. The physical processes by which energy might be added into the glacier material include: (A) convection between the glacier surfaces and local surrounding atmosphere and water, (B) direct radiation onto the exposed surfaces of the material, (C) addition of material that is at a temperature higher than the melting temperature onto the top of the glacier (rain, say), (D) Sublimation of the ice directly into the atmosphere, and (E) conduction into the material from the contact areas between the glacier and surrounding solid material. All these processes are local to the glacier of interest.
An increase in the rate of change of the decrease in the mass of glaciers might occur when the rate of energy addition into the glacier material increases. The rate of energy addition by the above physical processes might increase because of the following physical phenomena; (1) the heat transfer coefficient between the glacier surface and surrounding gaseous or liquid material increases, (2) the local temperature of the surrounding gas or liquid increases, (3) the radiative-energy-exchange properties of the surface of the glacier change in the direction of increasing the absorption of radiative energy, (4) conduction energy exchange into the glacier increases due to, say the temperature of the surrounding material increasing, (5) an increase in the amount of “warmer” material (rain) falling onto the glacier, and (6) the surface-area-to-volume ratio of the glacier surfaces exposed to its surroundings increases as the shape of the glacier changes. Each of these is local to and characteristic of a single glacier of interest.
A glacier responds to changes in the local processes (A)-(D) and local phenomena (1)-(6). In order correctly argue that an increase in the “global average” temperature is the only dominant phenomena requires the following. First, a physical-phenomena-or-process-based causal relationship between the “global average” temperature and the local temperature, (2) above, must be proven. Second, all the other phenomena must be demonstrated to be insignificant for each individual glacier of interest.
Demonstration of a physically-based causal relationship is necessary because relationships determined only by correlation and stats do not prove anything. Correlations are interpolation methods, and are useful only after all possible physical-process connections have been considered and the proven dominant ones selected for correlating parameters. Additionally, even under these conditions, interpolating within the range of experimental measured parameters is about the only safe use of correlations. And I would argue that the only valid physical parameters are those local to and characteristic of each individual glacier.
Extrapolation should almost always be avoided. Thus, even if it is rigorously demonstrated that for a given glacier a causal connection between the “global average” temperature and the decrease in the mass of a glacier exists, extrapolation to other glaciers is not recommended. To demonstrate this point, note that in the graph some of the glaciers have recently increased in length. If one accepts that the “global average” temperature is the one and only important correlating parameter, it seems that one would have to conclude that an increase in the “global average” temperature results in an increase in the mass of glaciers.
Response: Thanks everyone for your comments on this post. I was too busy to respond to each one as I was at a meeting (on the decline of British Columbia glaciers) shortly after I posted the commentary. I will try to respond in a bit more detail to some of these, as time permits. A couple of quick comments though.
The discussion of Crichton is rather off topic (!) but I will note that we’ve addressed Crichton at length on earlier RealClimate posts. See: Michael Crichton’s State of Confusion and State of Confusion II.
The questions about Kilimanjaro are good ones, and I will defer to R. Pierrhumbert who has kindly offered a piece on this for RealClimate (see # 8, above), for the details. I’ll just note here that mass loss on high altitude tropical tropical glaciers is largely by sublimation, not by melting, and that the relationship with temperature is quite different than the mid latitude glaciers that dominate the Oerlemans work. Oerlemans did not include Kilimanjaro or other such glaciers, presumably for this reason.
Finally, I agree very much with #13. On a year to year basis, it is certaintly not “average temperature” but local, seasonal weather, that dominantes glacier mass balance. The extreme snowfall year at Baker certaintly would have led to advance of the glaciers given a few more years like that. But subsequent years cancelled that influence. This year is a case in point, when we now have record low snowfall (about 10% of average, or less), and this time it is because the storms are being directed very much away from Mt. Baker, the opposite to what happened in 98-99). Over time, these things tend to average out, and for most (but not all glaciers) the temperature change generally winds up being the dominant signal.
Re #16, my limited understanding of GW is that it entails not only increased average warming, but also greater swings between temperature extremes – including colder & warmer temperatures beyond the mean. I.E., the standard deviation from the mean also gets larger. In that case (along with greater precipitation, and the precipitation belt moving to higher latitudes), there could be more snow in the winter & greater melting in the summer (in higher latitudes), while I’d think the lower latitudes (with less precip) and the local mean temp being higher, would melt the glaciers faster, without adequate snowfall & low winter temps to slow this glacial decrease. However, average warming is greater at higher latitudes, which would reduce the difference between glaciers at higher & lower latitudes.
Please tell me where I’m wrong. I’m struggling to understand, and am not only writing a screenplay (which scientists might like to dismiss as “not science”), but am also working on an anthropological paper about GW representation (as fact & fiction).
[Response: You are very right. It is not the “mean annual temperature”, but rather the seasonal energy budgets, and snowfall amounts, that determine what glaciers do. Whether seasonal extremes become greater with overall increased warmth will vary from place to place. We expect there to be a more detailed “tutorial” on all this at some time in the future. Note, however, that your intuition about latitudes is probalby not right. Most of the low latitudes glaciers are necessarily at very high altitudes, and many have both high accumulation rate and very cold temperatures. In contrast, mid latitude glaciers, such as the South Cascade Glacier shown in the photos is very warm (ice temperature is about zero celcius all year round), and snowfall rates are also high. At the highest latitudes, low precip and cold temperatures are both found. — eric]
Please read this sober paper on glaciers and climate by french professor and glaciologist Robert Vivian…sorry it is in french: http://virtedit.online.fr/article.html
In a follow-up article he starts saying “No, glaciers do not risk disappearing!”
[Response: My French is good enough for me to question whether this is a “sober” assessment of the situation. It appears all to be personal opinion, with a few examples. There is no attempt at any kind of quantitative analysis, and in any case the “article” is just a web site. You’ll need a stronger argument to convince the skier in me not to worry about the future of glaciers in the Alps. — eric ]
[Response: I did read this “article” (which was not in any case peer-reviewed), and I confirm Eric’s comment. This article is not really sober, jumping from glaciers length to the french society’s confidence in science , from the snowball earth to Svensmark, and so on. As pointed out by Eric, there’s no quantitative analysis, simply because the author does not like the stats : ” statistically, ‘averages’ do not mean anything” ; and the author prefers to do some peremptory “affirmations”. I would recommend two alternative readings for the francophones on recent results obtained on alpine glaciers, ici et la, articles published in PIGB. – thibault]
Here is a 2000 year study for the alpine Aletsch glacier:
http://www.klimanotizen.de/html/newsletter_4.html
http://www.klimanotizen.de/assets/images/2003.10.25_aletschgletscher_2000_1.gif
see also
http://www.zamg.ac.at/ALP-IMP/downloads/session_haeberli.pdf
Having looked at the graphic depicting the reduction in various glaciers, I have a problem accepting the consenus view represented by most of the comments that anthropogenic warming is the cause of the glacier retreat.
This is related to a similar issue over which I’ve had a previous argument (i.e. the famous ‘lake’ study) elsewhere on this site. Basically the reduction in glaciers begins before – well before in most cases – greenhouse gas concentrations could have had any warming effect. Where data is available, it’s apparent that glacier retreat begins around the mid-19th century. Before we cite human influence – in the form of increased CO2 emissions – as the cause, it is perhaps reasonable to ask what the levels of atmospheric CO2 were at the time. It’s generally accepted that pre-industrial CO2 levels were around 280 ppm and that levels in 1900 were around 295 ppm. Since industrial CO2 emissions were massively higher between 1850 and 1900 than any period up to 1850, it’s hard to believe that 1850 CO2 levels in the atmosphere were any more than 285 ppm.
There’s no way this small increase could be responsible for a climate forcing which produced the dramatic results shown in the diagram. This, of course, leaves another question. If mid-19th century glacier retreat is not due to human causes then why can’t 20th century glacier retreat simply be an extension of that same natural process.
[Response: As I noted in the post, “Oerlemans’s work doesn’t address whether or not the worldwide glacier retreat is part of a ‘natural’ phenomenon.” You can’t simply take one curve, look at it “by eye”, and start to make claims about the validity of the idea that human influence on climate is significant. Investigating the cause of 20th Century warming is properly done in detection and attribution studies, which analyze the various forcings (e.g., solar variations, greenhouse gases or volcanic activity) and the observed time and space patterns of climate change in detail. Work like that of Oerlemans, or the so called “hockey stick” curve, provide some of the observations used in such studies, but don’t replace such studies. Detection and attribution analyses, with a range of different techniques, have invariably concluded that the dominant cause of 20th Century warming is man-made greenhouse gases. See the earlier post by stefan: here.-eric]
Dan Kellog, an engineer (not climate scientist) on another blog, has raised the issue of once a glacier has melted away, the local temps could rise dramatically (and perhaps, averaged altogether around the world as glaciers melt away, increase the rate of global warming). Could you comment on this. Here is what he wrote (http://www.marklynas.org):
“The process of melting large quantities of ice takes time only because of the tremendous heat required to do that. Since melting ice absorbs so much more energy than heating land or even water, then once the ice melts, the local area should expect a faster rise in temperature due to decreased albedo and no more ice to absorb further heat.
For the lay person, know that a glass of ice water maintains its cold temperature as long as there is ice. Once the ice melts, the glass of water warms fairly quickly.
This fact is based on the physics of changing the phase of water from solid to a liquid. It is called the latent heat of fusion.
For water it is 143.3 Btu per pound. And since water’s specific heat is 0.998 Btu per pound degree Fahrenheit then, it would take 143 times the heat energy to melt water at its freezing point than to raise the same quantity of water 1 degree Fahrenheit once it became a liquid.
For the metric people, that converts to 257 times the heat energy needed it melt water at its freezing point than to raise the same quantity of liquid water to 1 degree Celsius.”
Is this a factor (of any significance) related to local (and perhaps global) warming, & is it being considered?
[Response: I couldn’t find the specific post you refer to, but in any case the answer is that alpine glaciers cover a very small fraction of the globe, and their disappearance will have very little impact on local temperature. Locally, their loss could matter, but only very very locally (i.e. in the same valley the glacier is in), and only in late summer (in winter, it is the snowpack, which covers a far greater part of the landscape, which strongly influences temperature). If the glaciers are gone but snowpack continues (which of course it may not…) then the effects will be minimal. Finally, it is not the latent heat of melting, but the reflectivity (albedo) that is the more important factor.-eric]
RE: eric’s response to #20:
We would do well to remember the reason for RealClimate, which is to better address and disseminate the latest climate science findings.
Eric points at the flaw in the poster’s argument: looking at one graph and declaring ‘a-HA!’; I suggest that this is a very common argument (perfected by Daly and acolytes) and we should think about this as a sub-category of argumentation and address it as such.
Best,
D
Re#17: ***Re #16, my limited understanding of GW is that it entails not only increased average warming, but also greater swings between temperature extremes – including colder & warmer temperatures beyond the mean.***
I think you’ve confused a few theories together. Some GW theorists do think weather patterns could change and cause some of today’s warm/mild climates to become cold, so maybe that’s what you’re thinking of. Many theorize that a warmer world would have more frequent and stronger “extreme” weather events, but they are not referring to temperature (instead: preciptation, tornado, hurricane, etc). So maybe that’s another theory you’re thinking of.
However, I would be surprised to find that someone has claimed that GH warming will produce “colder temperatures…relative to the mean” (except for localized regions due to the changing weather patterns theory above). In fact, cold, dry air masses (such as you typically have on extremely cold days) would warm the first/most in a GW scenario. Hence, they should be even closer to the mean in a GW world. I would think that max temps would also tend to be closer to the new warmer average temps in a greenhouse GW world, too. In other words, the average temperature, minimum temperature, and high temperature in a GW world would tend to be higher than it currently is, but the difference between avg & min and avg & max would be smaller than it currently is. This may differ from region-to-region if weather patterns, ocean currents, etc, change due to GW, but it should hold true in general in a GW world.
I’m just going on my own “limted GW knowledge” and some basic physics and greenhouse theory. Someone step in if I erred.
This post may not belong on this thread, but the “Climate Change Disinformation” thread comments have been ended.
An interesting study done by the MIT has found that the general public in the US is quite unaware of the phenomenon and the hazards of climate change. The summary is linked below:
http://www.eurekalert.org/pub_releases/2005-03/miot-ccp032305.php
Re Eric’s comment in #20. You mean “the dominant cause of late 20th Century warming”, don’t you?
Cheers,
— Jo
[Response: Sure, though in fact the late 20th century rise dominates the total for the entire century.]
You can’t simply take one curve, look at it “by eye”, and start to make claims about the validity of the idea that human influence on climate is significant
I haven’t taken one curve – I’ve looked at them all. And the majority of them (or those for which data is available) start to nose-dive before or around the mid-19th century.
Investigating the cause of 20th Century warming is properly done in detection and attribution studies, which analyze the various forcings (e.g., solar variations, greenhouse gases or volcanic activity)
Good. However, as far as the mid-19th century is concerned, forcings due to GHG concentrations are insignificant so we are only left with natural forcings (or causes) as an explanation for glacier retreat.
and the observed time and space patterns of climate change in detail
I think the argument is much simpler than this. If the cause hasn’t yet happened – but the effect has – then there is a problem with the suggested cause/effect relationship. The level of detail in the analysis is irrelevant.
But, if you have some data which shows AGW was a factor before 1900, say, then let’s see it.
[Response: GHGs starts to be a factor around 1850 as is clear from the forcing diagrams we have discussed multiple times. But other factors were of equal or greater magnitude. Only after 1950 or so, do anthropogenic effects become dominant. Thus the argument ‘is it AGW or not’ prior to 1950 is a false dichotomy. Of the forcings leading to a warming in the early part of the records, solar, decreasing volcanism and GHGs all play a part (and with a role for cooling due to land use change and aerosol increases). The specific attribution in a nice percentage figure is more difficult becuase of the uncertainty in the solar (and aerosol) effects in particular. The statement that warming from 1850 onwards is partially due to increased GHG forcing is perfectly valid. Hopefully, we can now move on to a more interesting discussion. – gavin]
Further to Eric’s response to John Finn at #20, presumably the simplest answer of all is that almost everyone agrees that there was a “Little Ice Age” of sorts which affected at least Europe, and from which rewarming had begun by the 18th century. Consequently almost everyone would expect to see glacial records indicate some retreat of the ice dating to the earliest stages of that period of that warming – just as John sees in the graph above. So really no surprises here, situation quite uncontroversial.
I was just thinking that the now inaptly-named “Glacier National Park” could be described as “Glacial Moraine National Park” (Glacial Moraine) or even as Glacial Till National Park (Glacial Till) in the next few decades.
I think these newly transformed natural parks will have something to offer for interested scientists. For example, the young geologist student can study the recent effects on the landscape of rapidly retreating glacial ice.
Given most people’s inability to understand irony of any kind, if my level of sarcasm in this comment is not understood, I will spell it out: the glaciers there will almost entirely gone.
With respect to #27, it is worth noting that in fact there is a serious question as to whether the “Little Ice Age” was a global event, or was largely restricted to Europe. It has by no means been proven that the Little Ice Age had the same degree of spatial coherence of advance as does the current retreat. As an example of what I mean by this, consider two of the long European records shown in the figure: d’Argentiere evidently advanced from about 1820 to 1850, while Grindelwald was retreating. But both retreated together from about 1940. Unfortunately, there really isn’t enough data from enough locations going back far enough in time to examine this question rigorously. That’s one of the reasons why the glacier data aren’t a particularly strong data set for assessing the relative influences of “natural” vs. “anthropogenic” change. They are, however, useful for assessing the amount of change that has occurred. That’s the point of Oerelmans’s paper, and this post.
Thanks Gavin for the short and simple response to the mid 19th century anthropogenic warming question.
Is anything known about how mountain ecosystems are reacting to glacial retreat?
I would like to see a post from Realclimate about current ecological effects of anthropogenic climate change. Something detailing any ongoing changes in communities of living things in the natural world like coral reefs, lakes and alpine regions caused by anthropogenic climate change would be great, if its not too off topic for RC.
[Response: In general ecology is not our area of expertise, but I would venture that ecosystems around glaciers are generally used to significant changes. I suspect a larger effect is not the glaciers themselves, but the rising treeline (see e.g. this article from Science. -eric]
Why satellite measurements show much lower warming than earth stations, especially in western Europe ? Has urban heat island effect corrected adequately because American and Siberian stations (not so ueban) show less warming or no warming at all. Also in Helsinki (measurement point in the middle of city) shows much more warming than Sodankylä in Lappland (no clear warming).
[Response: There is information on the urban heat island effect, and the satellite data, already posted on RealClimate. See: here.]
[Response: The satellite stuff is probably better covered at http://en.wikipedia.org/wiki/Satellite_temperature_record – William]
Did anyone catch “CNN Presents” last night? It was on climate change and was more balanced than I was thinking it would be. They had James Speth, Ross Gelbspan, and Russ Schnell as guests, but also had Richard Lindzen and Pat Michaels. However, the time they allotted to Lindzen and Michaels was maybe 1/8 of the show.
They talked about sea-level rise due to melting glaciers and the disintegration of Antarctica’s vast ice sheets and the effects of this rise on the planet, especially coastal regions which are heavily populated and the Island states (specifically Tuvalu).
They also discussed the situation in the North where polar bears are much less healthy than 30 years ago (due to a three-week earlier break-up period) and the loss of the culture of the Inuit and northern Aboriginal tribes.
One guest that really peeved me was Jim Conatin. You can see for yourself what rubbish he was saying. Here is an unofficial transcript of the show:
http://edition.cnn.com/TRANSCRIPTS/0503/27/cp.01.html
[Response: The satellite stuff is probably better covered at http://en.wikipedia.org/wiki/Satellite_temperature_record – William]
Covers the basics, but a rather poor coverage, IMHO (especially with regard to the poster’s questions). It even includes a reference to Fu’s 2004 Nature article, which Spencer, Christy, and others have ripped to shreds. Fu himself adjusted his methodology in response/”rebuttal” and showed results much closer to those of Christy and Spencer in a subsequent publication (although Christy and Spencer still think there are errors in the methodology) and still lower than surface warming rates.
*For some time, the UAH satellite data’s chief significance is that they appeared to contradict the United Nations’ IPCC predictions about global warming. In April 2002, for example, their satellite temperature trend was only 0.04 °C / decade, compared with 0.17 +/- 0.06 °C / decade from surface measurements; however, in the years since the UAH trend has roughly doubled to come more in line with other trends.*
“Roughly doubled” certainly has it “more in line with other trends,” but I’d say still showing only 50% of surface warming is a huge gap to fill when it is supposed to be at least as large as the surface warming.
*A report by the National Research Council that reviewed upper air temperature trends stated:
“Data collected by satellites and balloon-borne instruments since 1979 indicate little if any warming of the low- to mid- troposphere – the atmospheric layer extending up to about 5 miles from the Earth’s surface. Climate models generally predict that temperatures should increase in the upper air as well as at the surface if increased concentrations of greenhouse gases are causing the warming.” [12]*
The huge disparity the AGH skeptics always point to. On the other side…
*However, the same panel then concluded that
“the warming trend in global-mean surface temperature observations during the past 20 years is undoubtedly real and is substantially greater than the average rate of warming during the twentieth century. The disparity between surface and upper air trends in no way invalidates the conclusion that surface temperature has been rising.”[13]*
Whether the surface temperature had been rising since 1979 was not in doubt. The magnitude it actually had actually risen, how different these temperatures were from the 1940s, the conflict between model prediction/theory and observation, etc, were the issues the satellite data raised.
And then there’s the next statement:
*An important critique of the satellite record is its shortness – adding a few years on to the record or picking a particular time frame can change the trends considerably.*
We see this issue when it comes to other temperature records, too. We’ve all seen bookends used to identify surface temperature trends that if expanded or contracted by a few years reveal drastically different results. Regardless, 25 years of side-by-side comparison with surface-based readings – and corroboration with weather balloon data – seems like plenty of time to determine that something is amiss.
It will be interesting to see how everything sorts out concerning the interpretation of the satellite data. However, I think the “big picture” effect that the satellite interpretests are going for by coming up with average global trends may be the incorrect approach. A better approach may be to compare the data of individual stations vs satellite data for corresponding areas. This will reveal flaws in the data (either surface or satellite) far more quickly. It would seem to me that the global average approach would serve to dampen errors.
A few comments: following No. 15 it is indeed true that some mountain and valley glaciers display asynchronous responses to climate change. The most obvious example of this is the case of calving glaciers where their gross behaviour may relate more to water depth at the calving front than small-scale climate variations. However, even in these cases, such topographic factors are only second-order controls on fluctuations and climate will eventually dominate the behaviour.
Following No. 29 I would argue that the glacier signal shows that the Little Ice Age may well have been global. For instance, in Patagonia we have evidence to show that most of the outlet glaciers of the Northern Icefield receded from their late Neoglacial limit around 1880 or so. This ties in with many of the glacier climate records from the Northern Hemisphere, although we don’t yet have much evidence for glacier advances in Patagonia around the 16th century.
[Response: There’s no question that many (most) glaciers were at their most advanced in the last few thousand years, some time in the mid to late 19th century. To what extent those advances really represent a globally synchronous “event” requiring external forcing (i.e. the sun) is less clear, to me at least! I think an interesting question is whether the LIA was a globally coherent as today’s recession is.– eric]
In reply to #30 you might find it interesting to have a look at http://192.171.163.165/ [which is the home page for the Continuous Plankton Recorder Survey]. I know that they have analysed this survey and found trends due to climate change in plankton populations – they have some links to publications from the above page.
I don’t know any details unfortunately.
As global warming continues, the amount of water vapor in the atmosphere increases. The significance of latent heat for snowmelt has been described by Dunne and Leopold (1978):
“If water from moist air condenses on a snowpack, 590 calories of heat are released by each gram of condensate. This is enough energy to melt approximately 7.5 gm of ice, which when added to the condensate yields a total of 8.5 gm of potential runoff”.
[Quote shown in my Sep. 2003 article “Earlier in the Year Snowmelt Runoff and Increasing Dewpoints for Rivers in Minnesota, Wisconsin and North Dakota” at: http://www.mnforsustain.org/climate_change.htm ]
The rate of snowmelt will increase as water vapor increases, even with assumed no change in temperature during a given period of above freezing temperatures … due to latent heat as moist air condenses on snow and ice.
[Response: Increased humidity may indeed be responsible for the Kiliminajaro glacier retreat, discussed above.–eric]
I think #33 is arguing against global warming (or is claiming the warming might be just an urban heat effect). So forgive me for being off-glacier-topic, but haven’t there been recent findings of deep ocean warming (from Scripps Inst. of Ocean.)? Do these ocean findings finally lay to rest any arguments against anthropogenic global warming, according to news coverage claims? Do the findings definitively prove anthropogenic GW, against any contradictory satellite data or non-retreating glacier arguments?
[Response: See our post on this Why looking for global warming in the oceans is a good idea].
Yes glaciers ARE melting. But in the last (ice age) global warming 123,000 years ago, ALL the ice in central Greenland melted- the proof being that the ice cores stop/hit bedrock at that time.
So WHY shouldn’t we expect the glaciers to melt during this warming cycle?
Especially since
1.the sun is pouring out energy at a higher rate than it has for the the previous 800-1000 years,
2.by Milankovitch orbital mechanics we are closer to the sun in our eliptical orbit, the tilt is tending towards warmer winters & cooler summers (less ice accumulation), a few hundred years ago the precession passed aphelion so that we are now receiving more solar energy due to precession that we did for the previous few thousand years, AND
3.there is more CO2 to enhance/multiply the increased solar radiation/heat effects.
[Response: You are mixing apples with fish. Yes, there have been warmer times in earth history. So what?]
My still unanswered question is why does the hockey stick shape of Earth temperatures show up in a chart of the Solar magnetic flux?
How did some CO2 molecule on earth spread THAT news back to the sun?
[Response: Recent solar variations do not look “just like” the recent temperature history as this comment implies. See our post on climate forcings.]
[Response: A further comment. All Greenland ice did not melt during the last intergalcial. The ice cores hit bedrock because there is a continual divergence of ice near the base (that feeds ice streams going to the ocean). Greenland has probably had large amounts of ice for the last 3 million years, although some significant portion may have melted during the last interglacial. Similarly, the best cores in Antarctica are likely to go back only a million years, and yet Antarctica has been glaciated for at least 30 million years. The answer to your question is that of course we expect glaciers to melt in a warming phase, and that they are doing is a strong indication that we are in fact in a warming phase. – gavin]
Thanks Eric for recommending that article in Science (comment #30). It’s a great piece and refers to a lot of other sources that address climate change and ecosystems.
It’s on a non-subscription site at:
http://meteora.ucsd.edu/cap/all_downhill_sci12mar04.pdf
I have wanted to learn more about the effect of human-caused climate change on the natural world. I do have a bachelors in marine biology and some profession experience in ecology but that was a while ago. I don’t have the same connection to scientific areas I used to. I decided to ask the working scientists at RealClimate to point me in the right direction.
Ecology is a separate area of science, but climate and climate change are important parts of it. I know ecologists are examining past climate change to see what the current anthropogenic climate change could do.
Thanks Tim for that link (comment 35). It also has some great info. I read a journal article about 10 years ago that looked at past temperature changes and how these changes effected fish populations. It basically said that populations of larger fish would just move but the big problem could be changes in the plankton, which is the basis of the food chain. The articles on the SAHFOS site ( http://192.171.163.165/ ) bring up the same concerns, namely that anthropogenic climate change could affect plankton and these changes in the plankton communities could cascade through the entire ocean ecosystem, and show that these changes in the plankton communities have already started.
[Response: You may also be interested in the article by Richard Feely and colleagues, Impact of Anthropogenic CO2 on the CaCO3 System in the Oceans arguing that quite apart from any climate impact from atmospheric CO2, there is a much more direct impact from the dissolution of CO2 in the world’s oceans. Richard has said that the scientific community has dropped the ball on this one, and we should have been warning the public about this particular catastrophe a long time ago, when it was first suspected. Unfortunately, and despite the name calling we get, we scientists tend not to raise alarms until we are very sure. I think Richard is now very sure.]
I’m not an expert, but I am interested. So please forgive me if my question is overly ignorant.
What’s more commonly observed? A 1 degree average annual increase in summer temperatures, or a 25% decrease in precipitation? I would posit that a 25% decrease in precipitation is much more common.
In the case of Glacier National Park, for example, isn’t it true that the large part of the glacial retreat occurred during the dust-bowl associated dought between the 1920s and 1940s?
[Response: The point is that there is no reason to believe in a worldwide, sustained decrease in precipitation. Surely this may explain the behavior of some individual glaciers, but it can’t explain the worldwide trends. As for the 1940s, I’m not familiar with the details of GNP, but in Washington State where I live, glaciers did retreat substantially until about the 1940s, before advancing again until the late 1970s. That coincides rather nicely with temperature variations (and with the global picture from Oerlemans’s paper). We’re now back to (and beyond) the 1940s retreat level, just as we are now warmer than we were in 1940…–eric]
Although some of the best data for carbon dioxide levels are from Mauna Loa in the Hawaiian Islands, there seems to be an absence of information showing warming of temperatures in the tropical Pacific. Specifically concerning glaciers, have any snowfall or permafrost changes been noted atop Mauna Loa or its nearby taller neighbor, Mauna Kea?
(Lake Waiau atop Mauna kea, “the highest lake in the United States,” is contained in its cinder-cone basin by perma frost).
[Response:Lest anyone be confused by the comment, note that it really does not matter where the CO2 measurements are from. The atmosphere mixes over a few years, so the CO2 levels are pretty much (though not exactly) the same, globally. And yes, there are plenty of data to prove that. Nor is there any absence of data to suggest that tropical Pacific temperatures have increased along with most of the rest of the globe over the last 100+ years. I don’t have a reference on this handy (I happen to have seen some unpublished compilation lately, which I can’t post here, but I will look around and see what is in print).
As for Hawaiian snowfall changes, I’m not aware of any studies one way or another.-eric]
In reference to Comment No. 40 and response. A recent paper that demonstrates both retreat of subpolar mountain glaciers AND contemporaneous increase (not decrease) in wintertime precipitation (snow) is:
Dyurgerov, M., 2003. Mountain and subpolar glaciers show an increase in sensitivity to climate warming and intensification of the water cycle. Journal of Hydrology, volume 282, pages 164-176.
RE #39 (sorry for being off-topic), there are still more threats to plankton from GW, according to a NATURE article just out (“Decline of the marine ecosystem caused by a reduction in the Atlantic overturning circulation,” Schmittner, Vol 434 No 7033, Mar 31, p. 628): If the Atlantic ocean conveyor is disrupted due to freshwater entering, then the nutrients for plankton will not be churned up, perhaps reducing plankton by half. I just read blubs so I don’t know if I got it right.
Re: #37 – “I think #33 is arguing against global warming (or is claiming the warming might be just an urban heat effect).”
No, I was simply pointing-out that I considered the coverage in the recommended link to be subpar, and I stated some reasons I felt that way. I certainly don’t think urban heating explains the difference between the satellite and surface measurements (although I am open to the idea it could be underestimated).
Also, regarding the satellite measurements: they do not themselves argue against the idea of anthropogenic global warming, as you may have suggested. They do, however, raise serious questions about the validity of climate models (which are, of course, used to predict future warming and are used to set public policy and sway public opinion) and how much we are actually warming. Regardless of how much warming is natural vs anthropogenic, if the warming rate is half, one-third, or an even smaller fraction over the past 25 yrs than you have been led to believe it was, would that not be cause for serious reflection? Would that not cause you to rethink how drastic any climate change prevention measures should be? Would that not alter your cost vs benefit analysis of something like Kyoto? Would that not potentially convince you that the concerns about climate change are overstated?
The conflict between satellite data and surface data is a serious question, IMHO. I don’t know if Christy and Spencer’s interpretation of the data is correct, but their procedures seem much more reasonable to me than the other intepretations I’ve read. At face value, the satellite data is supported by weather balloon data, covers a much larger area of the globe than the surface-based data, and, as you pointed out, is free from the urban heat island effect and other potential flaws of surface measurements. This discrepancy between satellite data and surface readings needs to be answered.
FYI, I am in the “undecided” crowd – as in undecided on how much warming is natural vs anthropogenic, undecided whether or not warming is good vs bad, undecided whether or not warming can be catastrophic (and at what level of GHG such a thing would happen), undecided whether or not man can significantly slow-down or reverse warming, undecided whether or not we should be concerned with trying to fight climate change vs preparing to deal with it, etc. If you want to label me a skeptic or claim that I “argue against global warming,” then so be it, but I don’t consider my position as such.
[Response: The satellite/surface discrepency such as it is, is a function of a number of issues. Firstly, the methodology used to string the different satellites together – which is the principle difference between RSS and S&C. The main issue there is how to tie one particular satellite in (NOAA-9), and that makes a large difference in the global trends in MSU2. Secondly, there is how one accounts for the well-known stratospheric influence on the record: S&C use a method that uses different scan angles to create the MSU2LT (or MSUtlt) record – but RSS note that this has even greater uncertainty in the continuity across satellites. Fu et al suggest another way as well. This issue can however be avoided completely by using the actual radiative transfer model to examine climate model output, and that kind of approach was used in Hansen et al (2002) to show that the climate models can match the surface record, the MSU 2 channel and the MSU 4 channel completely consistently. Only the S&C MSU2LT channel is obviously anomalous. This issue is not as big a deal as it has been painted. – gavin]
Re#40: […As for the 1940s, I’m not familiar with the details of GNP, but in Washington State where I live, glaciers did retreat substantially until about the 1940s, before advancing again until the late 1970s. That coincides rather nicely with temperature variations (and with the global picture from Oerlemans’s paper). We’re now back to (and beyond) the 1940s retreat level, just as we are now warmer than we were in 1940…–eric]
It may coincide nicely with temperature variations, but according to the conclusions of 2001 IPCC Working Group I (which even refer to Oerlemans), it shouldn’t! Glacial response should lag temperature on the order of decades.
http://www.grida.no/climate/ipcc_tar/wg1/064.htm
“…Glaciers are generally not in equilibrium with the prevailing climatic conditions and a more refined analysis should deal with the different response times of glaciers which involves modelling (Oerlemans et al., 1998). It will take some time before a large number of glaciers are modelled. Nevertheless, work done so far indicates that the response times of glacier lengths shown in Figure 2.18 are in the 10 to 70 year range…”
[Response: Of course. That is taken into account in the Oerlemans’ study. The glacier I am familiar with on Mt. Baker is quite small, and the response time is around 10 years. I’m referring here to work by a grad. student in our department who shows that the response is very nicely in sync with expectation from the same type of model Orelemans uses. Thanks for pointing this out though. I didn’t mean, as my response implied, that this glacier varied “in sync” with tempeature. I was merely pointing out that there were advances and retreats through this century, much of which involved temperature and precip variations, without the added complication of “dust” needing to be invoked..–eric]
(FYI, “Figure 2.18” referred to by the IPCC is the graph shown at the top of this thread)
RE#44: gavin, I’ll have to re-read Hansen as it’s quite long and has been awhile since I’ve first seen it. But the issue of satellite temps vs surface temps is still large to me. Clearly, it is still quite important to some others in the field (hence, the recent flurry of different interpretations, such as that of RSS).
S&C ripped Fu’s first piece of work in 2004 to shreds (along with Nature for publishing it in the first place without an adequate review). Fu revised his methodology and got better results with a subsequent article in a different journal (results which approach S&C’s results, from what I remember). S&C still think their methodology is better supported and less susceptible to error, and their explanations made sense to me. But I’ll let them sort it out.
From above: ***Indeed, the reconstruction of temperature from glacier data is notable for having a rather distinctive “hockey stick” shape, the aspect of the original Mann, Bradley & Hughes reconstruction that seems to attract the most attention and criticism. This poses a substantial challenge to those who have dismissed the “hockey stick” as due to biases or errors.***
On the topic of glacier data and the “hockey stick”: additional commentary from the 2001 IPCC working Group I (continuing from previous comment):
http://www.grida.no/climate/ipcc_tar/wg1/064.htm
“…Nevertheless, work done so far indicates that the response times of glacier lengths shown in Figure 2.18 are in the 10 to 70 year range. Therefore the timing of the onset of glacier retreat implies that a significant global warming is likely to have started not later than the mid-19th century. This conflicts with the Jones et al. (2001) global land instrumental temperature data (Figure 2.1), and the combined hemispheric and global land and marine data (Figure 2.7), where clear warming is not seen until the beginning of the 20th century. This conclusion also conflicts with some (but not all) of the palaeo-temperature reconstructions in Figure 2.21, Section 2.3 , where clear warming, e.g., in the Mann et al. (1999) Northern Hemisphere series, starts at about the same time as in the Jones et al. (2001) data. These discrepancies are currently unexplained.”
So it seems the IPCC Working Group I actually felt that glacial data conflicted with Mann et al. (1999) and Jones et at. (2001), as opposed to supporting it as suggested by this thread.
[Response: Two remarks. First, the Oerlemans paper published this year is a substantial update to the previous work referred to in IPCC. Second: I think IPCC was looking for rather too “perfect” a correpondence here. To say that because two noisy things don’t match perfectly they are “in conflict” is a bit silly — they certainly match rather well within the noise.-eric]
The shrinkage at Glacier Bay, in Alaska, is rather striking. Did they recede before the time period you wish to examine?
Regarding John Finn’s #26. He says: “However, as far as the mid-19th century is concerned, forcings due to GHG concentrations are insignificant so we are only left with natural forcings (or causes) as an explanation for glacier retreat.”
I don’t know if this is correct. Figure 4 on page 11 of the SPM of the IPCC’s Working Group I clearly shows that the “Temperature Anomalies” attributed (in models) to anthropogenic causes in the 1890s was as high as the 1950s and 1960s. http://www.ipcc.ch/pub/spm22-01.pdf
Granted, it has been suggested that sulphate areosols (in the Northern Hemisphere) had a (strangely) global cooling impact during the 1950s and the 1960s. I have yet to see what caused the anthropogenic warming during the 1890s.
I suppose it is possible that some other natural forcing not included in the solar variations and volcanic activity may have been incorporated into the anthropogenic side of their equation.
[Response: Careful! The figure you refer to doesn’t show estimated forcing. It shows estimated response to forcing, including underlying “unforced” variability in the system. The main take-away message from this figure — in the context of this discussion — is that warming in the 1890s in no way exceed the underlying variability, whatever forcings (anthropogenic or not) are included. The slight warming shown in the Oerelemans reconstruction similarly is well within the bounds of what we expect in an unforced climate, so it doesn’t require any “explanation,” and nor does it contradict the attribution of 20th century warming to a combination of natural variabilty, natural forcing, and anthropogenic forcing. -eric]
Eric,
Thank you for the response.
As I said, the graphs show Temperature Anomalies attributed to various modelled forcings.
Are you saying that there is an underlying climate variability that is independent of Natural and Anthropogenic forcings?
[Response: Absolutely. If I’m riding a bicycle and I am wobbling, that is unforced variabilty in the me-bicycle system. If I get swiped by a car and have to swerve, that is forced variability! The climate system is the same. If you could have the earth do its own thing for 1000 years, with not no changes in forcing (i.e. solar output constant, have no human-caused CO2 changes, etc.), you will still get variabilitiy. El Nino is a nice example of unforced climate variability (though El Ninos may also respond to forcing). See also our list of definitions, including forcing.-eric]
***Second: I think IPCC was looking for rather too “perfect” a correpondence here. To say that because two noisy things don’t match perfectly they are “in conflict” is a bit silly — they certainly match rather well within the noise.-eric***
Yes, within the noise, they certainly do match within the noise. Then again, within the noise of any temperature reconstruction of the past several hundred to 1000 years, a lot of things match. Within the noise, you can say the MWP and LIA existed globally. Or you can say that, globally, only one existed, but not the other. Or you can say that neither existed globally. Or you can say they both existed globally, but not at the time periods we think they may have existed. You can even draw a line within the noise suggesting the MWP where we think the LIA was, and the LIA where we think the MWP was.
I’d say a warming trend showing-up in one set of data no later than 1850 (significant enough to cause measurably increase rates of glacier melt) vs a warming trend not showing-up in another set of data until later than 1900 is a conflict that is well beyond a “bit silly.” Being off by a half century concerning data that is less than two centuries old seems to me to be “in conflict,” as the IPCC put it.
Regardless, I think this discrepancy, however reasonable it may be “within noise,” should raise questions about our historical data and their interpretation rather than just being totally dismissed.
[Response: You are certainly right that if they are significantly different, then examining why is important. But if they are the same “within the noise”, then it is fruitless to try to explain the difference. I am not being flippant here: “within the noise” means something quantifiable. I strongly suspect (and I admit to not having done this analysis — this is just my opinion “by eye”) that the records are indistuinguishable within their one-standard-deviation uncertainties in the 19th century. If that is true, then yes, it is silly to say the records are “in conflict”. — eric]