Site Google Custom Search

RealClimate logo

9 June 2006

NOAA: Hurricane forecasts

Filed under: — group @ 1:13 PM

Guest commentary from Thomas Crowley

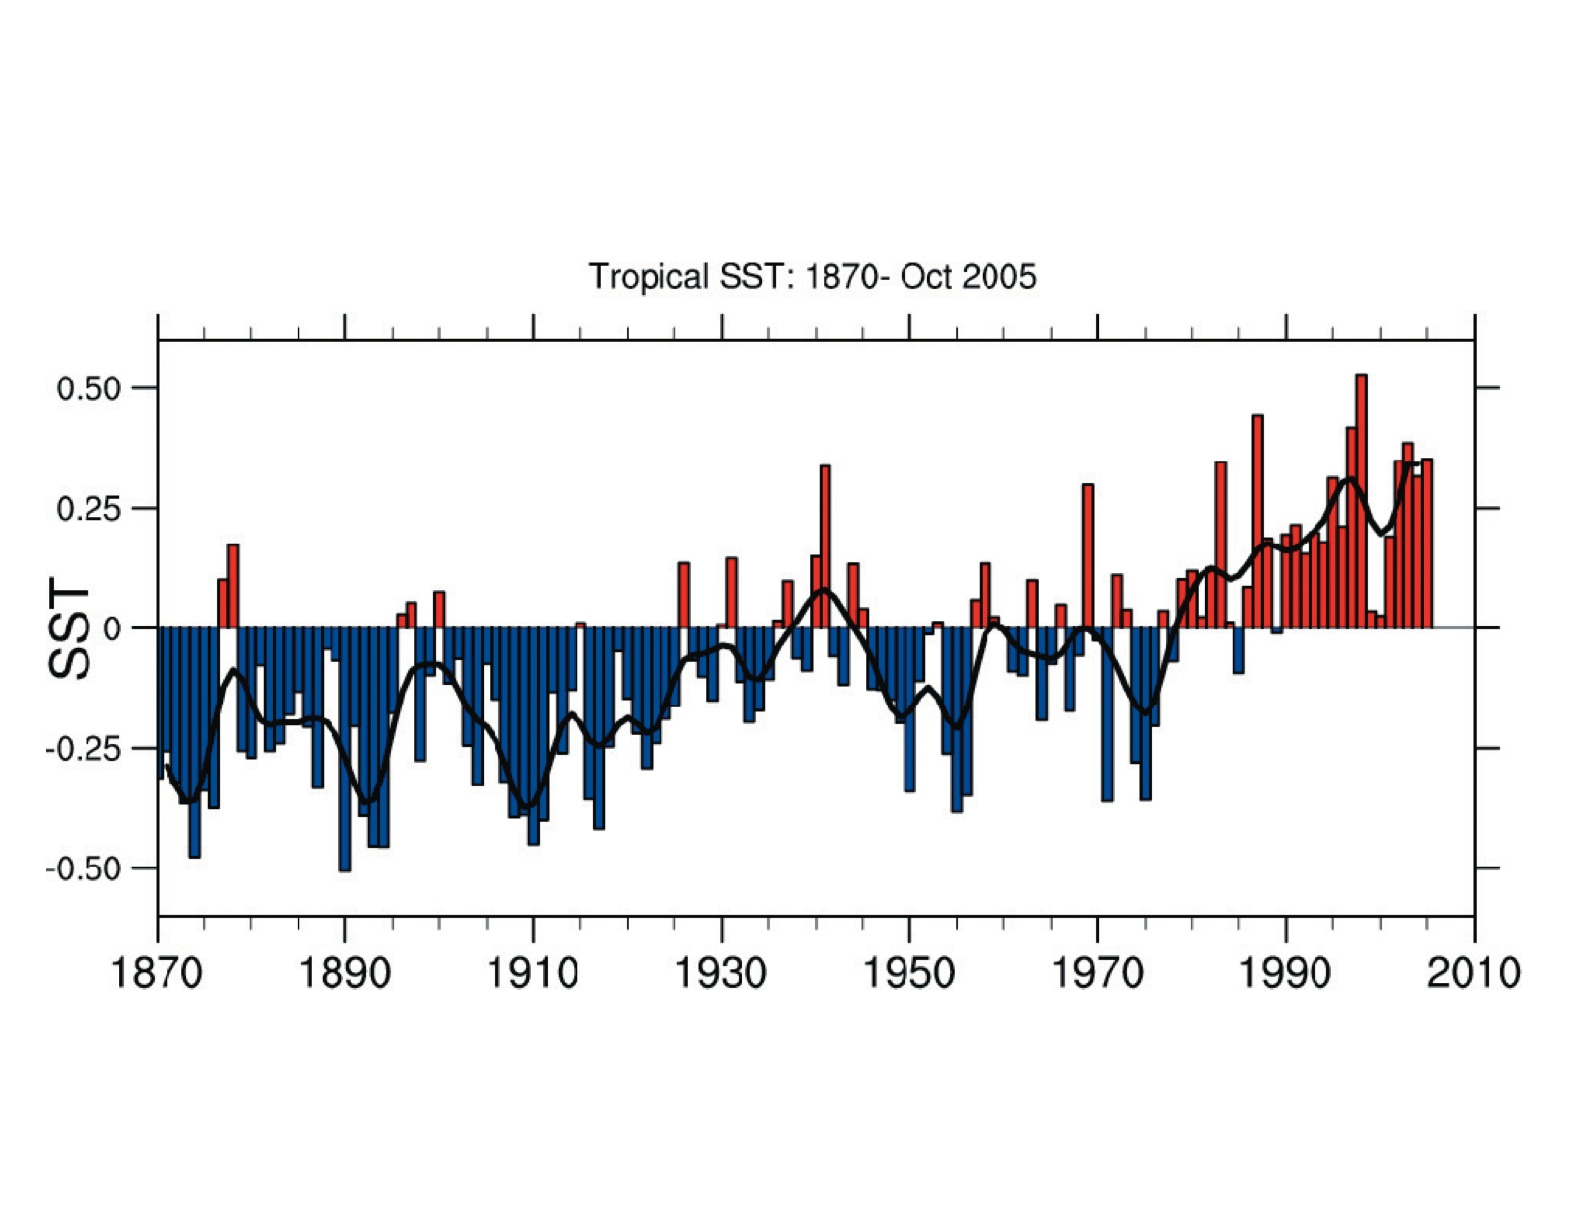
NOAA has issued its annual forecast for the hurricane season, along with its now-standard explanation that there is a natural cycle of multidecadal (40-60 year) length in the North Atlantic circulation (often referred to as the "Atlantic Multidecadal Oscillation"–see Figure), that is varying the frequency of Atlantic tropical cyclones, and that the present high level of activity is due to a concurrent positive peak in this oscillation.

AMO Pattern

There was not one mention of the possibility of global warming being a partial factor for these changes (see also this NY Times report on two recent studies).

trop. temperature - Anthes et al (2006) The average reader of newspaper articles on this prediction might well have concluded that there are in fact two camps on this subject – one global warming, one natural variability. But I think there is a one-way commingling of the camps. I suspect that most people leaning toward global warming as a contributor to the unusual increase in the magnitude of Atlantic tropical storms and hurricanes would readily concede the possibility that the AMO could, in addition to the El Nino/Southern Oscillation, modulate any greenhouse gas contribution to the enhanced activities of tropical storms.

It is not at all clear to me that the natural variability camp sees any need to commingle with the global warming community.

Is there any way to distinguish as to the relative strengths of arguments of these two camps? Actually, it is quite easy to do so. If the natural variability argument applies there should be little difference in the statistics of the present phase of the AMO with the past. But global temperature data incontrovertibly indicate that there has been a widespread warming since the previous positive phase of the AMO (e.g. 1940-1960). This type of warming cannot be produced by the ocean circulation, which to a first approximation just moves heat around on the planet – what it robs from Peter it gives to Paul.

Furthermore, rigorous statistical studies indicate that the pattern of warming can be attributed to greenhouse gas increase. I have seen no effort to conduct a standard “detection and attribution” approach to the alternate explanation of the AMO. I encourage the AMO proponents to try it; it is somewhat more objective than simple declarative statements that the AMO are responsible for the observed warming.

Update: The two papers referenced in the NY Times article are now available online: Mann and Emanuel (2006) and Sriver and Huber (2006).


167 Responses to “NOAA: Hurricane forecasts”

  1. Todd Albert Says:

    I find it interesting, too, that the Global Warming camp (which I firmly sit in myself) is quick to allow the AMO and ENSO some influence on hurricanes, while most of the AMO camp does not allow Global Warming even a small foothold. What a shame, especially since people are so influenced by the media.

    Each semester I teach a group of about 40 students about climate change. I am amazed this semester (a short summer session) at how many students do not beleive that humans have any influence on climate! We’ll see how that changes by the end of the course.

    Thanks for the great posts! I am a devoted reader.

  2. Doug Percival Says:

    Apparently the Canadian Meteorological and Oceanographic Society is in the “global warming camp”:

    New Data Clearly Links Storms and Warming
    by Stephen Leahy
    June 8, 2006
    Inter Press Service

    Excerpts (emphasis added):

    Stronger and more frequent hurricanes in summer and stronger winter storms are clearly the result of climate change, according to new scientific studies reported at the 40th annual Canadian Meteorological and Oceanographic Society (CMOS) congress in Toronto.

    […]

    Using sea surface temperatures of the tropical Atlantic Ocean over many decades, Robert Scott, an oceanographer at the University of Texas, showed that the area that spawns hurricanes has grown dramatically in recent years. Scott’s data shows that since 1970, the eastern side of the Atlantic, near the coast of Africa, has become warmer, topping the 26.5 C. temperature threshold for hurricanes to form. That means that the traditional area where hurricanes get their start has expanded by hundreds of kilometres.

    In fact, Scott said, hurricanes have been getting started an average of 500 kilometres further east since 1970, spending more time over warmer water.

    While there are other factors involved in hurricane formation, the much larger pool of warm “birthing” waters also means storms can become stronger, since warm water provides fuel for them to grow.

    Scott is convinced that global warming has made hurricanes more powerful. “Humanity has had a discernible impact on hurricanes,” he said in media reports.

    […]

    There is convincing new evidence that global warming will produce more powerful winter storms over the mid-latitudes of the Northern and Southern hemispheres, Steven Lambert, a climate expert at the Meteorological Service of Canada, told the conference.

    Lambert examined how future greenhouse gas emissions will affect low pressure systems during the winter using nearly all of the most current computer climate models. The models all concurred that as levels of greenhouse gases in the atmosphere rise, low pressure systems, or cyclones as they’re called, become stronger but form less often.

    “There’s a direct relationship between the changes in magnitude of cyclonic events and concentration of greenhouse gases,” Lambert said in an interview.

    Lambert told IPS that this affect is likely the result of higher temperatures triggering higher rates of evaporation. This means more latent heat is available, resulting in stronger lower pressure systems. Once those huge systems lose all their energy, it may take longer to form news ones, and that may be why the models show fewer cyclones, he said.

  3. Marcus Says:

    I was under the impression that there exist some members of the “Global Warming camp” who think that the AMO in the 20th century is a stastical construct and not a real physical phenomena. Eg, the first graph of the “AMO index” is a “detrended sea surface temperature anomaly”, but the “detrending” is a removal of a linear trend, and not of the global mean surface temperature trend. So my impression was that if you detrended by removing the global warming signal, the AMO cycle would become much less clear…

    I have not done this analysis myself, I’d be curious as to how widespread this “statistical construct” opinion is, and what the AMO index would look like with after more appropriate “detrending”.

  4. Love Says:

    The US accounts for 25% of the world’s pollution and this was going on when Al Gore was vice president. How pathetic.

    [Response: But neither Gore nor Clinton had enough control over Congress to do anything about it. I can fault Clinton for not making this a higher priority issue, but the executive branch can’t bear the burden of the blame for the lack of action.. A carbon tax idea was floated in the early days of the Clinton administration but went over like a uranium balloon. Republican obstructionism may have been (and continues to be) in large measure to blame, but Democrats have a lot of populist baggage on energy issues also. Local interests and labor alignment in Michigan have helped block more stringent auto fuel economy standards, Democrats have led the charge for reduced gas taxes and other ways to keep down energy prices (very counter-productive for conservation, and for the budget deficit as well) and Democratic Illinois is big on coal and lukewarm to CO2 emissions controls. Both parties need to change. There may be some difference between conservatives and liberals on the right kind of policy response to avoiding global warming, but a consensus needs to emerge among both parties that there really truly does need to be a policy response, and that it should be mostly emissions reduction rather than the fata morgana of adaptation. -raypierre]

  5. Karl Sanchez Says:

    If the Hadley Cells gravitate outwards due to GW, wouldn’t this also cause the ITCZ to move northward too, and thus widen the overall hurricane track? And given increased SSTs and rising overall atmospheric water vapor content, wouldn’t it be possible for hurricane season to become year-round? Lastly, wouldn’t we see a corresponding increase in the severity of non-tropical storms similar to that recently seen in tropical storms?

  6. Mark A. York Says:

    They’ve been instructed to form it as an either/or argument. It’s a political appointee at the helm responsible for the disconnect. Natural is favored, because there’s nothing that can be done about that. RE# 3 Actually pollution standards have beeb relaxed since Clinton/Gore left office, but the idea that 0 emissions would be Gore’s test is ludicrous.

  7. Dan Says:

    re: 3. Yet another “hit and run”, cherry-picking post by someone who heard or read his supposed point from an un-scientific source and who won’t be back after their point is disproved, just like the other day. Coincidence? Probably not.

    The fact is that global warming began long before the Clinton administration. Most adminstrations since 1970, when the human-caused warming really became apparent relative to natural causes, have been Republican. ;-)

  8. Fairman Says:

    The real problem is lack of any concise record of Atlantic hurricanes over a time period longer then 100 years (and even then, it’s shaky). While we have other data to look at temperature, and by looking at proxies can figure out a reasonable interpretation for the temperature for years and years, there exists no credible way to do something like this for hurricane patterns.

    GW most likley has some kind of effect, just because of more availible energy. However, without longer-term records, things like the AMO are not as statistically significant as they are wanted to be.

  9. Eli Says:

    …I encourage the AMO proponents to try it; it is somewhat more objective than simple declarative statements that the AMO are responsible for the observed warming.

    Why would not you do this “objective” analysis by yourself and show us the results, if you are so sure that the AMO camp is so totally wrong? It seems that you already formed an opinion that you “objectively” know the correct answer, before even trying. Sorry, but this is what people call a “declarative statement.” I do not see anything “objective” about such cheap shots. If you have an argument, provide it. The bottom line is that you do not.

    A propos: Can there be anything on this planet that is NOT related to the dreaded global warming?

  10. Roger Smith Says:

    “A propos: Can there be anything on this planet that is NOT related to the dreaded global warming?”

    How about earthquakes/tsunamis (sorry, Michael Crichton)

  11. Jerry Steffens Says:

    What about the recent work by Emanuel and Mann?
    http://dsc.discovery.com/news/briefs/20060605/hurricane_pla.html?source=rss
    Looks like this severely undercuts the AMO argument.
    (Apparently, this hasn’t been published yet — I just checked the latest online edition of EOS.)

    [Response: It’s out now. If I may summarize and oversimply some very deep conclusions, it would be as this: A lot of what is being called the AMO is really just global warming by another name. –raypierre]

  12. Hans Erren Says:

    re 8

    nope:

    the idea that climate change is linked to extreme geological events is not as far-fetched as it might sound. All over the world evidence is stacking up that changes in global climate can and do affect the frequencies of earthquakes, volcanic eruptions and catastrophic sea-floor landslides. Not only has this happened several times throughout Earth’s history, the evidence suggests that it is starting to happen again. While no serious scientist is suggesting that the Sumatran earthquake was triggered by global warming, …

    Climate change: Tearing the Earth apart?
    27 May 2006
    Bill McGuire
    Magazine issue 2553
    Never mind the weather, climate change could rip up the very fabric of our planet, says Bill McGuire
    http://www.newscientist.com/article/mg19025531.300.html

  13. pat neuman Says:

    … There was not one mention of the possibility of global warming being a partial factor for these changes …

    This brings back memories. For the Upper Midwest Spring Flood Outlook in March of 2000, the mention of climate change and global warming was stripped from the Public Release by NWS management (Development and Operations Hydrologist and the Hydrologist in Charge of NOAA’s National Weather Service’s North Central River Forecast Center located in Chanhassen, MN). After study of trends in timing for spring snowmelt floods in the Upper Midwest, and backed up by a NOAA Press Release in February of 2000 that global warming was happening, adding something about climate change seemed like the right thing to do. However, NWS management concluded that mention of global warming was political and unacceptible.

  14. Richard Wesley Says:

    Re: #7

    > Why would not you do this “objective” analysis by yourself and show us the results, if you are so sure that
    > the AMO camp is so totally wrong?

    Generally, the person making the assertion is required to produce the evidence. I could claim that cyclical changes in the fundamental phlostigen constants are causing the increase, but why should Professor Crowley be forced to disprove my assertion when I have not demonstrated the existence of phlostigen in the first place? I mean if he has a lot of free time, I’d be happy to point him in the right direction, but I also understand that he may be busy ;-).

  15. Michael Seward Says:

    The Wall Street Journal reported today (June 9, page A11) that melting glaciers promote earthquakes and volcanoes. Glacier retreat induces tectonic activity by “isotopic rebound”. Perhaps worldwide melting of glaciers by global warming will increase the incidence of volcanic eruptions and earthquakes, as well as increasing the intensity of hurricanes.

  16. Pascal Says:

    “A propos: Can there be anything on this planet that is NOT related to the dreaded global warming? ”
    Many things, but this is a thermodynamical evidence that the hurricanes strength increases with the delta of temperature between the warm (SST) and the cold (upper troposhere) sources.
    It’s very strange that NOAA doesn’t recognize it.
    GH effect increases SST and reduces upper troposphere’s temperature.
    Increased thermodynamical yield is not the only reason for the strength of the hurricanes (winds regime is also important), however it’s a necessary condition.
    Maybe it’s not easy to detect the trend behind the noise of chaotic and cyclic variability.

  17. Jeff Huber Says:

    How Melting Glaciers Alter Earth’s Surface, Spur Quakes, Volcanoes” - “Imagine the surface of Earth as a giant trampoline that accumulated a slab of ice over the winter, and you can get a sense of what a growing number of scientists say is in store for the planet as glaciers keep melting. Once the trampoline’s ice turns to water that drips over the edges in the warm days of spring, the concave elastic slowly rebounds to its original flat shape. That’s how Earth responds as glaciers retreat, and the consequences promise to be … interesting.” (Wall Street Journal)
    See even earthquakes are caused by GW

  18. Aubrey E Banner Says:

    I am trying to get a better understanding of the greenhouse gas effect, and I should be grateful if anyone could provide the information I need, or give a website reference.
    1. What is the absorption cross section of a CO2 molecule in the atmosphere for a 10 micron infrared photon?
    2. How many excited states can the CO2 molecule exist in at the same time?
    3. What is the relaxation time of these states?
    4. What is the “down time”, after relaxation, before the molecule can absorb another photon?

    [Response: If you’re just getting started on understanding the greenhouse effect, this is the wrong place to start. Most of these questions are essentially irrelevant to an understanding of the greenhouse effect, or at most involve only very technical or arcane refinements of the understandingof the basic mechanism. For a start, take a look at David Archer’s book, then maybe Chapter 3 and (eventuallly) Chapter 4 of my book (on my web site, linked via teaching->geosci232). –raypierre]

  19. TAC Says:

    Is there any way to distinguish as to the relative strengths of arguments of these two camps? Actually, it is quite easy to do so. If the natural variability argument applies there should be little difference in the statistics of the present phase of the AMO with the past.

    I am curious about the specific statistical tests you have in mind. What precisely is the testable null hypothesis that AMO provides? What alternative hypothesis (preferably with only one tail) does global warming theory provide? Also, how many years of data are likely to be required before we can see a significant result?

  20. Max Says:

    Could someone give me a link to a graph where I can see the actual temperature difference between the two SST and the upper troposphere. I’d like to see it for myself (I trust my eyes :) )?

    Also, the US or Europe is not the problem, if I read the IPCC pages correctly. We already minimized our CO2 and CH4 output, while third world countries are increasing (we are already on the lower end). Or did I read the graphs wrong, if so, how? (IPCC 2001)

    [Response: On a per-capita basis even Europe is still way above the third world in CO2 emissions, and the US is off the charts; a relatively high population plus a large per person emission makes the US a major culprit. However, the large population of the developing world combined with potentially growing per capita emissions makes the developing world a long-term threat to climate. On the third hand, the per-GDP CO2 emission in China is a lot above Europe or the US, so with efficiency improvements their economy could grow a lot without increasing their CO2 emissions. –raypierre]

  21. David B. Benson Says:

    Any decent book on quaternary geology will dispell the disinformation offered in today’s The Wall Street Journal. The areas covered by massive ice caps during the last glacial maximum are still rebounding. Rates on on the order of centimeters per century. Notice any earthquakes or volcanoes in Canada or Scandinavia?

  22. Hasse Schougaard Says:

    Is it possible to get higher resolutions of the two figures displayed in the post above?

    Cheers! :)

  23. Eli Rabett Says:

    First, let me at least claim a bit of credit for being early to point out in early April that everyone (perhaps I exaggerated) makes the mistake of insisting on OR (natural cycles OR anthropic climate change) as the issue wrt the upcoming hurricane season. AND (natural cycles AND anthropic climate change)is what is really worrying for this year.

    Then let me start answering Aubrey Banner

    1. What is the absorption cross section of a CO2 molecule in the atmosphere for a 10 micron infrared photon?

    See JQRST 48 (1992) 537 or the HITRAN data base. The question is not very precise because, first of all, the center of the bending vibrational band is ~ 670 cm-1 which is a lot closer to 14 microns, second, since the spectrum is composed of very narrow lines, if a photon frequency is on line center the absorption coefficient is a LOT higher then if the frequency is between lines.

    2. How many excited states can the CO2 molecule exist in at the same time?

    One, but each CO2 molecule can be in a different vibrational and rotational state. Under normal atmospheric conditions the distribution of CO2 molecules among the states is determined by the local temperature. At room temperature about 6% of the CO2 molecules are vibrational excited.

    3. What is the relaxation time of these states?

    Again, not well defined. The radiative relaxation time is much longer than the atmospheric relaxation time, which is determined by the collision rate. In practice the collisional relaxation time under atmospheric conditions is ~microseconds. The mean time between collisions at atmospheric pressure is of the order of a nanosecond.

    4. What is the “down time”, after relaxation, before the molecule can absorb another photon?

    Zilch.

  24. Pascal Says:

    Re#20

    It isn’t very difficult to find some data about SST and lower strato (or upper tropo).
    For example in the superb site of NOAA.

    For the SST: http://www.ncdc.noaa.gov/img/climate/research/2005/ann/glob_jan-dec_pg.gif

    Anf for the strato: http://www.ncdc.noaa.gov/img/climate/research/2005/ann/st-global-jan-dec-pg.gif

  25. Pekka Kostamo Says:

    RE #11:
    Dust in the area of hurricane birth also (mainly?) comes from the Sahara and the Sahel grasslands south of the great desert, in addition to the industrialized countries further north. As such the dust amount is dependent on many factors, i.e. the easterly winds, a variable regional rains regime and the growing population pressure leading to more intensive agriculture and larger numbers of cattle. The SeaWifs maps the Saharan dust clouds, as will some newer satellites.

    In addition to cooling the sea surface temperature, a high dust content also modifies the cumulus cloud process. During the occasional strong outpourings of Saharan dust, hurricanes are not started - an observation already used by the forecasters (but apparently not yet modeled properly). Understanding dust generation and transport is a key goal of the AMMA campaign, now underway. http://www.joss.ucar.edu/amma/amma_summary.htm

    Increasing amounts of dust from the desert would counter the impact of rising SST (I have seen somewhere that the number of hurricanes on the Atlantic has not risen, although some increase is found of tropical storms in the Pacific). On the other hand, there are contradictory forecasts on the precipitation climate in Western and Central Africa.

    An interesting question is, of course: Is there a critical initial step or combination of circumstances in the hurricane start-up, which could be seen as a separate stage from its subsequent intensification?

    Regrettably, there might be a headline: “Famine in Africa saves American lives!”

  26. Aubrey E Banner Says:

    Re #23

    Many thanks, Eli, for your help.

  27. Michael Seward Says:

    RE: # 21 Benson says “Any decent book on quaternary geology will dispell the disinformation offered in today’s The Wall Street Journal-. Notice any earthquakes or volcanoes in Canada or Scandinavia?”

    Actually, yes. NASA’s Jeanne Sauber says, “Historically, when big ice masses started to retreat, the number of earthquakes increased. More than 10,000 years ago, at the end of the great ice age, big earthquakes occurred in Scandinavia as the large glaciers began to melt. In Canada, many more moderate earthquakes occurred as ice sheets melted there.” The weight of a large glacier on top of these active earthquake areas can help keep things stable. As glaciers melt they lighten the load on the Earth’s crust, allowing tectonic plates to move more freely.
    The researchers believe that a 1979 earthquake in southern Alaska, called the St. Elias earthquake, was promoted by wasting glaciers in the area.

    http://www.nasa.gov/centers/goddard/news/topstory/2004/0715glacierquakes.html

  28. Max Says:

    Re#24:

    Thanks for the graphs. However, those are Annomalies in the mean. Are there also graphs on the actual geographical variance and not the mean?

    It seems that the stratosphere is cooling? How will this affect climate?

    Can the cooling trend of the stratosphere affect the warming or rather trade with the warming of the lower level?
    Since warmer air is expanding due to thermodynamics (or with v=const. pressure will go up), it could exchange with the lower temperature in the stratosphere, or is there some other effect in it?

  29. Leonard Evens Says:

    Re 27:

    I presume someone will answer more completely, but quickly, stratospheric cooling is a prediction of global warming theory. If I am not mistaken, the degree of cooling is consistent with what models predict.

    [Response: Yes, but I think more of it is from Ozone - William]

    [Response: Almost right. The cooling seen in the lower stratospheric MSU 4 record is indeed mostly due to ozone depletion (interrupted by a couple of big volcanoes), but the cooling further up is indeed consistent with the expected forcings from greenhouse gases. - gavin]

  30. Alfredo Says:

    #14, that’s isostatic rebound.

  31. Steve Latham Says:

    http://www.boston.com/news/science/articles/2006/06/09/nasa_shelves_climate_satellites/?page=2

    Looks like some agencies will have even fewer tools available to look at the problem. Will these delays and data gaps relate to AMO investigations specifically? Certainly they’ll affect hurricane science. I don’t think we need more information to begin acting, though it would be nice. Skeptics who say not enough is known (for the purposes of deviating from business as usual) should be really up in arms, no?

  32. Pascal Says:

    Re#28

    For the regional SST look at this link:
    http://okdk.kishou.go.jp/MRCS_SV12/figures/png/7_sst_trend/sst_trend_3.PNG
    As you can see, North Atlantic SST much increased in the last decade.

    For the lower stratosphere cooling it’s a consequence of the GW by GHG effect.
    (and also ozone depletion).
    Another consequence is the decreasing of the north-south thermal gradient.
    Thus, it’s probable that the thermal vertical exchange will increase to the detriment of the latitudinal exchange.
    The consequence is a more frequent deep convection (also more frequent hurricanes).
    An obstacle to this is the temperature increasing of the middle troposphere (more important than the surface).
    But it’s also very probable than high SST will induce an higher instability of the atmospheric layer.

  33. Isaac Held Says:

    In addressing the question of the effects of greenhouse gases on Atlantic tropical storms, it might clarify (and even partially defuse) the controversy to lump internal variability together with other forced responses (particularly aerosols), rather than to focus on internal variability vs the total forced response. No one would claim that the non-monotonic behavior of the temperature time series, globally or in the tropical Atlantic, is due to greenhouse gases! So whether we refer to these multi-decadal fluctuations as the AMO or not, or think that they are forced or free, does not strike me as central to the issue at hand. In addition, both internal variability and aerosol forcing are likely to affect tropical storms in large part though changes in ocean temperature gradients (thereby changing ITCZ position and vertical shear), while greenhouse gases likely exert their influence by more uniformly changing ocean and tropospheric temperatures, so the physics of the problem may suggest this decomposition as more natural as well.

  34. Steve Bloom Says:

    Re #s 21 and 27: Just to add that the reference to volcanos was for ones that already exist. Such an effect isn’t terribly surprising since volcano magma chambers aren’t all that far below the surface.

  35. Hank Roberts Says:

    28 re stratosphere, see also
    http://mustelid.blogspot.com/2005/03/why-does-stratosphere-cool-under-gw.html

    “… the reason that the real atmosphere has a stratosphere is because of ozone absorbing UV, thereby warming that portion of the upper atmosphere”

    The temperature (warmer above) is pictured here:
    http://www.uwsp.edu/geo/faculty/ritter/images/atmosphere/structure_composition/atmospheric_structure.jpg

    [Response: Actually, planets have stratospheres even without ozone or major solar absorption effects. The stratosphere is just what you get where convection hasn’t stirred things up. Without solar absorption in situ, you’d still have a stratosphere, just not one where the temperature goes up with height. It would go down with height, but slowly enough that there would still be strong stable stratification. Venus, Mars and Jupiter all have stratospheres, only weakly affected by solar absorption (due to near-IR bands of CO2 in the former two cases.). Titan has a stratosphere, too, but it warms with height due to absorption by organic haze. –raypierre]

  36. David B. Benson Says:

    Re #21 and #27: Thank you, Michael Seward and Steve Bloom. During LGM and the subsequent melting of the ice, there were no volcanoes in major ice covered areas, other than those associated with the so-called Ring of Fire. That is, Kamchatka and Alaska. In particular, Mt. Elias is on the Gulf of Alaska, a highly tectonically active portion of the Ring of Fire. I opine that a mere glacier would not effect the triggering of an earthquake by more than a few decades, at most. Consider the forces and masses involved!

    Jeanne Sauber’s quote is not information to be found in any of the books on geology or the last glaciation I have read. Admittedly, these are somewhat older books, but one would think that geologists would at least mention a major earthquake in Scandinavia. Perhaps the data is new. I would want to read a paper explaining the observations which give rise to her remarks before I’ll completely accept them. One’s persons “major” earthquake turns out to be only magnitude 6. Now a magnitude 6 earthquake is no fun at all to experience, but not “major” to me.

    Mostly what happened, and continues to happen, is isostatic rebound. I am perfectly prepared to accept that some rather small, say magnitude 2, earthquakes occasionally may occur. However, the Canadian shield is usually consided to be among the most tectonically passive areas in the world, despite the tremendous rebound still occuring in Hudson’s Bay…

    Well, all this is off-topic. The point was one shouldn’t believe everything you read, especially in The Wall Street Journal.

  37. Tom Brogle Says:

    Re 34
    Are there no volcanoes on the Antarctic Peninsula?

  38. Eli Rabett Says:

    The best illustration I know for the relative roles of ozone depletion and increase greenhouse gas concentrations can be found here
    http://www.gfdl.noaa.gov/aboutus/milestones/ozone.html

    My simple explanation for stratospheric cooling can be found at
    http://rabett.blogspot.com/2006/02/why-does-stratosphere-cool-while.html

    William’s explanation can be found here
    http://mustelid.blogspot.com/2005/03/why-does-stratosphere-cool-under-gw.html

    Needless to say he don’t like mine and I don’t like his. I think my explanation got a push forward from
    http://www.gfdl.noaa.gov/reference/bibliography/2005/bjs0501.pdf
    and maybe here
    http://www.gfdl.noaa.gov/reference/bibliography/2006/vr0601.pdf

    We report, you decide

  39. Jim Eaton Says:

    Re #34: It shouldn’t be surprising that melting of a glacier might cause earthquakes. After all, the filling of reservoirs apparently has triggered earthquakes, one being the 1975 Oroville quake (5.7) in Northern California:
    http://www.newton.dep.anl.gov/askasci/gen99/gen99051.htm
    The larger 1967 Konya Dam quake in India (6.9 or so resulting in 200 deaths in this rural area) also was attributed to the additional weight of water in the reservoir, and the shaking has continued for three decades:
    http://www.hubcat.org/Adrienne/Koyna/Koyna_physical.htm
    Seismic activity also has increased since filling began of China’s Three Gorges reservoir:
    http://www.probeinternational.org/pi/index.cfm?DSP=content&ContentID=15282

    So in the right location, the addition or removal of a block of water or ice is known to result in fairly significant earthquakes.

  40. Steve Bloom Says:

    Re #34: This research implicated the Laurentide ice sheet in the recent great earthquakes on the New Madrid fault. The same authors drew a similar conclusion about an area off Norway. Here is something along the same lines on volcanos in Iceland.

  41. raypierre Says:

    I was rather taken aback by the following statement from a NOAA administrator, reported in the NYT article:

    —–
    Stanley B. Goldenberg, a meteorologist with the Hurricane Research Division of the National Oceanic and Atmospheric Administration who has expressed skepticism about any connection between global warming and hurricane intensity, said he had not seen the new papers but had read nothing in other recent research to change his view.

    “There’s going to be an endless series of articles from this circle that is embracing this new theology built on very flimsy interpretation” of hurricane data, Mr. Goldenberg said. “If global warming is having an effect on hurricanes, I certainly wouldn’t base it on the articles I’ve seen.”
    ——

    “This circle” in the quote refers to a large number of professors at top atmospheric science departments, at least one of whom has written the definitive textbook on atmospheric convection and was so talented that the department awarded him a PhD for something he submitted as a Masters thesis; another has won numerous awards for his work on tropical meteorology. If NOAA isn’t willing to listen to “this circle” I shudder at the thought of whom they are listening to. As noted already, “This circle” is willing to admit uncertainties in the analysis and a partial role of natural variability. It’s “The Other Circle” that is unwilling to even admit the possibility of an effect of global warming. They repeatedly express complete and unqualified faith in the tenet that only natural variability accounts for the recently increasing strength of hurricanes.

    So, which circle is it that truly subscribes to a “new theology?”

  42. Roger Hill Says:

    Re #41

    Yes this comment is very disturbing as your and my tax dollars have been going to them, (whether or not we get funding) and I wholeheartedly agree with what NOAA/NWS has done in the past. But to my astonishment, I will now have to jump off thier ship (the Titanic) if they are to make such political potent statements.

    I used to think of the government as for all of us. NOAA’s mission statement is to “protect life and property”, NASA’s is “space exploration and to protect Planet Earth”. They better get their houses in order here or there’s going to be trouble and not neccesarily from pissed off tax payers in the know and ahead of thier politcal curve.

    I also find their cutting of the funding for Hurricane research environmental monitoring satellites disturbing. Somebody should graph that one!

    Sticking one’s head in the sand does not change reality. Having said this I know all of NOAA’s NWS workforce is not on board with such scientific ignorance.

    Calling all congressman and senators - now is not the time to go to sleep on this research as to not upset a particular lobby. Vote by paper!
    RH

  43. Leonard Evens Says:

    Re 41 and Goldenberg’s comments:

    He seems to know in advance that anything the “circle” says is wrong even without examining their arguments and criticizing them in detail. The articles in in Realclimate represent a different attitude. No idea is automatically rejected based on its source. There have to be convivncing arguments for so doing.

  44. wayne davidson Says:

    #41, The likely connection between Hurricanes and Global Warming is right in front of us, the Hurricane season does not occur during winter when SST and ST’s are colder, so for any meteorologist to say that there is no possible connection is ludicrous.

  45. Eli Rabett Says:

    Goldenberg certainly is active in hurricane research, but he also is deep in the Landsea ocean (you can google his CV). If, on this sunny Sunday, one were inclined to be cynical, one would these attacks as an orchestrated tactical response, extending from Bill Gray on the rabid side to he who must not be named on the more reasonable end, coordinated through CEI and NOAA.

    There are two ways of dealing with this. There is the scientific way, which Leonard Evans points to, where arguments and data are discussed and reconciled. A fair amount of barracking is allowed, some elegant, some brutal. Unfortunately as we have seen with climate change, this neither reaches nor is understood by the public until it is pretty close to too late.

    The other is to turn the tactic back on the attackers. The line of attack is clear and correct. Joel Achenbach started down that track in his recent Washington Post article. Show them as rabid dinosaurs, whom science has passed by. They are placidly grazing beasts ignoring the dangers around them and us. And above all, when they reply with wounded bleating DO NOT APOLOGISE http://tinyurl.com/create.php Point them to some of the things that the Gray’s of the world have uttered. These folks are neither your friends nor your colleagues, but want you to think that they are in order to exploit you for their purposes.

  46. Coby Says:

    Re 41 and the OP,

    I look forward to RP Jr.’s criticism of this. He took the NYT to task (IMO a bit unfairly) for giving less airtime to the “it’s natural” camp in this debate.

    Roger? Is one forthcoming? I will look for an oppurtunity to poke him over at his place as it is not certain he will read this.

  47. Hank Roberts Says:

    Eli, re stratosphere, see also response by Ray’s (comment on my 35)?

    My 35 was in reply to Max’s question in 28 — the stratosphere’s not going to exchange places with the lower atmosphere because the lower atmosphere warms and the stratosphere cools; they’re not changing enough to swap places.

  48. Isaac Held Says:

    Am I alone in being disappointed in the growing ratio of rhetoric to rational discussion of science on this site (especially on this topic)?

    Here is my attempt at defining the crux of the scientific controversy about Atlantic hurricanes and global warming (putting aside the key question of data quality). This is in part a reaction to Tom’s call at the top of this thread for a “detection and attribution approach to the alternative explanation of the AMO”, which I did not understand, and expands on my comment #33.

    There are two distinct issues, at least, and it helps to keep them clearly distinguished.

    1) Is the effect of the ocean on tropical storm statistics primarily local (with tropical Atlantic temperatures controlling Atlantic storm statistics) or are nonlocal effects of comparable, or even greater, significance? The best example we have of non-locality is El-Nino, wherein changes in temperature in the Pacific clearly influence the Atlantic storm season, through some combination of changes in vertical shears and a tropospheric warming that stabilizes the atmosphere to convection over the Atlantic. One can simplify this dynamics to say that it is the result of warming in the Pacific unaccompanied by comparable warming in the Atlantic. Analogous things can happen on multi-decadal timescales. A session at the most recent AGU Spring meeting was devoted to the possibility, suggested by models and paleo evidence, that the latitude of the
    ITCZ can be displaced by perturbing the system in middle and high latitudes. ITCZ position is thought to be important for Atlantic tropical storm statistics. Sahel rainfall is also related in part to ITCZ displacements and is correlated with Atlantic storminess. Although there is controversy about the details, models are in general agreement that the Sahel drought of the 1970-80’s can be simulated in large part if one cools the North Atlantic with respect to the rest of the world oceans.

    Researchers who have traditionally focused on seasonal or shorter time scales talk about things like vertical shear, ITCZ latitude and African wave characteristics as centrally important. To the extent that these are controlled by ocean temperatures they are likely to be related to differential changes in ocean temperature and not simply local absolute temperatures over the tropical Atlantic. Is the data good enough to clearly justify the superiority of the local perspective on the SST/tropical storm link. I am not sure. In any case, the possibility of non-local control needs to be addressed more systematically to make contact with this other community of researchers.

    2) Given an oceanic temperature predictor of tropical storm statistics, can one decompose the variations in this predictor over the 20th century into parts contributed by a) greenhouse gases, b) other external forcing, and c) internal variability? This question seems to be framed typically as forced (a+b) versus free (c). Both (b) and (c) are expected to contribute to differential oceanic temperature changes varying non-monotonically in time, with (a) providing a somewhat more spatially uniform and monotonic background. For that reason, I suggested in #33 that it may make sense to frame the question as (a) vs (b+c). Also, because of limited confidence in the multi-decadal dynamics of our climate models and the uncertainty in aerosol forcing, one can foresee the problem of separating (b) from (c) as being with us for some time. And, of course, it is (a) that is primarily needed to project to the end of the 21st century.

    Would the results of such an attribution study be sensitive even to a rather modest admixture of non-local effects into the predictor?

    [Response:I suppose that by differential oceanic temperature you mean the same thing as I when I say spatial SST gradients (i.e. how sea surface temperature varies geographically)? If this is the case, then there is also the question if the statistics of cyclogenesis, pressure depressions (intensity), or associated rainfall vary linearly or non-linearly as the absolute levels of SST change (maybe since the saturated water vapour pressure is not a linear function in temperature?). One admitedly hand waving arguement is that if the absolute SST is lower than 20C, then no SST gradients would not suffice for tropical cyclone generation. That said, I don’t know the answer to this, and I’m not aware that this question has been addressed. -rasmus]

  49. wayne davidson Says:

    I like to debate the finer points of this subject, where there might be legitimate theories to explore and expand on, but when contrarians, either lay or scientist contrarians propose dumb ideas, they should be responded with the clearest logic possible. I see how bad ideas remain in the populace, how sound science gets buried, as another recent example, a contrarian proponent having the ears of millions suggests something really dumb like where are those 200,000 year old cars?

    http://mediamatters.org/items/200606080005

    The media outlet carrying this contrarian is of course not responsible for what he says, but may care about very basic science which just got trashed, no immediate scientific response is where they the contrarian gets away with transforming science into nonsense. AGW theory gets slashed 1000 times over before a response is done, and the dumb idea grows legs.

    [Response: It’s appalling that something like this would come from a CNN news host (Glenn Beck, albeit on his radio show rather than on CNN itself). I’d expect it from Fox or from Milloy, but that such bad science even gets play from CNN people is just awful. Not only does Beck compare Gore to Hitler, but he gets the science even more egregiously wrong than George Will or professional contrarians such as Pat Michaels. To begin with, Beck claims that because CO2 varied naturally in the past, there’s no case for the present rise being due to human action — a claim that is equivalent to casting doubt on the human cause of the recent CO2 rise. Even contrarians admit that there’s no doubt about the human cause of the recent CO2 rise, at least when they are talking to people who are not completely naive. Beck further claims that if CO2 were to rise as much as Gore said it would, “then the temperature here on planet Earth will be about 400,000 degrees. We’ll be the sun; we’ll be the frickin sun. ” — a claim that is nowhere in Gore’s movie or book, is utter nonsense scientifically, and was just made up out of whole cloth by Beck. (Even Venus, with a 90 bar CO2 atmosphere and being closer to the Sun is only 730K, and even if you took away the clouds and threw in another 90 bars of evaporated ocean you don’t get much higher than a few thousand degrees) Awful.

    I think the only way we are ever going to stamp out such nonsense is if there get to be charismatic media personalities that know the science needed to shoot down such nonsense, but also know how to present it in an engaging and entertaining way that makes people sit up and take notice. We also need politicians with similar abilities. We need to keep the discussion on a level of sound science, sure, but we need people who can make Beck look as ridiculous as he really is. Meanwhile, maybe it would help if people wrote to Beck, to CNN and to Premiere Radio Networks (which carries his radio show) to let them know how out of line he is. The relevant email addresses can be found in the MediaWatch link above –raypierre]

  50. Eli Rabett Says:

    I would reply to Isaac Held by saying what Wayne Davidson said, with the addition that one should be able to walk and chew gum at the same time. In practice this means making a value judgement as to who is playing which game, but so be it. The denialists have set the rules for any interchange and there is no reason to apologize to them for anything, indeed, experience has shown that it is dangerous to do so.

    In reading Isaac Held’s post, the thought came to me that sea surface temperature might be a simple and available metric, but that more sophisticated measures might be needed to advance the argument, for example one which quantified the amount of heat energy available (perhaps in spirit close to some ideas that Roger Pielke Sr. is advancing). The issue then becomes whether such parameters can be reconstructed for a long enough period from data we currently have.

  51. Steve Bloom Says:

    Re #48: Isaac, are you keeping up with all the papers? I think we all like the science, but the nature of the AGW-hurricane “controversy” is such that it’s become hard to separate science from politics. When NOAA uses an unqualified person like Stan Goldenberg (look at his CV if you don’t believe me) to attack people like Kerry Emanuel, Peter Webster, Judy Curry, Tom Knutson, Greg Holland, Kevin Trenberth, etc. as having drawn conclusions based on theology rather than science, there’s something wrong with this picture.

    My interpretation of Tom’s remark about detection and attribution is that what we might term the NOAA-Gray camp has nothing, while the soon-to-be published Emanuel and Mann (2006) closes the circle on the other side. I have yet to see the new paper, BTW, but I think the case was pretty complete without it. This new BAMS review paper here (and note that list of authors!) sums up the present science nicely, plus there’s obviously much new work on the way. Of particular interest is this in-press BAMS paper elaborating on Emanuel’s work; the finding of high-frequency relationships between multiple AGW effects and hurricanes seems to render unlikely Chris Landsea’s expressed view (hope?) that his reanalysis of early hurricane observations will substantially undermine Emanuel (2005) and Webster et al (2005).

    Recall that recent prior discussion on this site included a comment from NOAA’s Methuviel Chelliah that, contrary to last fall’s official NOAA statement, the recent work by him and Bell did *not* constitute any sort of case for AMO (or other natural cycle) causation. After that part of the controversy went public, NOAA had to strike the Bell and Chelliah (2004) reference and substitute a reference to Goldenberg et al (2001). I think it’s fair to characterize this latter paper as merely speculating about natural cycles. Similarly, we saw here that Bill Gray’s attempt to link Atlantic tropical cyclones to the thermohaline circulation was an unpublishable embarrassment. Recent NOAA-Gray camp papers from Klotzbach and Michaels et al purporting to find fault with Emanuel (2005) and Webster et al (2005) have defects that were obvious even to my amateur eyes.

    Summing up, it appears that the scientific case for the AGW-hurricane link is now very strong, and that NOAA’s contrary stance favoring natural cycle causation is based on belief rather than science. Theology, anyone?

  52. S Molnar Says:

    Re #49: “The media outlet carrying this contrarian is of course not responsible for what he says”. I beg to differ. The management of the radio, television, and newpaper outlets that carry this sort of thing know exactly what they are doing, have a surprisingly small number of owners, and are very much responsible for the content that they purvey. Education is a good thing, but, in the short run, I believe the only effective way to counter this is economic and political action (a topic for another website).

  53. Mark A. York Says:

    And another attempt at obsfucation by George Will:

    “Minutes after Gore said that “the debate in the science community is over,” he said “there is a debate between the American ice science community and ice scientists elsewhere” about whether the less-than-extremely-remote danger is a rise in sea level of a few inches or 20 feet . And he said scientists “don’t know what is happening” in west Antarctica or Greenland. So when Gore says the scientific debate is “over,” he must mean merely that there is consensus that we are in a period of warming.

    This is not where debate ends but where it begins, given that at any moment in its 4.5 billion years, the planet has been cooling or warming.”

    [Response: What is obvious to everybody but Will and his like is that Gore’s statement means there is a consensus that we are in a period of warming, that it is caused by anthropogenic greenhouse-gas emissions, and that the world will continue to warm considerably if emissions continue at anything like their current level. Where the debate starts, then, is over what the warmer world will really be like and how bad the consequences will be — how much of Greenland and the West Antarctic Ice sheet might go, the distribution of severe drought and heat waves, and the like. –raypierre]

  54. Steve Bloom Says:

    Re #50: Eli, in addition to the second paper I linked above, which extends Emanuel’s analysis to reflect the various AGW-related variables affecting hurricanes, have a look here and here to see how ocean heat energy is already being tracked and analyzed.

    Re #53 response: Ray, let’s give Will full credit. He understands the difference perfectly, and confusing the larger debate with the debate over the details was a conscious act of obfuscation as Mark correctly noted. This sort of cheap attempt to trick his less-informed readers is very odd coming from a guy who supposedly prides himself on intellectual integrity.

    [Response: Agreed. –raypierre]

  55. Steve Bloom Says:

    Re #51: I should hasten to clarify that my dissing of the NOAA stance on the hurricane-AGW connection was of the *official* stance. Of course most NOAA scientists know better.

    Re #11 response: Ray, the new Emanuel and Mann paper seems to still be unavailable, at least on the AGU site (which as of late Sunday night still has the June 6th issue of Eos). Do you have another link?

  56. Michael Jankowski Says:

    Re#43 Leonard, not quite so - see the comment in post #170 on this thread for example http://www.realclimate.org/index.php/archives/2006/05/al-gores-movie/

    [Response: This is hardly a fair remark. The part of the referenced comment I deleted was just an inflammatory screed, not a scientific argument of any sort. Moreover, in the referenced comment, I’m not ignoring Bill Gray’s ideas because they come from Bill Gray. In fact I took quite a lot of time reading over his paper, as you’d know if you read the post on Gray’s latest attempt. I’m ignoring Bill Gray’s ideas because I looked at them and they are rubbish. Of course, time is short and if one looks to some source over and over again and finds that the ideas are consistently rubbish, one tends not to be inclined to waste much more time hoeing that row. But I’ve even gone into things on Milloy’s site and given them serious consideration (e.g. the claims in the “greenhouse primer” there regarding what the Earth’s temperature would be in the absence of convection). You’re going for a cheap shot here, but as far as I’m concerned, you’ve just shot yourself in the foot. –raypierre]

  57. Eli Rabett Says:

    Thanks for the interesting references Steve. To me the pressing issue is whether the ocean heat energy content can be inferred back far enough that we have a useful climatological record. After all, thirty years from now is a bit long to wait before doing anything

  58. Carl Christensen Says:

    On a related note to the media screwing up the science, here is a Canadian paper “debunking” Gore’s movie with appeals to (what they claim are) the “experts” in climate science (one of whom was a nutjob I met at EGU):

    http://www.canada.com/nationalpost/financialpost/story.html?id=d0235a70-33f1-45b3-803b-829b1b3542ef&p=1

  59. Michael Jankowski Says:

    Re#56 (raypierre), I think it was perfectly fair remark based on the first line of your response in the link. But I appreciate that you left the post up so that others could judge for themselves and further commenting so as to try and clarify things.

    While posters seem more guilty of it than people such as yourself, an idea in the commentary attached to the names Christy, Milloy, Michaels, Lindzen, McIntyre, etc, is often instantly (and generally vehemently) dismissed because of the name attached to it (sometimes jusifiably so, but that’s not always clear).

  60. Ike Solem Says:

    According to these pages, NOAA seems to be predicting that 2006 will be a worse hurricane season then 2005, assuming they haven’t changed their prediction methodology:

    NOAA 2006 Atlantic hurricane outlook

    NOAA 2005 Atlantic hurricane outlook

    All the indicators seem to be in place for another massive hurricane season; all the future warming trends, such as weakening trade winds, northwards expansion of the Hadley cell circulaion, warming equatorial ocean currents, increased moisture in the atmosphere, etc. - seem to point towards a greater and greater incidence of hurricanes in coming decades. Blaming all this on a North Atlantic multidecadal oscillation pattern (which must be coupled somehow to ocean circulation), and which is supposed to undergo a “future downswing” is not supportable by any rational stretch of the imagination.

    Regarding #13 above:
    “After study of trends in timing for spring snowmelt floods in the Upper Midwest, and backed up by a NOAA Press Release in February of 2000 that global warming was happening, adding something about climate change seemed like the right thing to do. However, NWS management concluded that mention of global warming was political and unacceptible.”

    I think what the NWS managers really meant was that mention of global warming was “politically unacceptable.” That’s especially true if they wanted to keep their government careers intact.

  61. Ike Solem Says:

    A quick follow-up:

    The NOAA group has produced a “seasonal climate summary” addressing the 2005 hurricane season; it may be found at NOAA’s pdf archive page. The title is ” The 2005 North Atlantic Hurricane Season A Climate Perspective “.

    The most curious thing about this ‘paper’ is their list of references - limited almost entirely to themselves and to Dr. William Gray! Now, if you read a scientific article where the only references included are to the author’s previous work, you might - maybe- imagine that they have very biased viewpoint. As one might expect, they religiously avoid use of the phrase “global warming”, but they do mention “the multi-decadal signal” over and over again.

  62. Grant Says:

    I’ve seen enough graphs of SST versus PDI (power dissipation index for tropical cyclones) to know that the link between increased SST and PDI is strong enough to be probable. But I’ve also done enough time series analysis to know that the available data are not sufficient to establish the link beyond doubt.

    What I haven’t seen is the data on which researchers establish the existence of the “multi-decadal oscillation.” I have the impression that actual SST records don’t go beyond a century, perhaps only about 50 years. Establishing the existence of a genuine oscillation with a *multi-decadal* timescale based on only 50 years data is, simply put, just not possible (from a purely statistical sense); it could be suggested, postulated, but by no means *established* by such a short time series. Doing so with only 100 years data, is dicey at best.

    So: what’s the real evidence for the multi-decadal oscillation? Are there reliable temperature proxies that can be used to extend the ocean temperature record in the Atlantic? How far back do the actual time series go? The proxy record?

  63. Michael Jankowski Says:

    Re#61 Grant,
    Not much detail here, but from NOAA FAQ:

    http://www.aoml.noaa.gov/phod/amo_faq.php

    “…Is the AMO a natural phenomenon, or is it related to global warming?

    Instruments have observed AMO cycles only for the last 150 years, not long enough to conclusively answer this question. However, studies of paleoclimate proxies, such as tree rings and ice cores, have shown that oscillations similar to those observed instrumentally have been occurring for at least the last millennium. This is clearly longer than modern man has been affecting climate, so the AMO is probably a natural climate oscillation. In the 20th century, the climate swings of the AMO have alternately camouflaged and exaggerated the effects of global warming, and made attribution of global warming more difficult to ascertain.”

  64. Roger Hill Says:

    I think what the NWS managers really meant was that mention of global warming was “politically unacceptable.” That’s especially true if they wanted to keep their government careers intact.

    Comment by Ike Solem â?? 12 Jun 2006 @ 12:17 pm

    Maybe if enough of them stood by the science instead of their position. Many are retiring and geting out in the nick of time, and I suspect like the general’s they will start popping off. NOAA - another arm of Karl Rove’s army. DisGUSTING

  65. Steve Bloom Says:

    Re #61: Grant, Tom Crowley’s major point was that the natural cycle folks have essentially nothing. It’s time for them to put up or shut up. Regarding the connection of global warming to PDI (or any other TC-related statistic), of course there will always be some uncertainty. Chris Landsea continues to claim that his reanalysis of historical data will undermine the global warming case, but I think there are growing doubts about that. As far as the case for the natural cycle goes, I think there’s still nothing more than Goldenberg et al (2001); i.e., there’s not much of a case.

    The scientific discussion will get a lot more pointed and overlap even more into the political arena if this season is anything like last year’s. Alberto’s precocious behavior may be a harbinger of things to come.

  66. pat neuman Says:

    re 59. … what the NWS managers really meant was that mention of global warming was “politically unacceptable.” …

    Why was mentioning global warming considered “politically unacceptable” by NWS managers in Feb/March of 2000?

    The director of NOAA warned the public about global warming on national TV in Jan. of 2000 (CBS). At the same time, NWS managers said global warming was too political to talk about at work or with the public.

    It was obvious that Al Gore’s 1995 book on global warming was not recommended reading materials for NWS staff, before or after G.W. Bush took office in 2001. NWS was not following the same chain of command in 2000 as it is now.

  67. Don Baccus Says:

    re 59: “According to these pages, NOAA seems to be predicting that 2006 will be a worse hurricane season then 2005, assuming they haven’t changed their prediction methodology…”

    From CNN:

    More than 20,000 people along Florida’s Gulf Coast were ordered to clear out Monday as Alberto — the first tropical storm of the new hurricane season — unexpectedly picked up steam and threatened to come ashore as a hurricane.

  68. Carl Christensen Says:

    What will be interesting to “track” is if we get say 7 out of 10 “record years” of hurricane intensity & frequency, will they keep saying it’s “natural variability” and we just haven’t “peaked” in this cycle yet? Talk about “new theology!” ;-)

    [Response: That’s essentially what they’re already saying. The prediction, if I may paraphrase it, is for another decade of anomalouslly strong hurricane activity due to natural causes. Probably they’ll insist on another ten years after that to admit there’s something wrong with the natural cycle idea. Thus, they manage to put off facing facts for around twenty years, by which time people will start arguing that it’s too late to do anything to reduce emissions, so we might as well just get used to it. –raypierre]

  69. joel Hammer Says:

    http://www.canada.com/nationalpost/financialpost/story.html?id=d0235a70-33f1-45b3-803b-829b1b3542ef&p=1

    Interesting. Is all. Are all these quotes taken out of context?

    [Response: No, they’re not taken out of context. Almost without exception it’s just well-trodden and already-debunked stuff from the skeptics standard playbook (e.g. the usual lies about water vapor), and quotes from the usual crowd of skeptical talking heads (Max Mayfield, Tim Ball, etc.). This is just the standard smear. I think we scientists on RealClimate, as well as the scientists who weighed in on our discussion of Gore’s movie, as well as essentially everybody I’ve heard from who is active in research in this field agrees that Gore has done a remarkably good job in putting together the scientific argument in a respectable way. Nobody is laughing at Gore, least of all scientists. It’s interesting to see that the Financial Post’s standards of journalism are no better than those of the WSJ editorial page. Not surprising, but always disappointing. I’ll leave it to other readers to comment on the individual points claimed in the article, as it’s all well-trodden material here. –raypierre]

  70. Isaac Held Says:

    Steve (#51), thanks for the detailed response to my #43.

    The only major problem that I have with Anthes et al is when they downplay the gross quantitative disagreement between the relatively modest strengthening of storms in the modeling study of Knutson and Tuleya and the 70% increase in Emanuel�s analysis of the power dissipation index since the 1970�s. I am not aware of any theories/models that help us understand the magnitude of the latter. At this point in time the argument for these very large response relies entirely on statistical analysis of observations. Hopefully this will change soon. We have all been misled on occasion by correlations that look convincing at first sight. Until we have better support from theory/modeling, and given the extraordinary importance of this subject, it is important to look hard to see if there are effects that complicate the naïve interpretation of these fits.

    The paper by Elsner et al that you also link to is a nice start in this direction. Their statistical fit implies that if you warm the climate uniformly you get a somewhat weaker response in the hurricane index than if you just warm the tropical Atlantic. So if there is a mix of globally uniform warming and internal Atlantic variability going on, the simplest regression of storms versus Atlantic temperatures would inaccurately over-emphasize the uniform component. A very strong response remains, but this is precisely the kind of multivariate analyisis that we need to help clarify things.

    With regard to Grant�s question in #61 with regard to proxy evidence for the AMO, it would be nice to hear from Mike Mann, who knows as much about this as anyone and seems to have changed his view on this subject recently. Mike may be waiting until his paper with Emanuel on this topic is publically available. Here is a reference in the interim: http://holocene.meteo.psu.edu/shared/articles/KnightetalGRL05.pdf

    [Response: Thanks Isaac, as usual your comments are very much appreciated here. The Mann and Emanuel Eos article is now out, so folks can see what we have to say rather than rely on hearsay. Some who have claimed that I’ve “changed my mind” about the AMO simply haven’t seen our arguments. Our paper, despite the rumours, does not challenge the existence of the AMO. It does challenge the notion that the AMO has played a significant role in long-term tropical Atlantic SST variations. We note that previous model simulations as well as past statistical analyses that take into account the non-linear nature of the trend in attempting to isolate the “AMO” signal, find little support for any substantial modulation of tropical Atlantic SST by the AMO. Most of the AMO SST variability is in the extratropics. After accounting for the fraction of tropical Atlantic SST variability over the Main Development Region (MDR) associated with global SST trends (which account for most of the forced long-term SST variability as it is represented in the global mean), the residual (i.e., the portion of SST variability “local” to the MDR) only shows evidence for a statistically significant spectral peak in the multidecadal range if you keep the past 40 or more years of data. If you analyze from say 1870-1950 or even 1870-1960, there is no multidecadal spectral peak that is significant relative to a red noise null hypothesis. In other words, its the recent cooling trend from the 50s through the 80s that gives rise to the spectral peak. The “multidecadal” signal is not robust. We then note that this late 20th century relative cooling trend has typically been associated in past work with anthropogenic tropospheric aerosols. Analyses of some recent simulations using the GISS ModelE suggest that there is a huge aerosol cooling (more than -1 C) in the MDR during the crucial Aug-Oct season. This reflects almost -0.5C more cooling than in the global mean for the same season. Accounting for this local and seasonal enhancement of tropos. aerosol cooling, we can describe most of the long-term tropical Atlantic SST without the need to invoke a substantial “multidecadal oscillation” (which, again, is not supported for the MDR by past work on the AMO). Our simple statistical model trained on data through 1969 successfully predicts the subsequent behavior in the following decades, suggesting that our model is perhaps capturing the essence of what is going on. It raises the bar, at the very least, for claims that the recent tropical Atlantic SST trends can be definitively attribued to the AMO. We also show that it is difficult to argue for an AMO signal in long-term records of tropical cyclone activity. Those interested should read the paper for further discussion. –mike]

  71. llewelly Says:

    10 Most active seasons since 1950 by ACE:

    Year ACE
    2005 248
    1950 243
    1995 228
    2004 225
    1961 205
    1955 199
    1998 182
    1999 177
    2003 175
    1964 170

    56 years of records, 6 of the top 10 within the last 10 years.

  72. Timothy Says:

    Re: #71 - Yes, but the *really* interesting thing about your list is that the other 4 of the top 10 lie in the relatively narrow range of 1950-1964.

    It strongly suggests that there is a cyclic component to Atlantic hurricane activity, and that the amplitude of this cyclic component is greater than increases due to GW [of ~0.6C globally so far, but Ocean less than this].

    The problem is coming up with a sensible estimate for the increase in hurricane activity for GW 10x the present level, which isn’t that outlandish when you consider the lag in the SSTs.

    It doesn’t help that the resolution of the climate models currently used for century-scale predictions are too coarse to resolve hurricanes. I imagine that in a couple of decades time that won’t be so much of a problem, but I feel that it would be getting a bit too late to make decisions about CO2 reduction by then.

  73. Lynn Vincentnathan Says:

    RE #4, I read in the Chicago Trib (buried on some back page) during the Clinton administration that VP Gore had worked to make gov energy efficient to the tune of saving $1 billion per year. Too bad I didn’t see it featured on TV or elsewhere. Of course, if people aren’t wasting their money on inefficiency, then companies might lose — unless they too decide to become efficient.

    RE the topic, I’ve been making similar arguments about hurricanes & GW, and that if it’s just natural things increasing them now, then we really have a lot worse to expect in the future, so we really must redouble our efforts to reduce GHGs (& save money to boot).

  74. pat neuman Says:

    Would a larger tropical imply more hurricanes?

    Tropics are expanding, study finds

    … “The tropics - the globe’s most torrid climate belt - have widened during the past 27 years, expanding toward the poles by an average of about 140 miles, according to new research.” …

    … “These temperature patterns were a surprise. Climate models looking at the effects of global warming have captured the poleward migration of the jet streams. But models also suggested that “the tropics would almost behave like a slab,” warming rapidly but fairly evenly between 35 degrees north and south, notes John Wallace, a University of Washington atmospheric scientist and another member of the team. Instead, the outer tropics are warming faster than the deep tropics.

    “Are the models missing something?” he asks.” …

    http://www.csmonitor.com/2006/0526/p02s02-sten.html

    [Response: Rasmus and I will be discussing this work, and related modelling work, in Part III of our series on global change and circulation. It’s very interesting and important work. –raypierre]

  75. llewelly Says:

    Re: #71 - Yes, but the *really* interesting thing about your list is that the other 4 of the top 10 lie in the relatively narrow range of 1950-1964.

    What were those other 4 again?

    1950 243
    1995 228
    1961 205
    1955 199

    1995 is not within the last 10 years, but it is also not within the Dr. Gray’s much beloved 1950-1964 period.

  76. llewelly Says:

    What were those other 4 again?

    1950 243
    1995 228
    1961 205
    1955 199

    1995 is not within the last 10 years, but it is also not within the Dr. Gray’s much beloved 1950-1964 period.

    After re-reading this post I realized my original post is mistaken; only 5 of the last 10 years are amoung the top 10 years by ACE. My second post was also mistaken; the other 4 are:

    1950 243
    1961 205
    1955 199
    1964 170

    which as Timothy points out are between 1950-1964.

    I apologize for any confusion.

  77. Brian Gordon Says:

    Re: 69: http://www.canada.com/nationalpost/financialpost/story.html?id=d0235a70-33f1-45b3-803b-829b1b3542ef&p=1

    I sent a response to the Post about this. Unfortunately, I can see where the piece is very convincing to someone lacking background. He quotes numerous scientists, mentioning their university or government positions to add credibility, and all say GW is rubbish to greater or lesser degree. If someone threw many of these arguments at me, I would be at a loss. For example:

    “In fact, the correlation between CO2 and temperature that Gore speaks about so confidently is simply non-existent over all meaningful time scales. U of O climate researcher Professor Jan Veizer demonstrated that, over geologic time, the two are not linked at all.”

    As a layperson, this sounds very convincing. A University of Ottawa climate researcher says so, which means, at least, that there is debate in the scientific community. Presumably, U of O would not want their academic reputation damaged by patently false statements by their professors, so the unaware reader could easily believe that the U of O climate department supports this view. I looked up Veizer on U of O’s website, and he published the article in Nature on December 7, 2000, so he qualifies as a credible scientist. Has the research been discredited?

    http://www.uottawa.ca/vr-recherche-research/perspectives/v4n1/412.html
    “Veizerâ��s paper, ‘Evidence for decoupling of atmospheric CO2 and global climate during the Phanerozoic eon’…[c]o-authored with Yves Godderis and Louis M. François, of the Laboratoire de Physique Atmosphérique et Planétaire at the University of Liège in Belgium, the paper points to the unclear causes for the ice ages and warm periods that have punctuated the earthâ��s climate throughout the last 600 million years.”

    “â��The climate pattern mandated by these observations may require reconsideration of the role of CO2 as the principal driving force of climate changes on geological time scales,â�� they concluded.”

    “â��I never said CO2 was not a greenhouse gas,â�� [Veizer] says. â��But there is this one political dogma: CO2 equals global warming, equals climate change, equals disaster. Now, the further you go along this equation, the iffier it is scientifically. But the moment you step away from this dogma you are excommunicated. You are undermining the environmental agenda.â�� He adds that he never intended to attack anyone who wants to preserve the physical integrity of our planet. But he does worry that if such efforts depend on incomplete or flawed science, the predictions could well prove to be inaccurate and the entire environmental agenda could be discredited.”

    Help?

    [Response: This is a classic case of an unscrupulous newspaper trumpeting a claim that does not imply what it seems to imply (even if it were correct) and moreover has been found to have serious flaws. An honest paper would not do this, but unfortunately wilful malfeasance of this sort is effective, especially when read by people who have a strong personal, ideological or financial interest in believing what their paper is telling them. In this case, the Veizer claim has little or no implications for 20th century warming. He looks at supposed correlations between CO2 and temperature over the grand sweep of time (e.g. Cretaceous hothouse vs. cooling going towards the Pleistocene) and supposedly finds that temperature doesn’t go in lock step with CO2. There are a number of flaws with this — among other things, CO2 isn’t the only influence on climate over this time period, since the changes in continental configurations can also have a big effect. There area also major flaws in his reconstruction of CO2 over the past, and the claim that the temperature proxies used really represent global temperatures is questionable. Veizer (primarily in the GSA paper by Shaviv and Veizer) make the speculative claim that basically cosmic rays explain everything. However, regardless of the validity of Veizer’s work, the National Post article is blatantly misleading when it implies that Veizer’s results contradict Gore’s statements about correlation of CO2 and temperature, because Veizer’s paper applies to the long term changes over the past 600 million years whereas the correlation featured in Gore’s movie applies to the glacial-interglacial cycles of the past 800,000 years. Nobody seriously doubts these correlations, which rely on absolutely firm ice-core data.

    Even if the claims were right, they would have essentially zero implications for anthropogenic global warming, since they do not disprove the basic physics behind the greenhouse effect, or negate the direct evidence for the role of CO2 in 2oth century climate, or the evidence for the validity of a positive water vapor feedback. Even if it turned out to be true that cosmic rays had a significant impact on climate, that wouldn’t negate what we know about climate forcing from direct evidence in the 20th and 21st century. However, the claims by Shaviv and Veizer are highly questionable. Pointers to the discussion, particularly the Rahmstorf et al EOS paper exposing flaws in Veizer’s work, can be found in the post on peer review: http://www.realclimate.org/index.php/archives/2005/01/draft-do-not-post/en/ . Nir Shaviv claims to have responded to this article, and will no doubt want to re-start the argument on cosmic ray forcings, but I’d ask him not to as we’re unlikely to go through anything different than we did last time. Interested readers can check out the comments under “Thank you for Emitting.”

    Part of the reason articles like the National Post one can happen is that some scientists, e..g. Veizer, have attached unjustified and irresponsible claims to their work. However, I don’t really fault the scientists, though if Rahmstorf et al is right, there may be more to criticize in Veizer than just carelessness and incompleteness. Notwithstanding that, there are real puzzles in past climate, and if somebody wants to put an idea on the table and defend it forcefully, that should be be possible without the risk of the media distorting the implications of the results. I’d hate to see things get to the point where scientists would have to write defensively to avoid every possibility of being misquoted. That would get in the way of the free flow of ideas. All of us who work in past climates are well aware of the remaining mysteries, not least the puzzle of low gradient hothouse climates — recently compounded by results from the first-ever Arctic deep-time seafloor core. Uncertainty of this sort could well imply missing feedbacks that will make the climate’s response to CO2 increases far worse than current models predict. Veizer may have compounded the problem by some of his statements in interviews, but I still put the blame squarely on the reporters and editors of the National Post, who have gone to a lot of trouble to give a completely misleading picture of the state of the science, of which their use of quotes from Veizer is only one among many examples. –raypierre]

    [Response: p.s.: Ray forgot to mention that we have looked in detail at Veizer’s claims at RealClimate here. If you look especially at the second part of this post, you will understand why I find it difficult to believe that Veizer is just an honest scientist with a different opinion, rather than deliberately trying to deceive the public. -stefan]

  78. wayne davidson Says:

    #69 to be practical especially for those seeking a rapid response, a “standard contrarian playbook” should be written, complete with references and explanations debunking the usual dribble trying to sink in the populace by the help of certain publishers or reporters whom, you never know, might find such a page useful prior to publishing contrarian slime.

  79. Pianoguy Says:

    Hey, tack on 1995 and drop 1964 - that gives six of the top nine Atlantic hurricane seasons occurring in the past 11 years. It’s a pretty dramatic statistic, and constitutes a serious challenge to the credibility of the natural cycle theory, at least until someone posits a convincing non-GW explanation for why this particular natural cycle is so much worse than previous ones.

    (Improper Use of Statistics Alert) Of course, somebody will seize on the fact that 6 of the top 10 Atlantic hurricane seasons have occurred under Democratic administrations, even though Republicans have controlled the White House for most of this period. It’s easy to see how the Krauthammers and Wills would frame it: Do the Democrats’ tolerant policies embolden hurricanes? Or are Democrats just soft on hurricanes?

    Without the post-2000 season the ratio would be 8 of 10 - we’d pick up a Carter, a Nixon, and, yes, another Clinton. (That Clinton - he just couldn’t control himself!) This strengthens the developing storyline that W isn’t REALLY a conservative! ;-)

  80. Michael Jankowski Says:

    I’m not sure why Wiki starts with 1950. NOAA’s website http://www.aoml.noaa.gov/hrd/tcfaq/E11.html has 1851-2004. At a glance, Wiki’s ACE chart looks like the ADO image in the article, which is interesting.

    Throwing 2005 data in there and going back to 1851, the last 10 yrs has 3 of the top 11 (there’s a tie for 10th). The 1950-1964 period also has 3.

    I also found it interesting that the warm and rapidly (anthropogenic?)warming (warm/warming according to CRU http://en.wikipedia.org/wiki/Image:Instrumental_Temperature_Record.png) 1980s had 3 of the lowest ACE values - 4th (1983), 13th (1982), and 21st lowest (1987) of the 155 years of records. The warm and rapidly (anthropogenic?) warming 1990s had 4 in the bottom 32 (1991, 1993, 1994, and 1997), including one in the last decade.

    FWIW, the 1950-2004 linear trendline of ACE vs Year was slightly negative. It only become slightly positive when wild 2005 was added.

    Also FWIW, the 1851-1906 linear trendline (first 46 yrs of the record, as opposed to the last 46 yrs) of ACE vs Year has a slope of 1.20, while the 1950-2005 trendline has a slope of only 0.19. I find this interesting because the 1851-1906 period saw little-to-no warming (which would’ve been considered mostly “natural” anyhow, right?) according to CRU data, while the 1950-2005 period saw warming of about 0.5 deg C - much/all of which is attributed to anthropogenic sources by many. So during a period of supposedly substantial anthropogenic warming, the ACE trend was half an order of magnitude smaller (and as stated earlier, negative without the inclusion of 2005 data) than a period of basically no warming.

    I don’t think those linear trend-lines say anything conclusive, but I found it interesting that the book-ending equivalent length period of time trends in global temperature, one a period of little “natural” variability and one of substantial “anthropogenic global warming,” didn’t seem to correspond well with trends in ACE. Obviously, that’s blunt analysis tool, but interesting to me nonetheless.

  81. Steve Sadlov Says:

    NOAA’s mission is to provide forecasts that are as accurate as possible. If that means looking only at oscillations, then that is what they will do. They will do what gets them the best forecast. In their shoes, that is what I would do as well. Attempting to go into somewhat more speculative areas of causality have, in my own experience, been things I’ve tended to regret later. Some of these areas end up being rat holes or even snake pits.

    [Response: At this point, forecasting hurricane trends based on the supposed future of the AMO seems more speculative and less based on fundamental physics than factoring in the contribution of anthropogenic global warming. –raypierre]

  82. Coby Says:

    In the webpage this blog post is complaining about the only passage I read as relevant to the AMO vs GW hurrican debate is this:

    “Warmer ocean water combined with lower wind shear, weaker easterly trade winds, and a more favorable wind pattern in the mid-levels of the atmosphere are the factors that collectively will favor the development of storms in greater numbers and to greater intensity. Warm water is the energy source for storms while favorable wind patterns limit the wind shear that can tear apart a storm’s building cloud structure.

    This confluence of conditions in the ocean and atmosphere is strongly related to a climate pattern known as the multi-decadal signal, which has been in place since 1995.

    It seems to me that there is one tenuous defense for mentioning the multi-decadal signal and ignoring the possibility that GW is playing a role and that is if this multi-decadal signal is used in their methodolgy for creating the seasonal predictions. This may, if it is the case, imply that this methodology will prove deficient, but it would justify mentioning it and not GW in a public presentation about the upcoming season.

    Anyone know how they derive these storm count predictions?

  83. Urs Neu Says:

    Re 62,63
    Grant, Michael, can you see any regular signal e.g. in the proxy reconstruction of the AMO of Gray et al. (2004):
    last figure in http://www.proclim.ch/products/misc/amopictures.html? What would be the period length and what the peaks? I really can’t. Maybe about a 100y signal, but then we are way out of phase now.

  84. Steve Bloom Says:

    Um, a shift from a 100 year cycle to a 70 year cycle starting in 1900? The whole thing does start to seem a little strained without some explanation for that. As with the PDO, it seems to be a little hard to show that these things don’t just track global temp.

  85. Eli Rabett Says:

    Raypierre made a good point in his response to #77 about the dangers of being defensive in discussing science. The same point was made about 18 years ago by Jerry Mahlman at one of the Congressional hearings in which Hansen discussed climate models:

    “I did get reviews from OMB. I did receive conclusions from them and others that should have been changed in my testimony, according to their assertion that I found unacceptable, and I said that I find this unacceptable and I insist on having the right to offer my own testimony in my own words.

    We in the scientific community demand the right to be wrong because if we do not have the right to be wrong, we have squelched the right to be creative.”

  86. pat neuman Says:

    re 81.

    Steve,

    It cannot be said that NOAA’s National Weather Service (NWS) does “what gets them the best forecast” because NWS has not seriously considered climate change influences on weather, climate and hydrology. Not considering climate change influences in operations and procedures development on weather, climate and hydrology is a failure by the agency in meeting its mission to serve in the public interest. For example…

    In a Jan 2001 letter from the U.S. Office of Special Counsel (OSC):

    “You alleged a substantial and specific danger to public health and
    safety and gross mismanagement by officials at the Department of
    Commerce, National Oceanic and Atmospheric Administration (NOAA),
    National Weather Service (NWS), North Central River Forecast Center
    (NCRFC), Chanhassen, Minnesota. … Specifically, you allege that the
    NWS is not handling the issue of global warming in a way that best
    serves the interest of the public. You believe that NWS does not
    communicate the urgency of the problem and the potential dangers of
    global warming to the public.” (Jan 16, 2001 OSC letter to Patrick
    Neuman, PSC File No. DI-00-2100)

    In a Jan 31, 2006 letter to the DOC Office of Inspector General:

    I learned recently that the mission statement for NASA includes “to
    understand and protect our home planet”. In knowing that, I believe
    that my concerns about hydrologic climate change in the Upper Midwest
    and about global warming, which were identified in OSC File No. DI-00-
    2100, need to be discussed with scientists in NASA in order to gain a
    full understanding of the state of the science in Dec 2000, Jan 2001;
    and currently. For that reason, I request that the matters described
    at the beginning of this letter be pursued further. (Letter from
    Patrick Neuman to DOC Office of Inspector General, Jan 31, 2006)

    To my knowledge, there has been no attempt by the DOC Office of Inspector General, NOAA or NASA to see that discussions take place between NOAA and NASA scientists and administrative staff … in order to gain a full understanding of the state of the science in Dec 2000, Jan 2001; and currently.

    Not considering climate change in operations and procedures is thus a failure by all levels of the federal government and their staffs in meeting its fundamental mission and duty which is to serve in the public interest.

  87. llewelly Says:

    I’m not sure why Wiki starts with 1950. NOAA’s website http://www.aoml.noaa.gov/hrd/tcfaq/E11.html has 1851-2004.

    From the very same link:

    Starting in 1944, systematic aircraft reconnaissance was commenced for monitoring both tropical cyclones and disturbances that had the potential to develop into tropica cyclones. This is why both Neumann et al. (1993) and Landsea (1993) recommend utilizing data since 1944 for computing climatological statistics.

    1950 is simply the next 10 year boundary. Dr. Gray has used 1950 as starting year for a long time. So do many of NOAA’s tables. I imagine wikipedia’s starting with 1950 is inspired by these factors.

  88. llewelly Says:

    I don’t think those linear trend-lines say anything conclusive, but I found it interesting that the book-ending equivalent length period of time trends in global temperature, one a period of little “natural” variability and one of substantial “anthropogenic global warming,” didn’t seem to correspond well with trends in ACE. Obviously, that’s blunt analysis tool, but interesting to me nonetheless.

    For a sharper analysis tool, consider additional forcings, such as the downward forcing of certain aerosols. Mike’s paper, which he already linked to, does this. I think this explains the 1970-1994 low activity period, and much of the post 1870 variance quite well.

  89. Brian Gordon Says:

    Re: 77: Thank you Ray and Stefan for responding to my post about The Post; Ray, your explanation was very helpful. They may publish my letter; they asked for my contact information.

    I agree with Ray that a charismatic speaker who is familiar with the science (and has a high level of integrity) would be very helpful in disarming these debates. However, when the media is actively and deliberately lying….

  90. Stephen Berg Says:

    Bob Carter et al. are at it again. What a piece of garbage this article is!

    Please shred every part of this piece of propaganda. Please!

    http://www.canadafreepress.com/2006/harris061206.htm

  91. Dan Allan Says:

    Re #80

    Michael,
    Your wrote, “Also FWIW, the 1851-1906 linear trendline (first 46 yrs of the record, as opposed to the last 46 yrs) of ACE vs Year has a slope of 1.20, while the 1950-2005 trendline has a slope of only 0.19. I find this interesting because the 1851-1906 period saw little-to-no warming”

    But if you believe, as other skeptics of the hurricane / AGW link do, that we are in a natural AMO-related cycle high activity, and that it is likely to continue for another ten years, than the more meaningful trendline would be 1950 to 2016, to include the complete set of both high-activity periods. And, if the proponents of AMO explanation are correct that activity will continue to be high, then the trendline will turn out quite positive indeed for the period 1950-2016. So it seems like the purely natural-cycle explanation will still leave unexplained a higher spike this time around versus the previous period of high activiy. Unless, of course, the AMO-based prediction is wrong and activity drops off in the next couple of years. Which neither side is predicting.

  92. wayne davidson Says:

    The purposeful disconnect that skeptic contrarians use is that AMO is responsible to Hurricane activity, from a small 0.4 C peak to peak SSTA curve, with temperature phases at times not quite fitting with the number of hurricanes, but their strong point is that the AMO went cold between 1960-1995 when, if Global Warming is occuring should be otherwise. They rely on a weak oscillation occuring twice in the last 100 years to make their point, while at the same time GT’s have been striking near +1 C in the Northern Hemisphere. Their favorite disconnect is with land based temperature increases, as if there is a barried at oceanic shore lines, as if air stops flowing
    to the ocean, or land based warmed air has a pittance of any effect with the atmosphere where Hurricanes dwell. As often stated the oceans are different than their atmospheres above, however constant harping of the AMO curve does not mean that the atmosphere has nothing to do with Hurricanes!

  93. Ron Taylor Says:

    Re #90 - You or someone more qualified than I must respond to the Canada Free Press.

    I sometimes wonder if Gray, Mayfield, et al, have a world view problem. In their world view, climate is a given of the earth and within that given, they try to predict the weather, specifically, hurricanes. So just study the patterns provided by nature to determine the context within which weather is generated. The idea of analyzing the physics of climate opens up too many uncertainties and undermines their sense of control over their own work. It is a little like a creationist biologist trying to analyze biological processes without any reference to or recognition of evolution.

  94. shargash Says:

    I’m going to embarrass myself with a dumb question: how do we know